| Param | Original file | Final file |
|---|---|---|
| Filename | modeM0/AS1T01_207T01_9000001720_11663cztM0_level2.evt | modeM0/AS1T01_207T01_9000001720_11663cztM0_level2_quad_clean.evt |
| Size (bytes) | 506,194,560 | 66,352,320 |
| Size | 482.7 MB | 63.3 MB |
| Events in quadrant A | 7,081,809 | 357,708 |
| Events in quadrant B | 2,828,400 | 441,494 |
| Events in quadrant C | 2,376,301 | 436,629 |
| Events in quadrant D | 2,696,807 | 414,534 |
| Mode M0 | |||
|---|---|---|---|
| Quadrant | BADHDUFLAG | Total packets | Discarded packets |
| A | 0 | 24603 | 1 |
| B | 0 | 11740 | 0 |
| C | 0 | 10445 | 0 |
| D | 0 | 11408 | 0 |
| Mode M9 | |||
|---|---|---|---|
| Quadrant | BADHDUFLAG | Total packets | Discarded packets |
| A | 0 | 12 | 0 |
| B | 0 | 12 | 0 |
| C | 0 | 12 | 0 |
| D | 0 | 12 | 0 |
| Mode SS | |||
|---|---|---|---|
| Quadrant | BADHDUFLAG | Total packets | Discarded packets |
| A | 0 | 102 | 0 |
| B | 0 | 102 | 0 |
| C | 0 | 102 | 0 |
| D | 0 | 102 | 0 |
| Quadrant | Total seconds | Saturated seconds | Saturation percentage |
|---|---|---|---|
| A | 5120 | 1571 | 30.683594% |
| B | 5120 | 112 | 2.187500% |
| C | 5120 | 17 | 0.332031% |
| D | 5120 | 37 | 0.722656% |
Noise dominated data is calculated using 1-second bins in cleaned event files. If a bin has >2000 counts, and if more than 50% of those come from <1% of pixels, then it is considered to be noise-dominated and hence unusable.
| Quadrant | # 1 sec bins | Bins with >0 counts | Bins with >2000 counts | High rate bins dominated by noise | Noise dominated (total time) | Noise dominated (detector-on time) | Marked lightcurve |
|---|---|---|---|---|---|---|---|
| A | 6256 | 5120 | 1129 | 1129 | 18.05% | 22.05% | 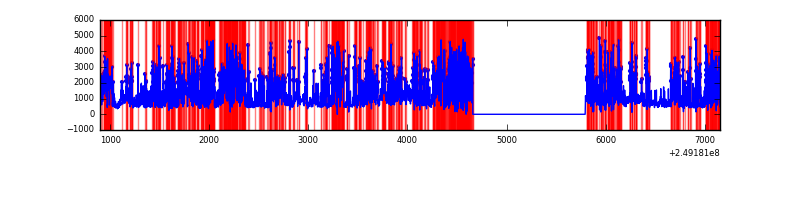 |
| B | 6256 | 5122 | 35 | 35 | 0.56% | 0.68% |  |
| C | 6256 | 5122 | 0 | 0 | 0.00% | 0.00% | 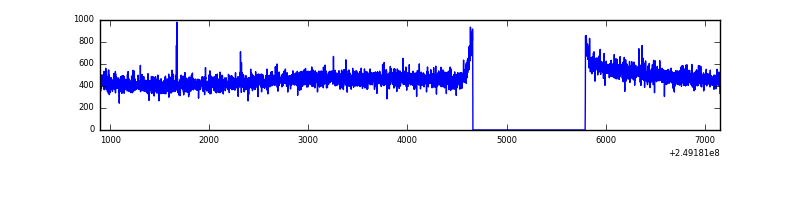 |
| D | 6256 | 5122 | 17 | 17 | 0.27% | 0.33% | 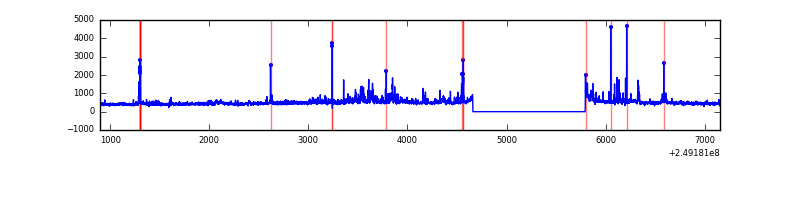 |
Top three noisy pixels from each quadrant. If the there are fewer than three noisy pixels in the level2.evt file, extra rows are filled as -1
| Pixel properties | Quadrant properties | ||||||
|---|---|---|---|---|---|---|---|
| Quadrant | DetID | PixID | Counts | Sigma | Mean | Median | Sigma |
| A | 8 | 5 | 4736959 | 44098.06 | 525 | 514 | 107.4 |
| A | 1 | 162 | 114715 | 1063.25 | 525 | 514 | 107.4 |
| A | 1 | 178 | 68652 | 634.39 | 525 | 514 | 107.4 |
| B | 4 | 239 | 325469 | 2800.0 | 613 | 597 | 116.0 |
| B | 15 | 204 | 50460 | 429.76 | 613 | 597 | 116.0 |
| B | 3 | 64 | 29867 | 252.27 | 613 | 597 | 116.0 |
| C | 13 | 61 | 4425 | 27.21 | 608 | 613 | 140.1 |
| C | 14 | 234 | 2550 | 13.83 | 608 | 613 | 140.1 |
| C | 3 | 202 | 1491 | 6.27 | 608 | 613 | 140.1 |
| D | 13 | 104 | 168703 | 1181.75 | 599 | 584 | 142.3 |
| D | 10 | 157 | 116917 | 817.73 | 599 | 584 | 142.3 |
| D | 9 | 68 | 41133 | 285.03 | 599 | 584 | 142.3 |
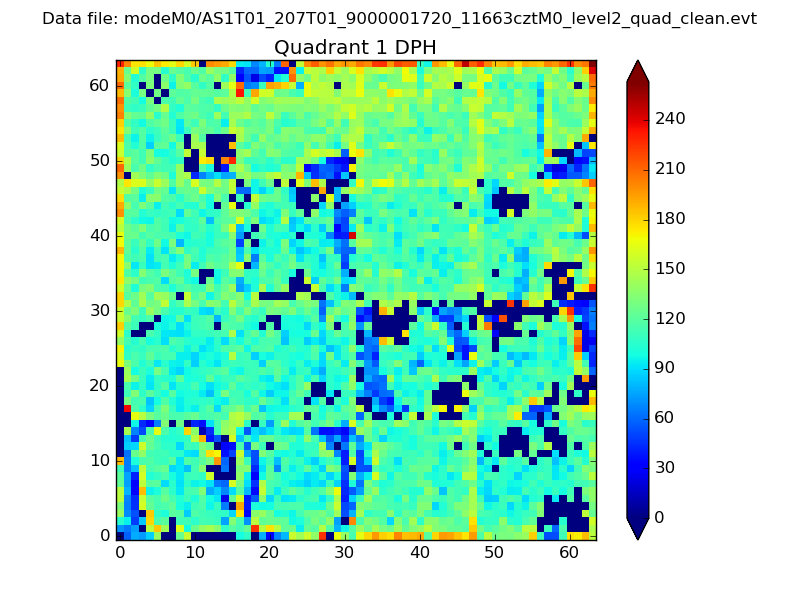
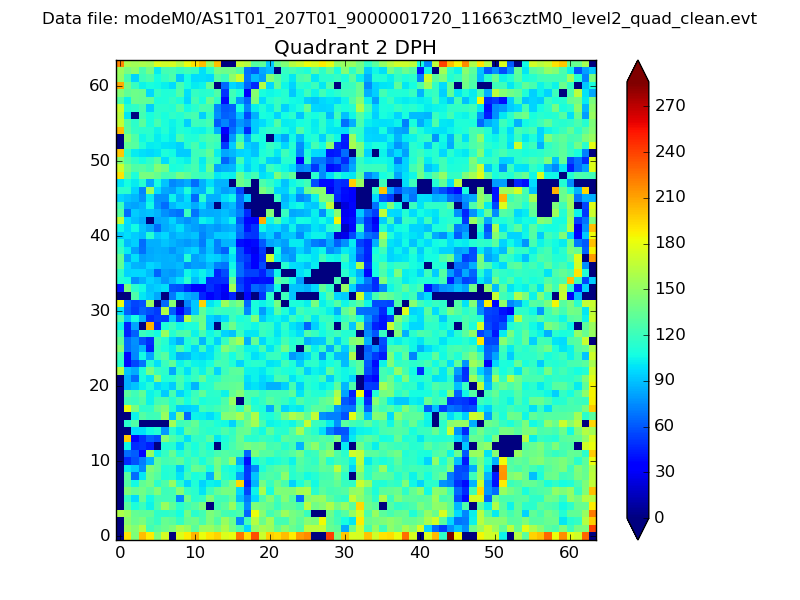
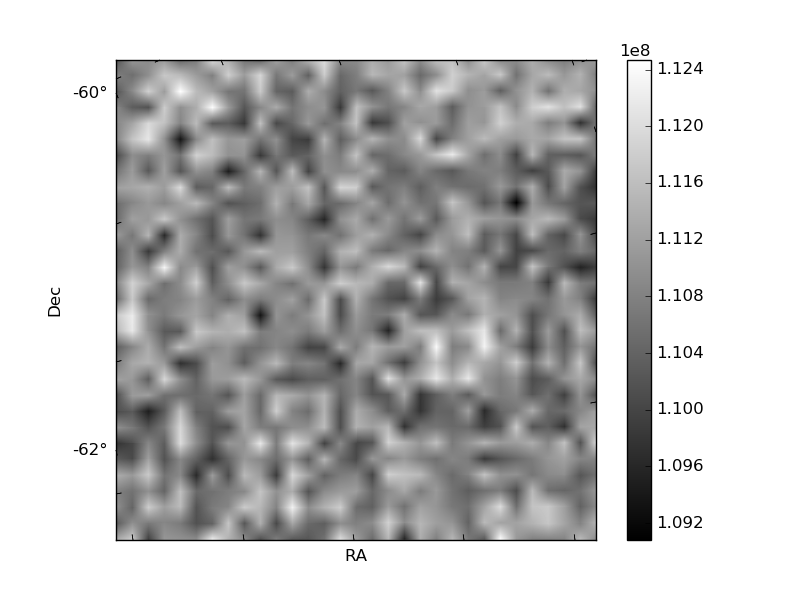
Histogram calculated using DETX and DETY for each event in the final _common_clean file
| Quadrant A | 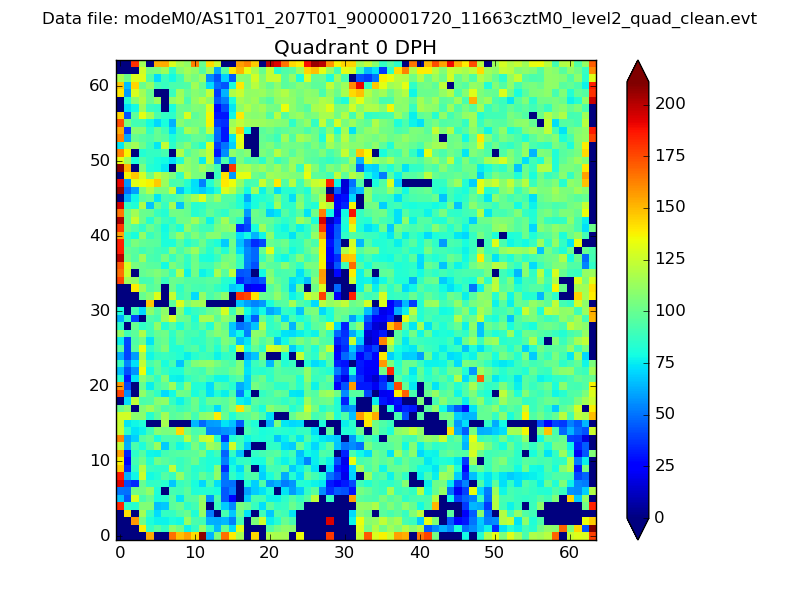 |
 |
Quadrant B |
|---|---|---|---|
| Quadrant D | 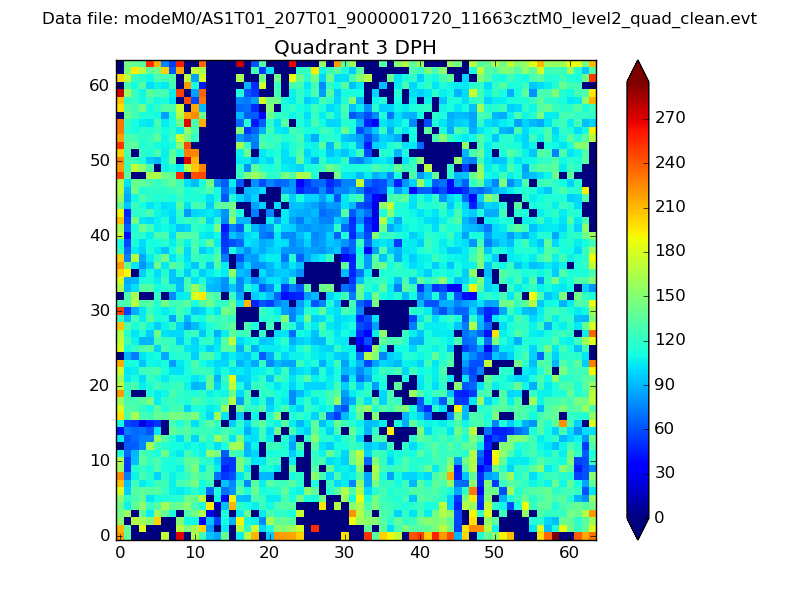 |
 |
Quadrant C |
| Plot type | Count rate plots | Images |
|---|---|---|
| Comparison with Poisson distribution Blue bars denote a histogram of data divided into 1 sec bins. Red curve is a Poisson curve with rate = median count rate of data. |
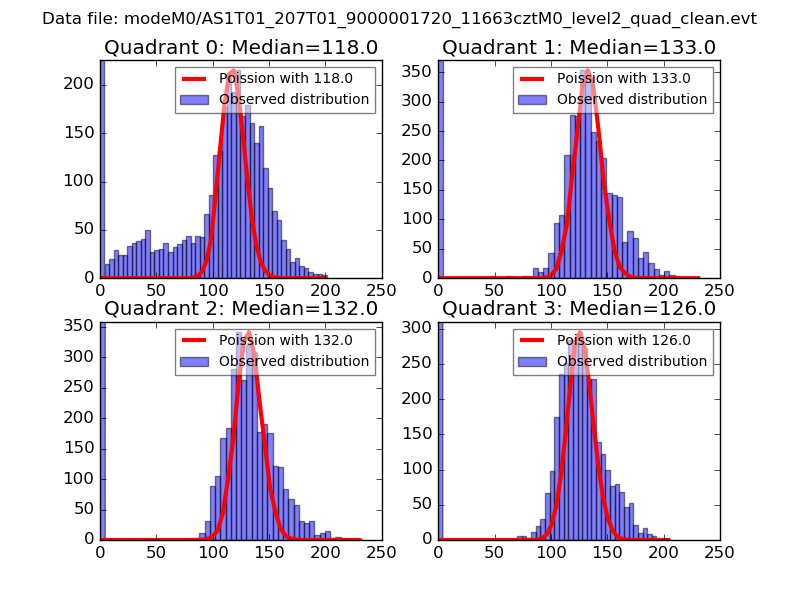 |
 |
| Quadrant-wise count rates Data is divided into 100 sec bins |
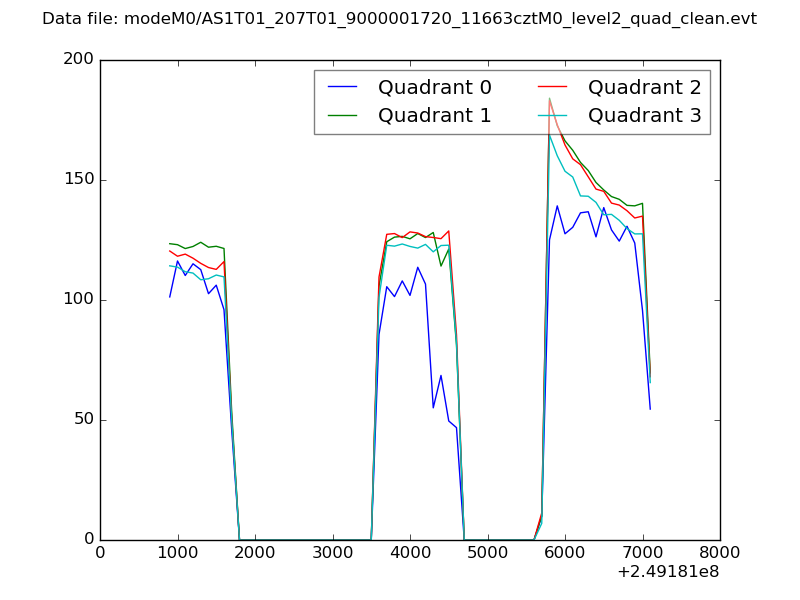 |
|
| Module-wise count rates for Quadrant A Data is divided into 100 sec bins |
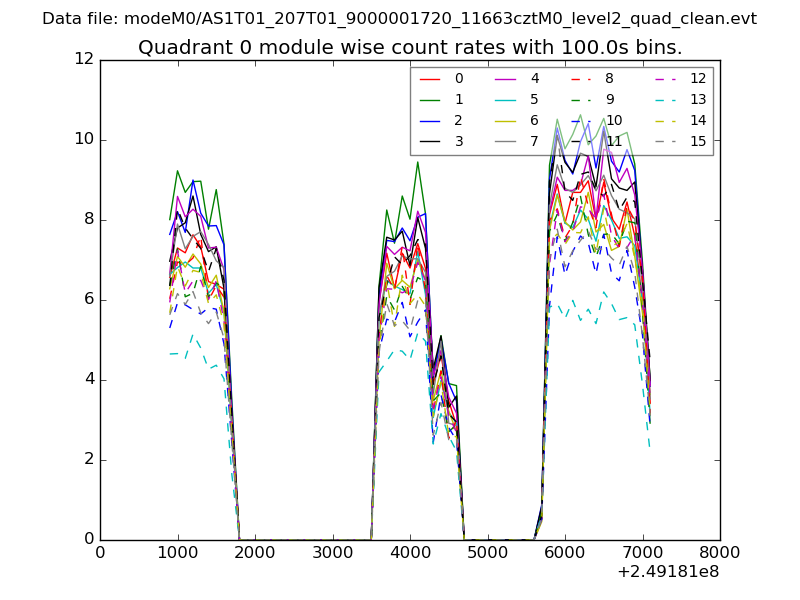 |
 |
| Module-wise count rates for Quadrant B Data is divided into 100 sec bins |
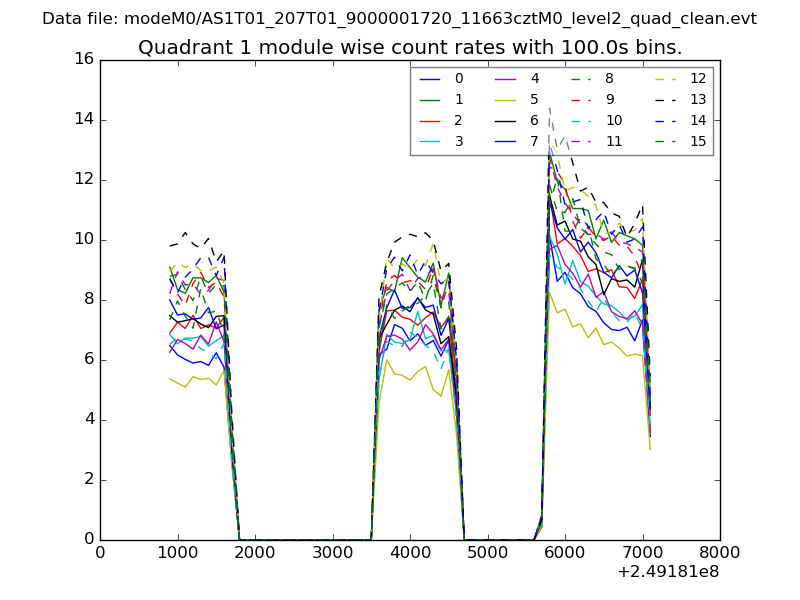 |
 |
| Module-wise count rates for Quadrant C Data is divided into 100 sec bins |
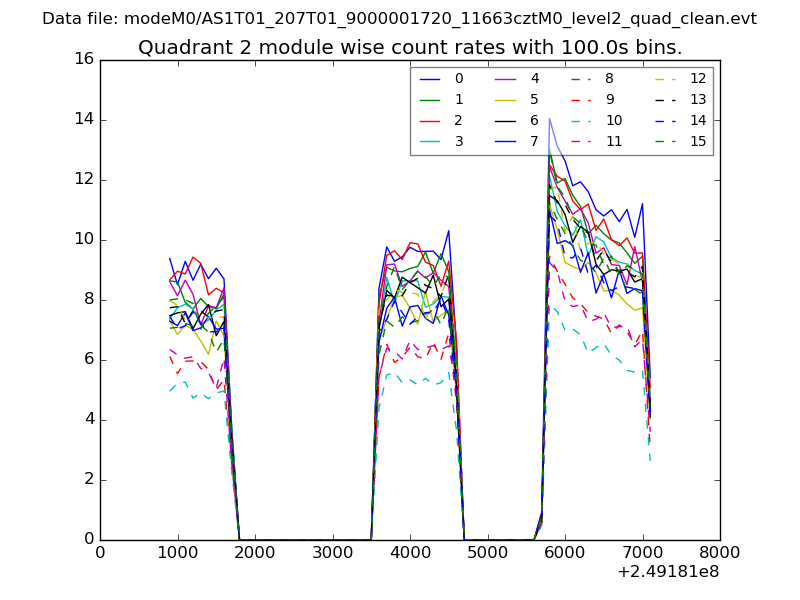 |
 |
| Module-wise count rates for Quadrant D Data is divided into 100 sec bins |
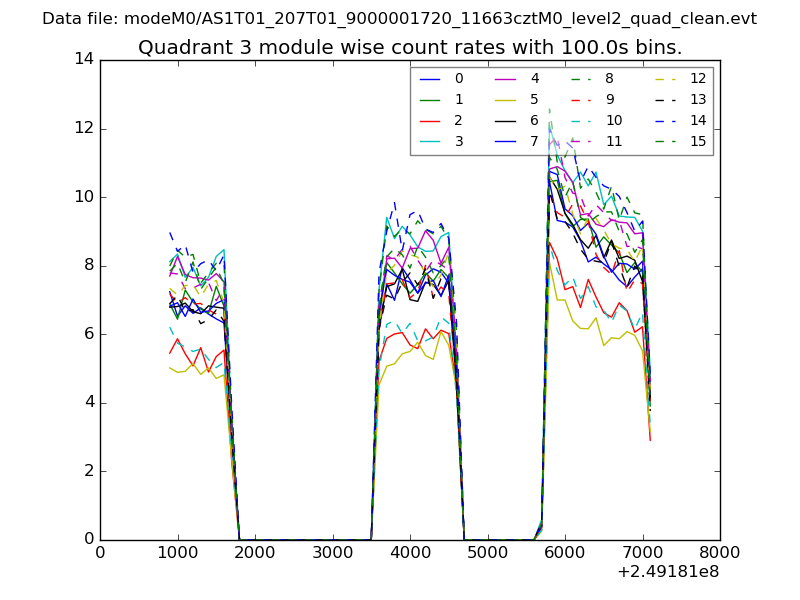 |
 |
| Parameter | Plot |
|---|---|
| CZT HV Monitor | 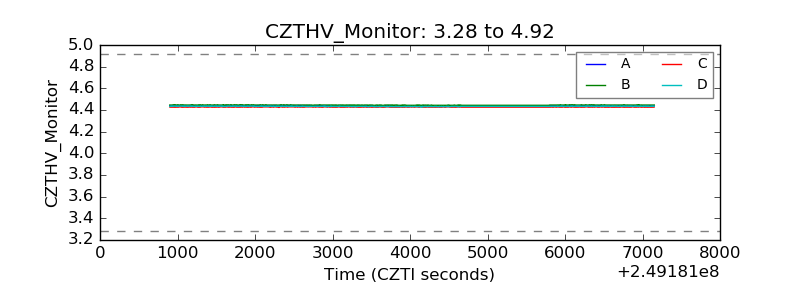 |
| D_VDD | 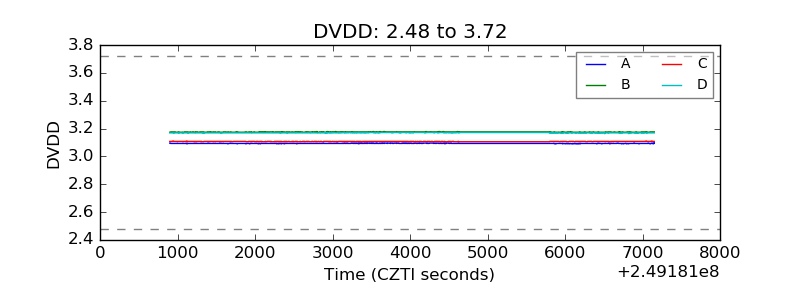 |
| Temperature 1 | 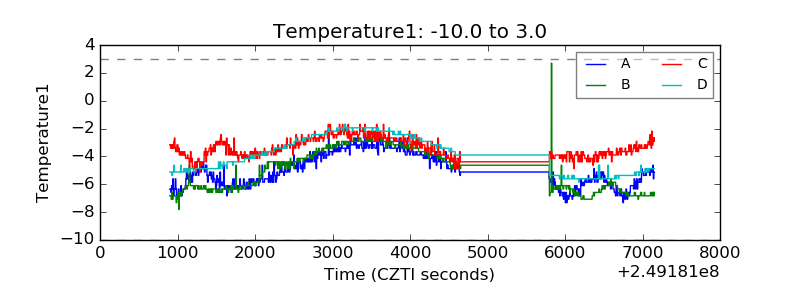 |
| Veto HV Monitor | 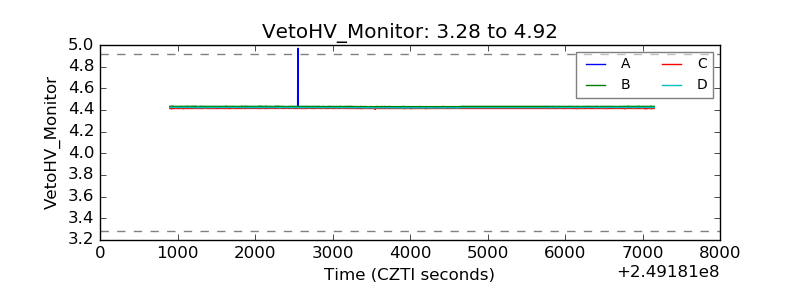 |
| Veto LLD | 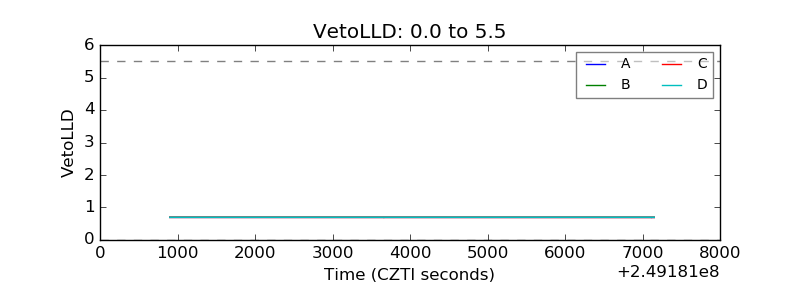 |
| Alpha Counter | 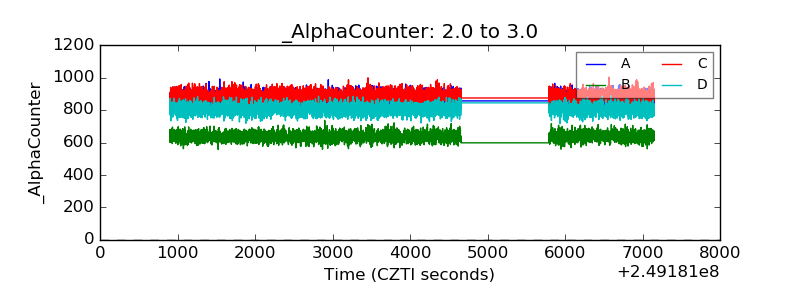 |
| _CPM_Rate | 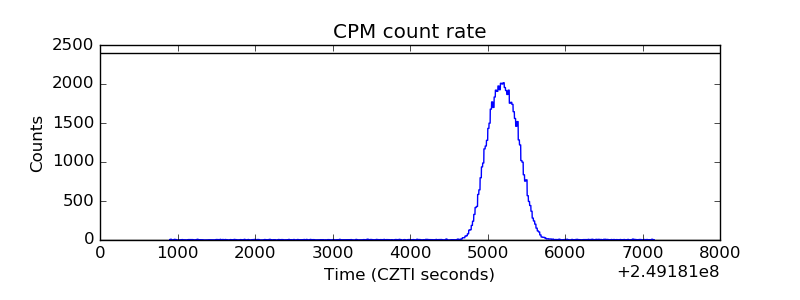 |
| CZT Counter | 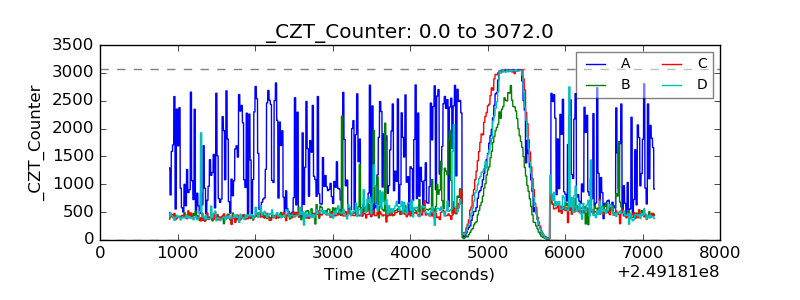 |
| +2.5 Volts monitor |  |
| +5 Volts monitor |  |
| _ROLL_ROT | 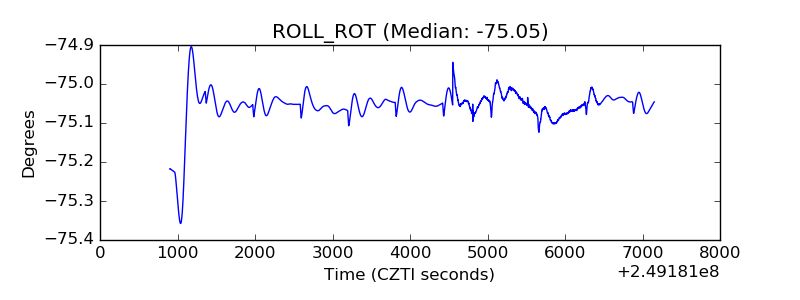 |
| _Roll_DEC | 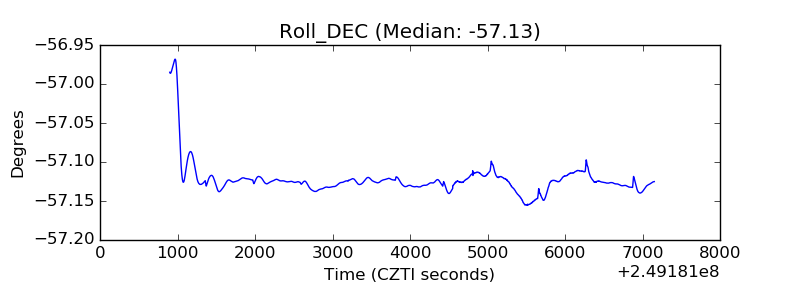 |
| _Roll_RA | 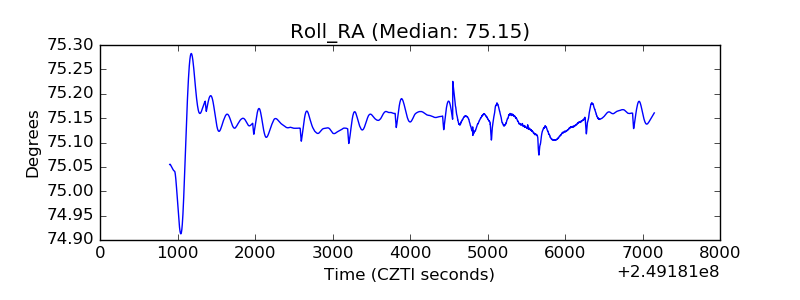 |
| Veto Counter | 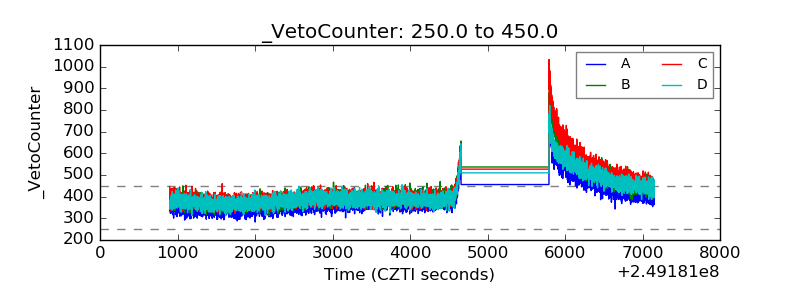 |