| Param | Original file | Final file |
|---|---|---|
| Filename | modeM0/AS1T01_207T01_9000001720_11664cztM0_level2.evt | modeM0/AS1T01_207T01_9000001720_11664cztM0_level2_quad_clean.evt |
| Size (bytes) | 620,507,520 | 97,035,840 |
| Size | 591.8 MB | 92.5 MB |
| Events in quadrant A | 7,697,017 | 570,914 |
| Events in quadrant B | 4,076,207 | 649,620 |
| Events in quadrant C | 3,117,323 | 654,846 |
| Events in quadrant D | 3,471,405 | 619,576 |
| Mode M0 | |||
|---|---|---|---|
| Quadrant | BADHDUFLAG | Total packets | Discarded packets |
| A | 0 | 27354 | 2 |
| B | 0 | 16164 | 1 |
| C | 0 | 13245 | 1 |
| D | 0 | 14393 | 1 |
| Mode M9 | |||
|---|---|---|---|
| Quadrant | BADHDUFLAG | Total packets | Discarded packets |
| A | 0 | 17 | 0 |
| B | 0 | 17 | 0 |
| C | 0 | 17 | 0 |
| D | 0 | 18 | 0 |
| Mode SS | |||
|---|---|---|---|
| Quadrant | BADHDUFLAG | Total packets | Discarded packets |
| A | 0 | 128 | 0 |
| B | 0 | 128 | 0 |
| C | 0 | 128 | 0 |
| D | 0 | 128 | 0 |
| Quadrant | Total seconds | Saturated seconds | Saturation percentage |
|---|---|---|---|
| A | 6355 | 1514 | 23.823761% |
| B | 6355 | 315 | 4.956727% |
| C | 6355 | 52 | 0.818253% |
| D | 6355 | 107 | 1.683714% |
Noise dominated data is calculated using 1-second bins in cleaned event files. If a bin has >2000 counts, and if more than 50% of those come from <1% of pixels, then it is considered to be noise-dominated and hence unusable.
| Quadrant | # 1 sec bins | Bins with >0 counts | Bins with >2000 counts | High rate bins dominated by noise | Noise dominated (total time) | Noise dominated (detector-on time) | Marked lightcurve |
|---|---|---|---|---|---|---|---|
| A | 7541 | 6357 | 1001 | 1001 | 13.27% | 15.75% | 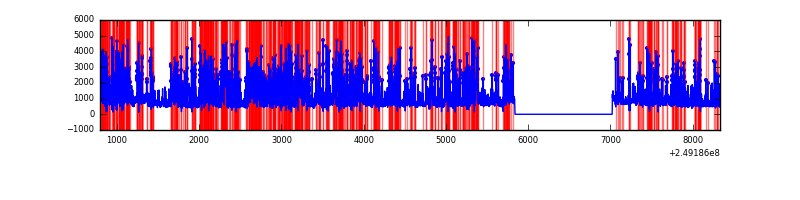 |
| B | 7541 | 6357 | 144 | 144 | 1.91% | 2.27% | 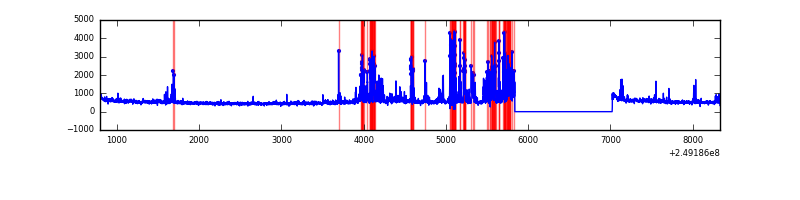 |
| C | 7541 | 6357 | 0 | 0 | 0.00% | 0.00% | 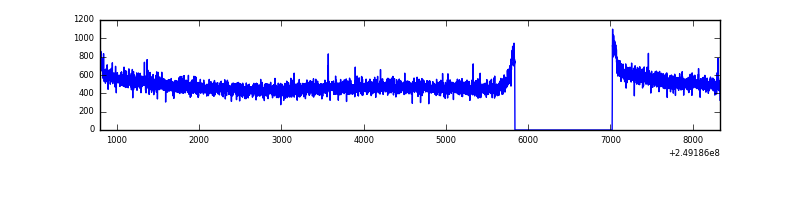 |
| D | 7541 | 6357 | 22 | 22 | 0.29% | 0.35% | 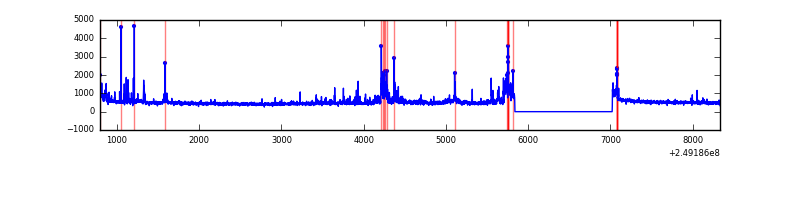 |
Top three noisy pixels from each quadrant. If the there are fewer than three noisy pixels in the level2.evt file, extra rows are filled as -1
| Pixel properties | Quadrant properties | ||||||
|---|---|---|---|---|---|---|---|
| Quadrant | DetID | PixID | Counts | Sigma | Mean | Median | Sigma |
| A | 8 | 5 | 4469852 | 30907.95 | 718 | 704 | 144.6 |
| A | 1 | 162 | 176321 | 1214.54 | 718 | 704 | 144.6 |
| A | 1 | 178 | 98574 | 676.85 | 718 | 704 | 144.6 |
| B | 4 | 239 | 447973 | 3025.21 | 791 | 772 | 147.8 |
| B | 3 | 64 | 411012 | 2775.17 | 791 | 772 | 147.8 |
| B | 15 | 204 | 57758 | 385.5 | 791 | 772 | 147.8 |
| C | 13 | 61 | 5955 | 28.34 | 799 | 803 | 181.8 |
| C | 14 | 234 | 3021 | 12.2 | 799 | 803 | 181.8 |
| C | 3 | 202 | 2026 | 6.73 | 799 | 803 | 181.8 |
| D | 13 | 104 | 294063 | 1578.9 | 782 | 762 | 185.8 |
| D | 10 | 157 | 82054 | 437.61 | 782 | 762 | 185.8 |
| D | 9 | 68 | 41260 | 218.01 | 782 | 762 | 185.8 |
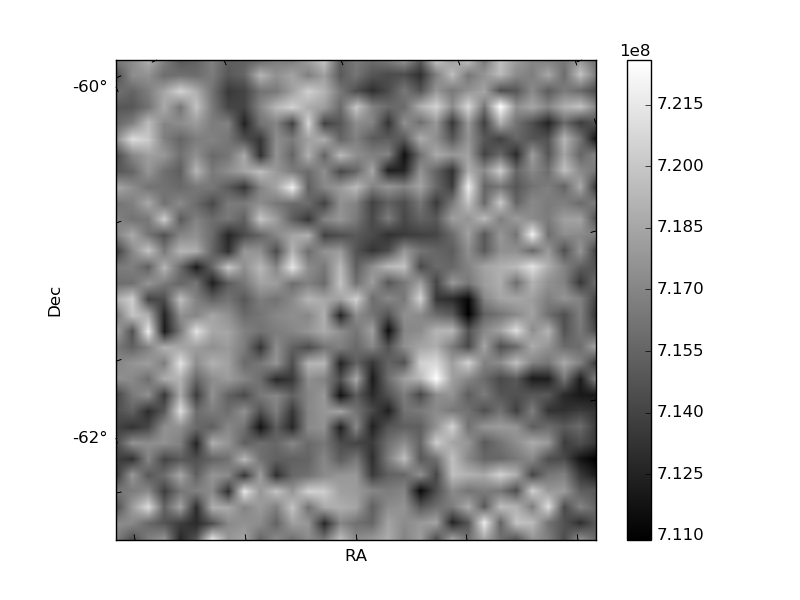
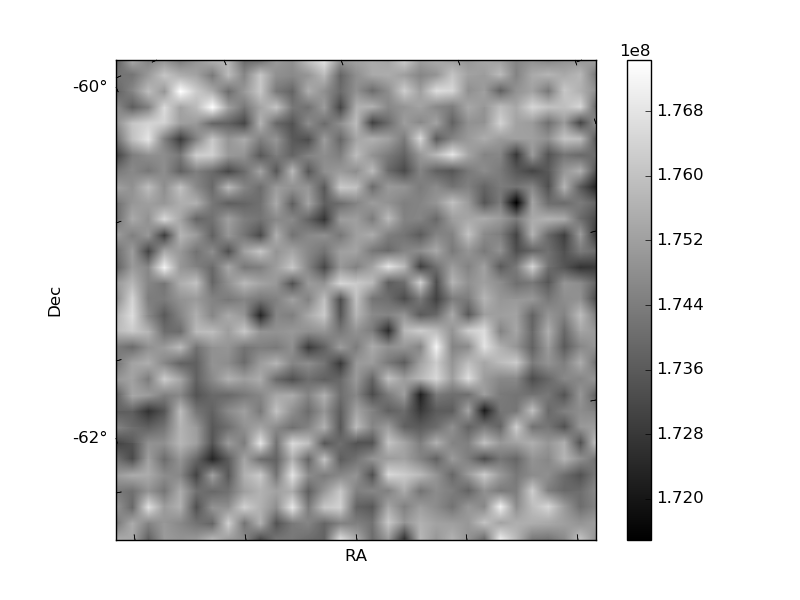
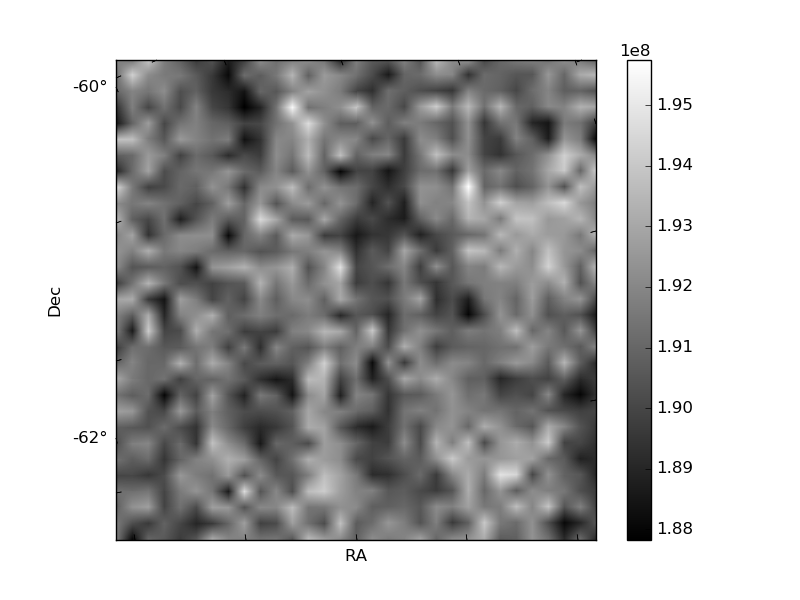
Histogram calculated using DETX and DETY for each event in the final _common_clean file
| Quadrant A | 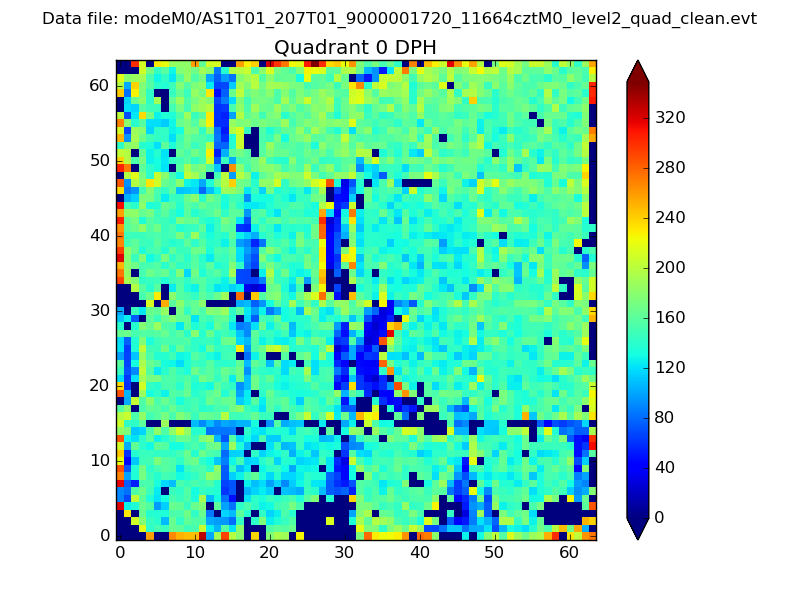 |
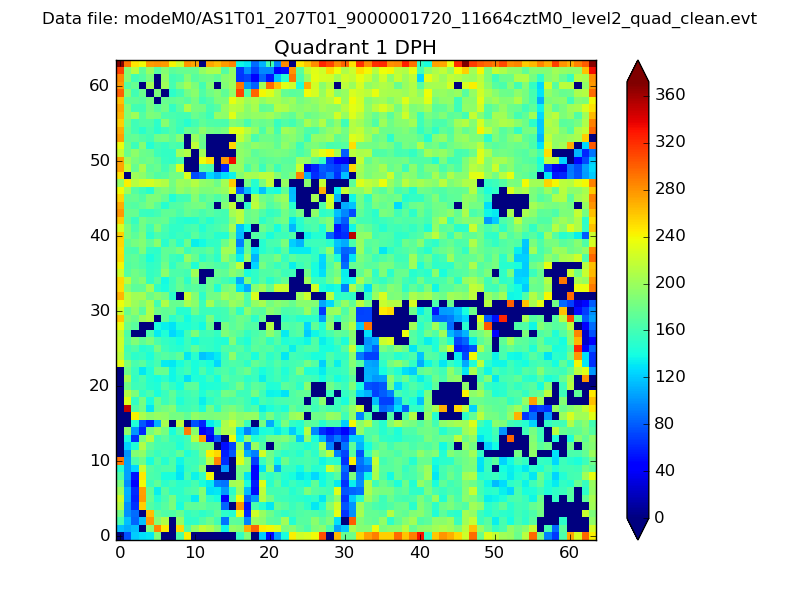 |
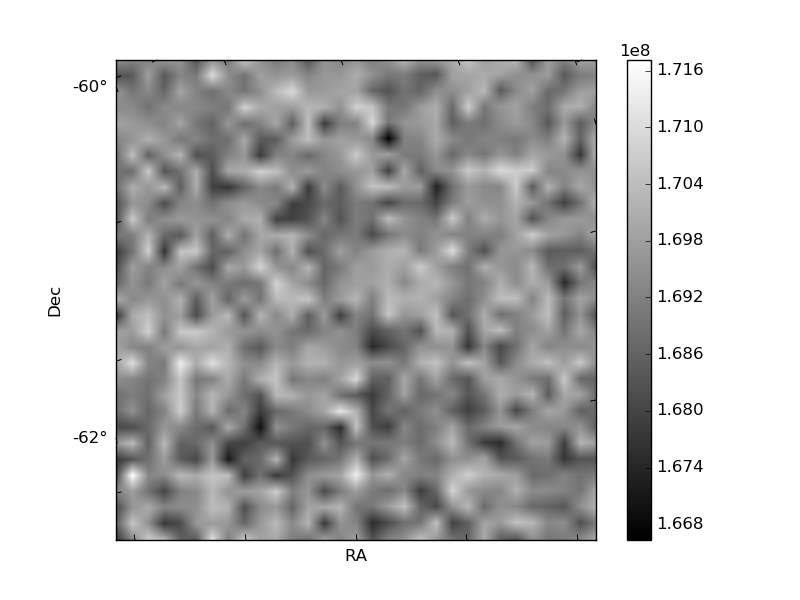
Quadrant B |
|---|---|---|---|
| Quadrant D | 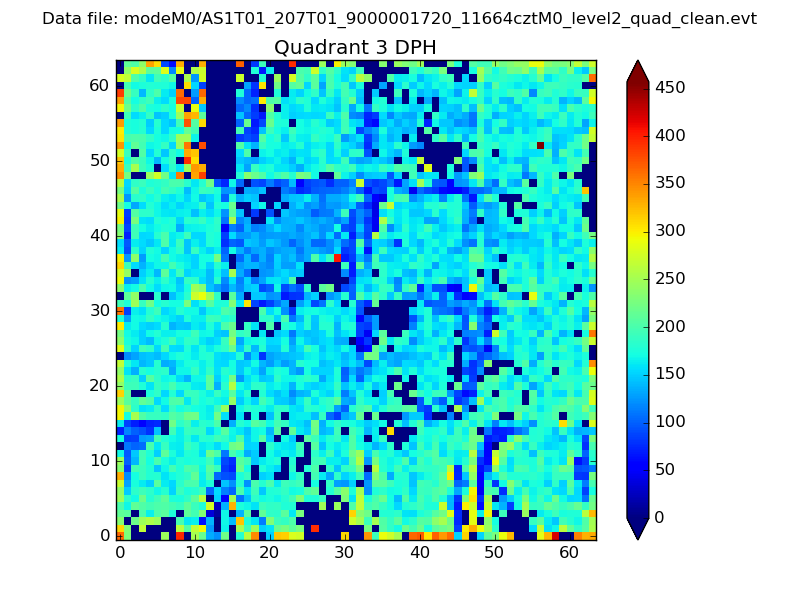 |
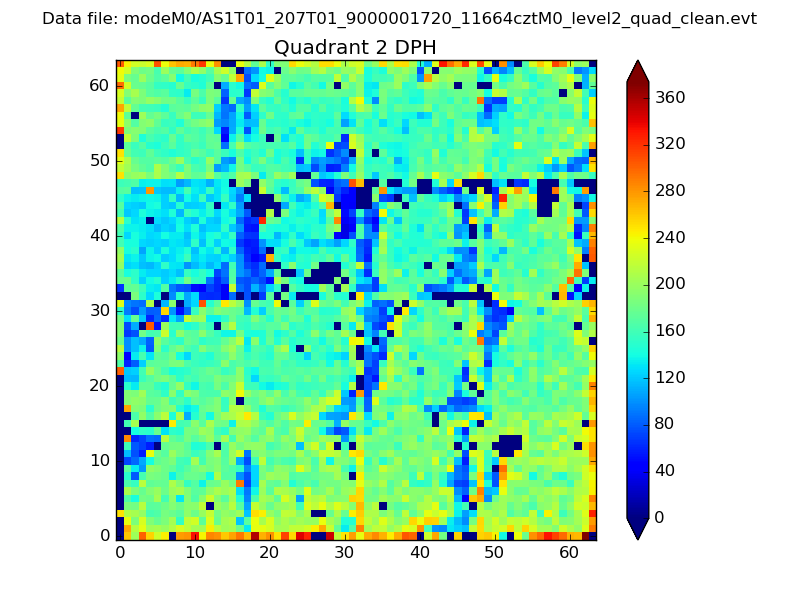 |
Quadrant C |
| Plot type | Count rate plots | Images |
|---|---|---|
| Comparison with Poisson distribution Blue bars denote a histogram of data divided into 1 sec bins. Red curve is a Poisson curve with rate = median count rate of data. |
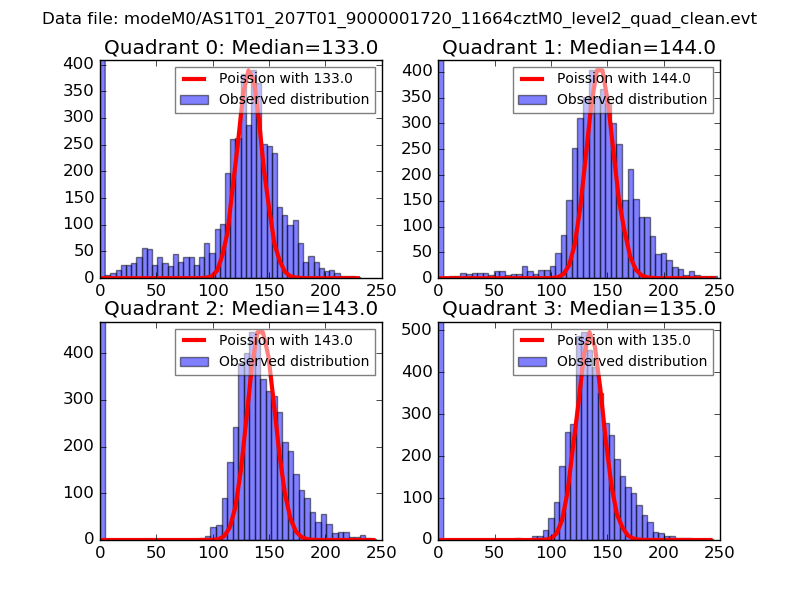 |
 |
| Quadrant-wise count rates Data is divided into 100 sec bins |
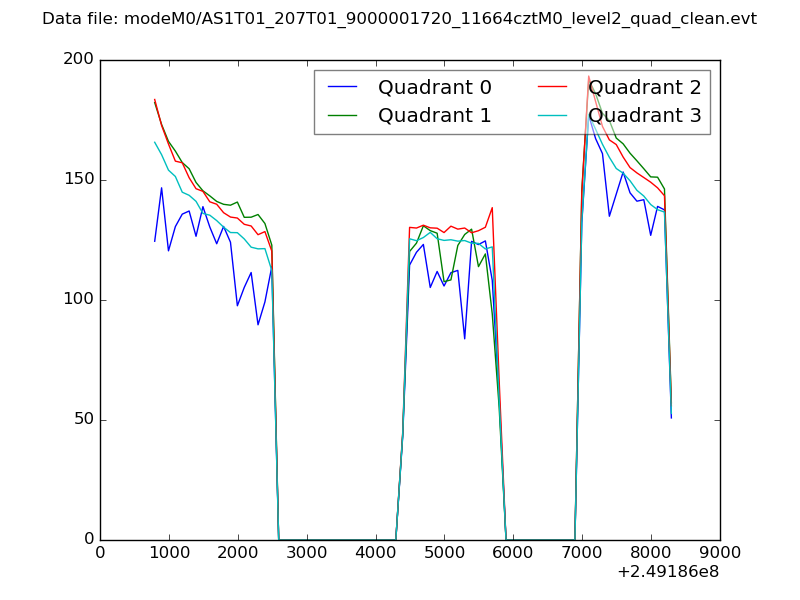 |
|
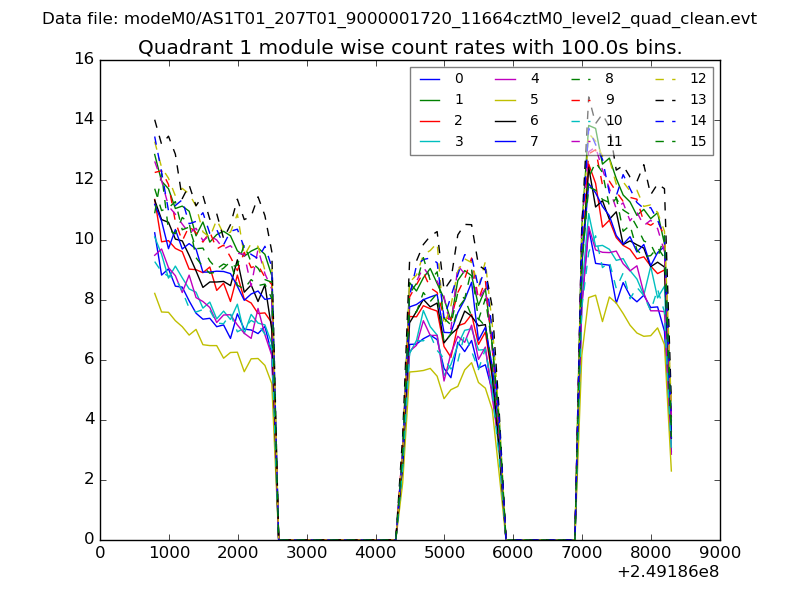
| Module-wise count rates for Quadrant A Data is divided into 100 sec bins |
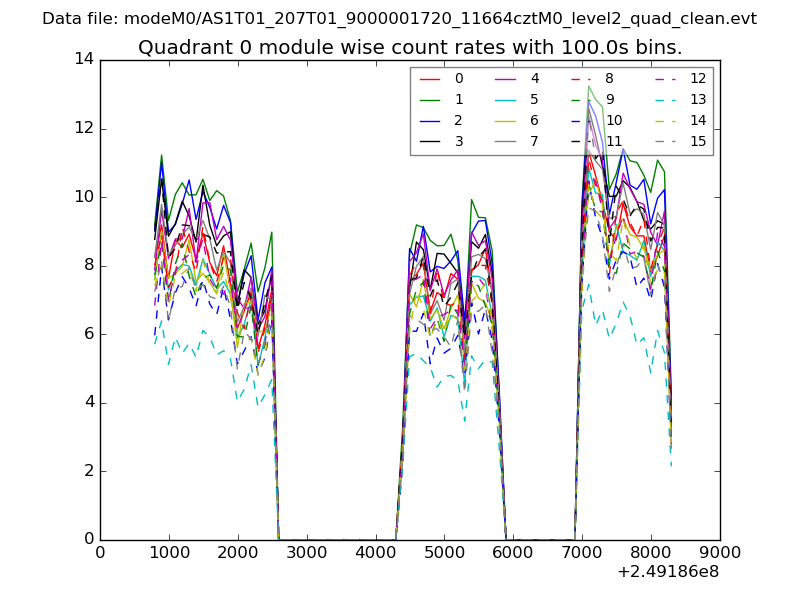 |
 |
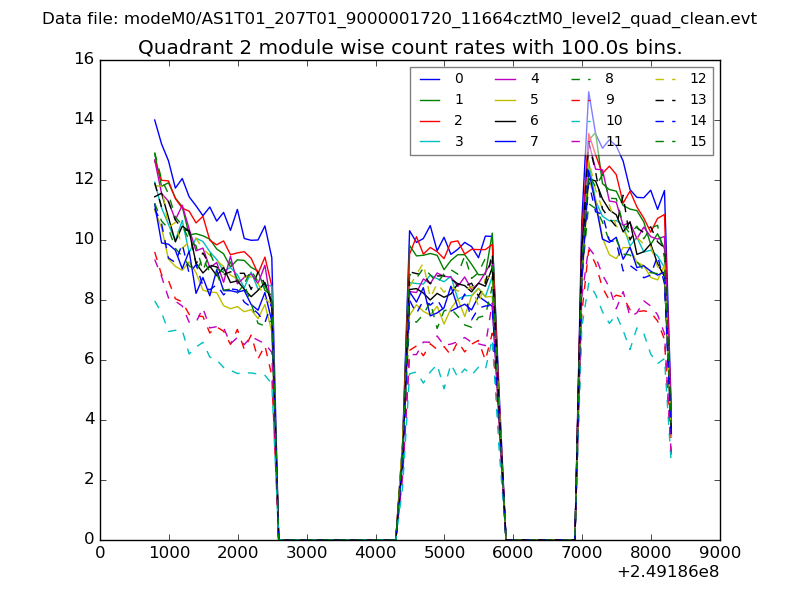
| Module-wise count rates for Quadrant B Data is divided into 100 sec bins |
 |
 |
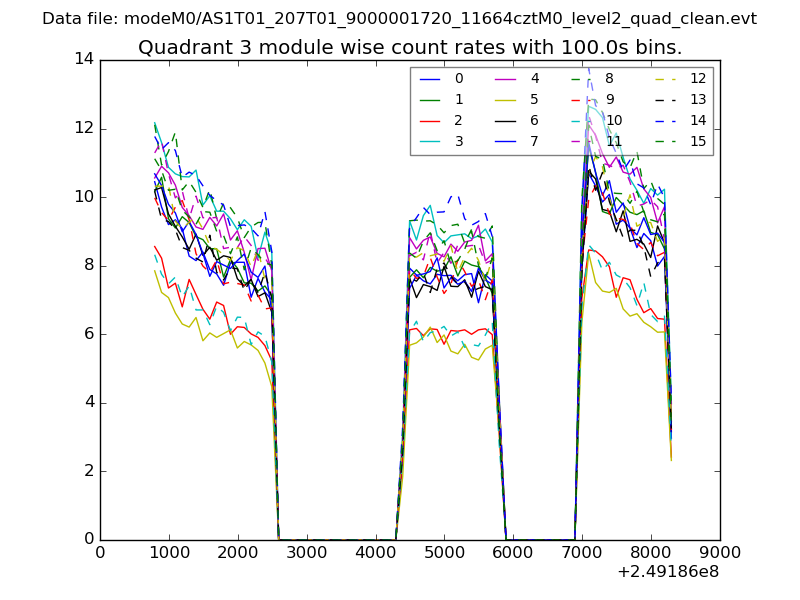
| Module-wise count rates for Quadrant C Data is divided into 100 sec bins |
 |
 |
| Module-wise count rates for Quadrant D Data is divided into 100 sec bins |
 |
 |
| Parameter | Plot |
|---|---|
| CZT HV Monitor | 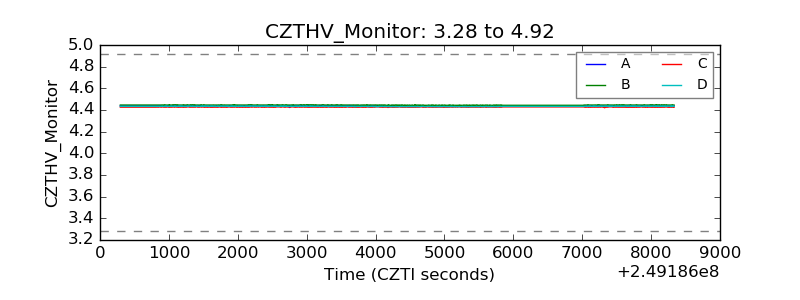 |
| D_VDD |  |
| Temperature 1 | 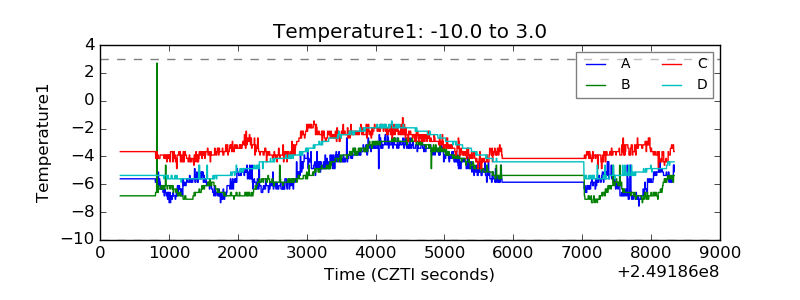 |
| Veto HV Monitor | 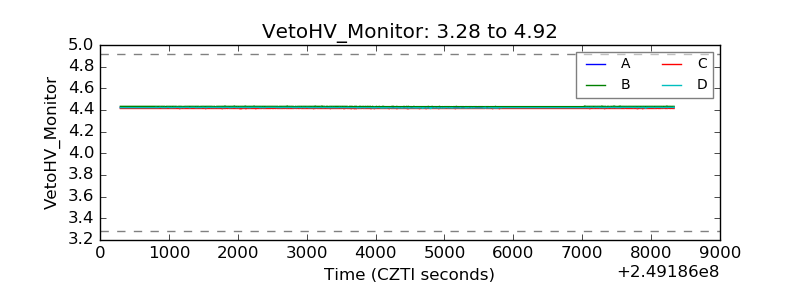 |
| Veto LLD | 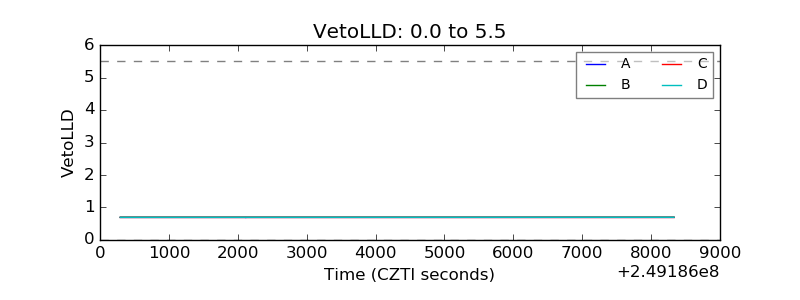 |
| Alpha Counter | 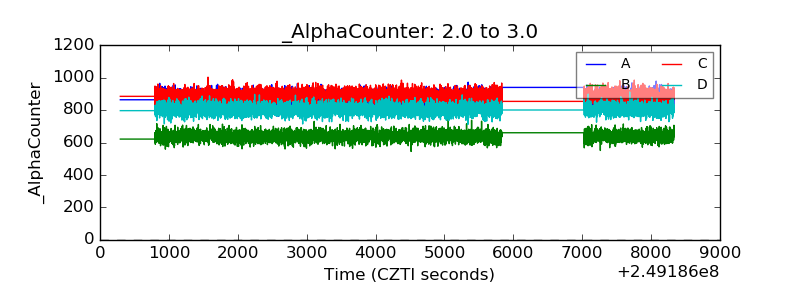 |
| _CPM_Rate | 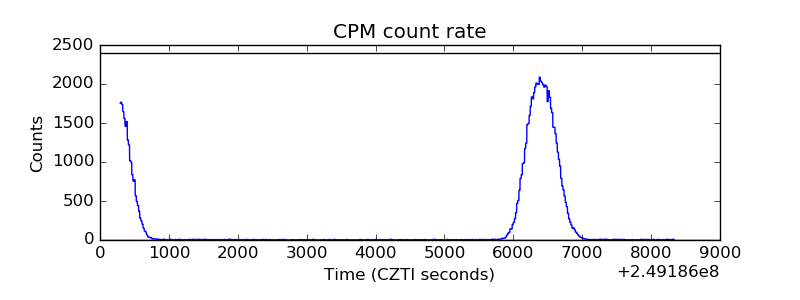 |
| CZT Counter | 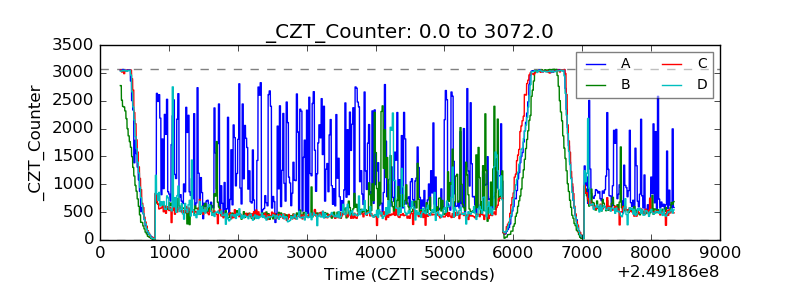 |
| +2.5 Volts monitor |  |
| +5 Volts monitor |  |
| _ROLL_ROT | 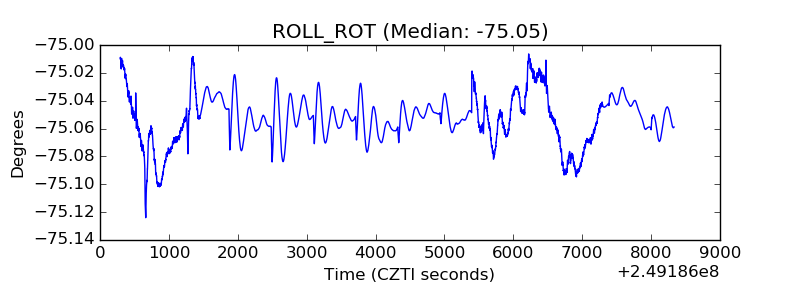 |
| _Roll_DEC | 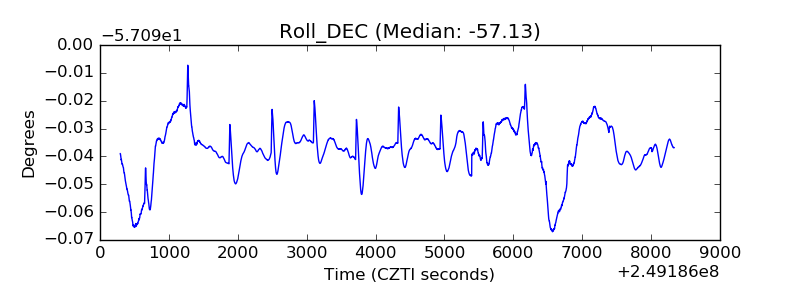 |
| _Roll_RA | 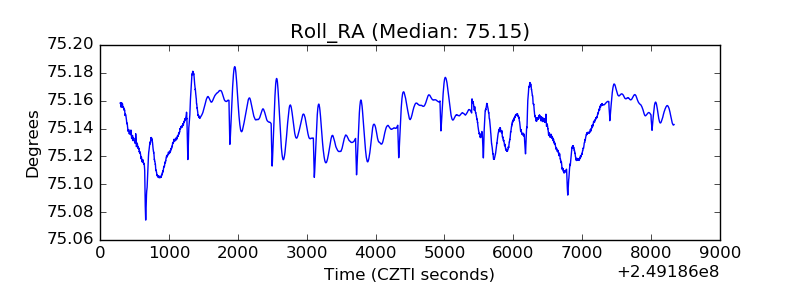 |
| Veto Counter | 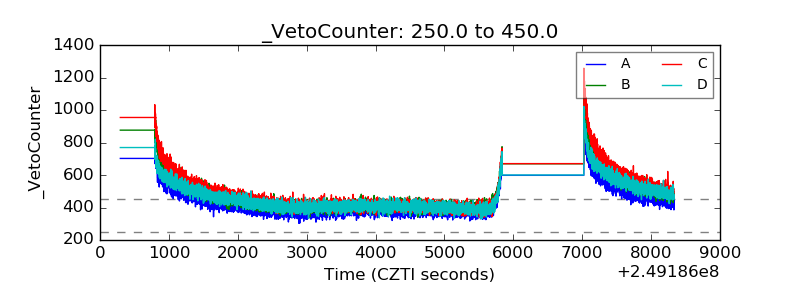 |