| Param | Original file | Final file |
|---|---|---|
| Filename | modeM0/AS1T01_207T01_9000001720_11665cztM0_level2.evt | modeM0/AS1T01_207T01_9000001720_11665cztM0_level2_quad_clean.evt |
| Size (bytes) | 541,653,120 | 82,874,880 |
| Size | 516.6 MB | 79.0 MB |
| Events in quadrant A | 5,411,670 | 512,993 |
| Events in quadrant B | 4,067,623 | 540,126 |
| Events in quadrant C | 2,879,663 | 537,880 |
| Events in quadrant D | 3,649,308 | 510,371 |
| Mode M0 | |||
|---|---|---|---|
| Quadrant | BADHDUFLAG | Total packets | Discarded packets |
| A | 0 | 20133 | 3 |
| B | 0 | 15629 | 1 |
| C | 0 | 12073 | 1 |
| D | 0 | 14515 | 1 |
| Mode M9 | |||
|---|---|---|---|
| Quadrant | BADHDUFLAG | Total packets | Discarded packets |
| A | 0 | 12 | 0 |
| B | 0 | 12 | 0 |
| C | 0 | 12 | 0 |
| D | 0 | 12 | 0 |
| Mode SS | |||
|---|---|---|---|
| Quadrant | BADHDUFLAG | Total packets | Discarded packets |
| A | 0 | 120 | 0 |
| B | 0 | 120 | 0 |
| C | 0 | 120 | 0 |
| D | 0 | 120 | 0 |
| Quadrant | Total seconds | Saturated seconds | Saturation percentage |
|---|---|---|---|
| A | 5835 | 654 | 11.208226% |
| B | 5835 | 393 | 6.735219% |
| C | 5835 | 24 | 0.411311% |
| D | 5835 | 207 | 3.547558% |
Noise dominated data is calculated using 1-second bins in cleaned event files. If a bin has >2000 counts, and if more than 50% of those come from <1% of pixels, then it is considered to be noise-dominated and hence unusable.
| Quadrant | # 1 sec bins | Bins with >0 counts | Bins with >2000 counts | High rate bins dominated by noise | Noise dominated (total time) | Noise dominated (detector-on time) | Marked lightcurve |
|---|---|---|---|---|---|---|---|
| A | 7122 | 5837 | 436 | 436 | 6.12% | 7.47% | 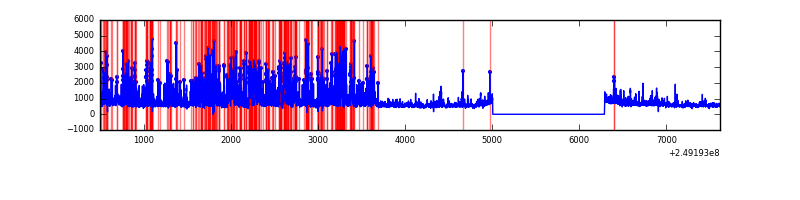 |
| B | 7122 | 5838 | 234 | 234 | 3.29% | 4.01% | 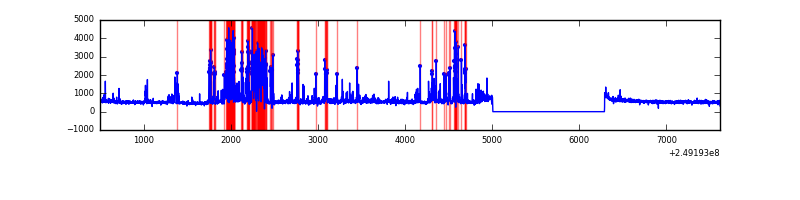 |
| C | 7122 | 5838 | 0 | 0 | 0.00% | 0.00% | 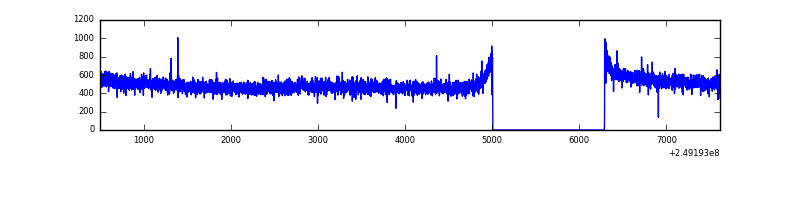 |
| D | 7122 | 5838 | 135 | 135 | 1.90% | 2.31% | 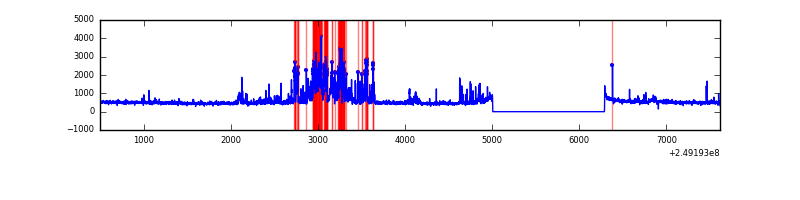 |
Top three noisy pixels from each quadrant. If the there are fewer than three noisy pixels in the level2.evt file, extra rows are filled as -1
| Pixel properties | Quadrant properties | ||||||
|---|---|---|---|---|---|---|---|
| Quadrant | DetID | PixID | Counts | Sigma | Mean | Median | Sigma |
| A | 8 | 5 | 2265316 | 15922.63 | 709 | 696 | 142.2 |
| A | 1 | 162 | 155013 | 1085.01 | 709 | 696 | 142.2 |
| A | 1 | 178 | 89534 | 624.62 | 709 | 696 | 142.2 |
| B | 3 | 64 | 821245 | 6125.32 | 718 | 701 | 134.0 |
| B | 4 | 239 | 288925 | 2151.58 | 718 | 701 | 134.0 |
| B | 15 | 204 | 66572 | 491.72 | 718 | 701 | 134.0 |
| C | 13 | 61 | 5507 | 28.39 | 738 | 743 | 167.8 |
| C | 14 | 234 | 2344 | 9.54 | 738 | 743 | 167.8 |
| C | 3 | 202 | 1898 | 6.88 | 738 | 743 | 167.8 |
| D | 13 | 104 | 603393 | 3577.32 | 719 | 702 | 168.5 |
| D | 13 | 137 | 151819 | 896.97 | 719 | 702 | 168.5 |
| D | 5 | 222 | 45826 | 267.84 | 719 | 702 | 168.5 |
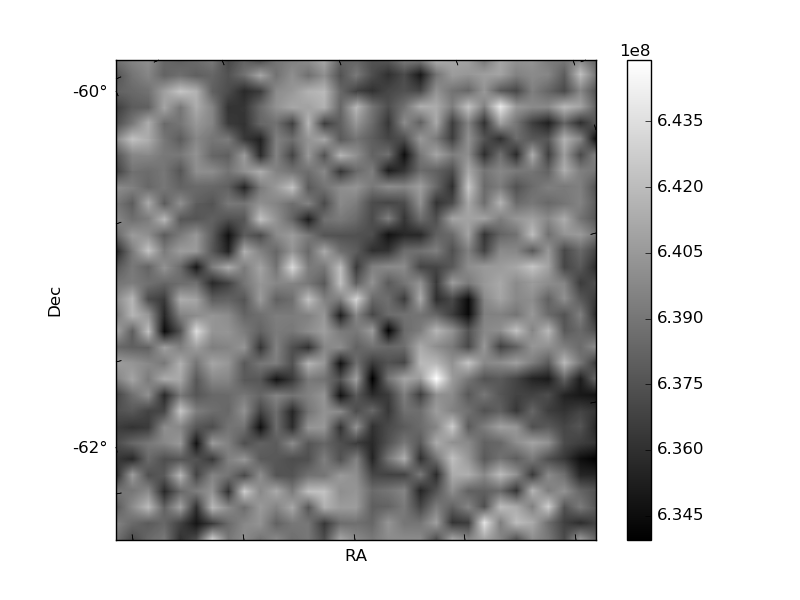
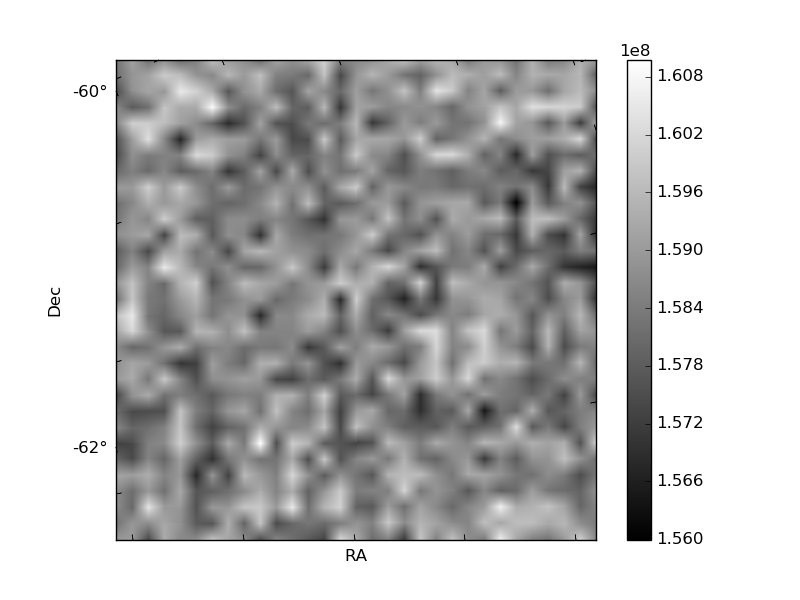
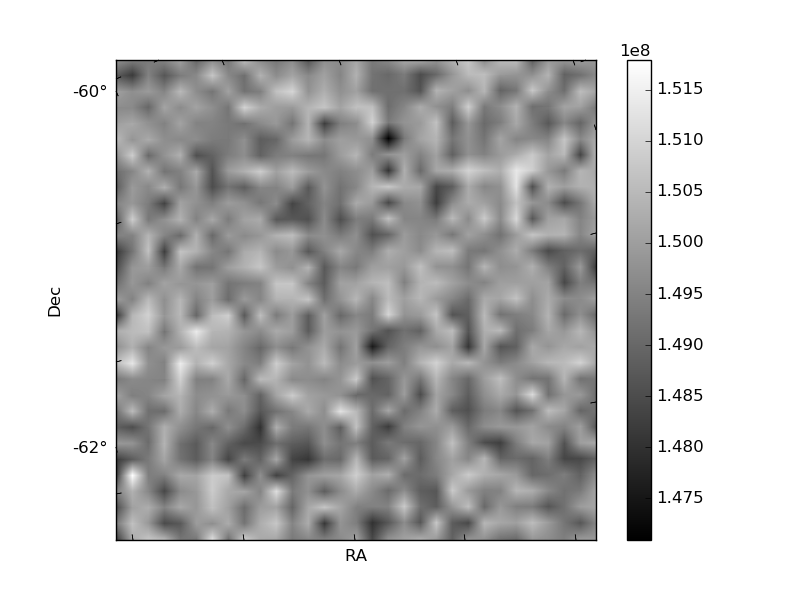
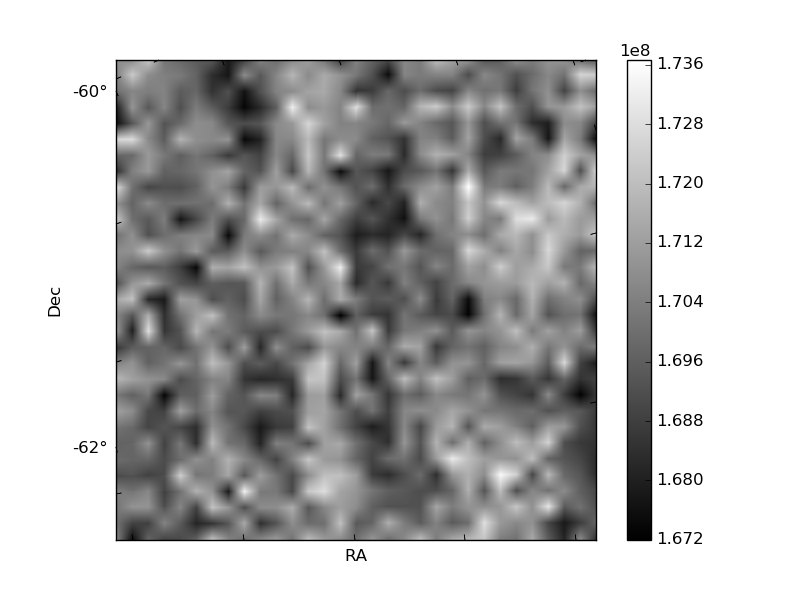
Histogram calculated using DETX and DETY for each event in the final _common_clean file
| Quadrant A | 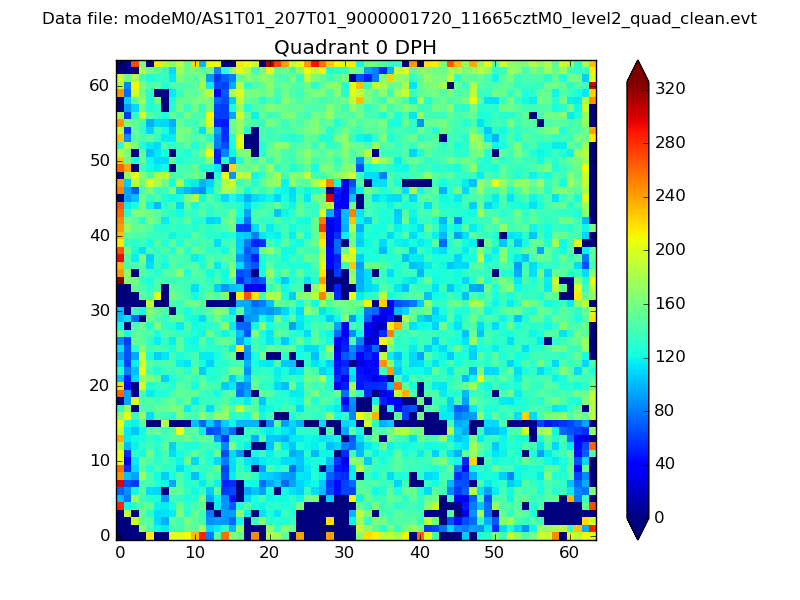 |
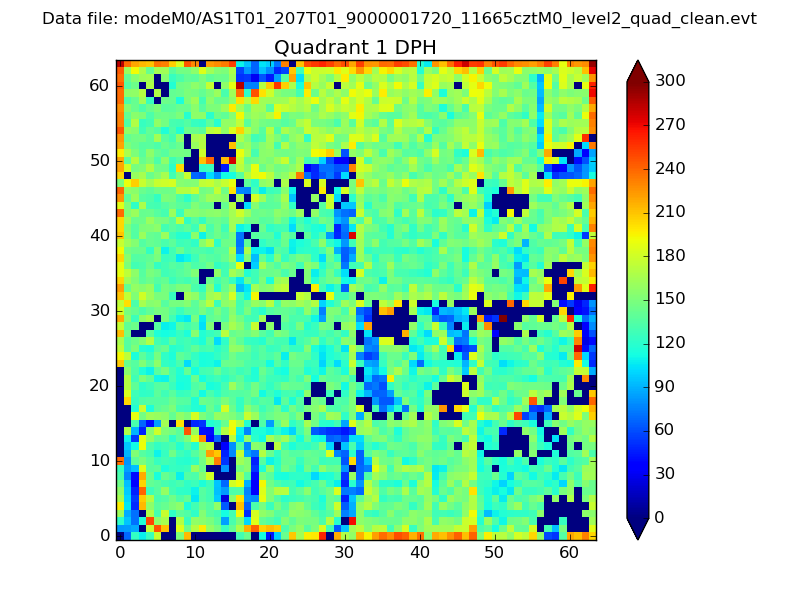 |
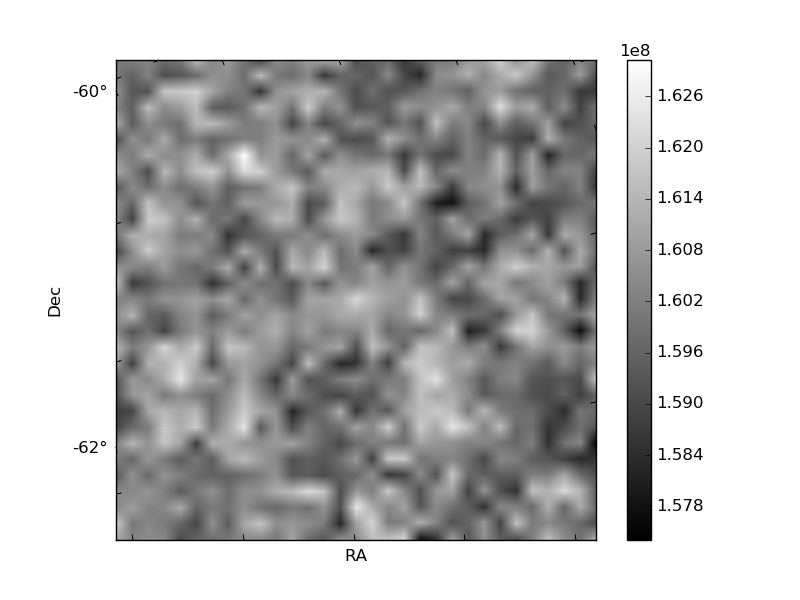
Quadrant B |
|---|---|---|---|
| Quadrant D | 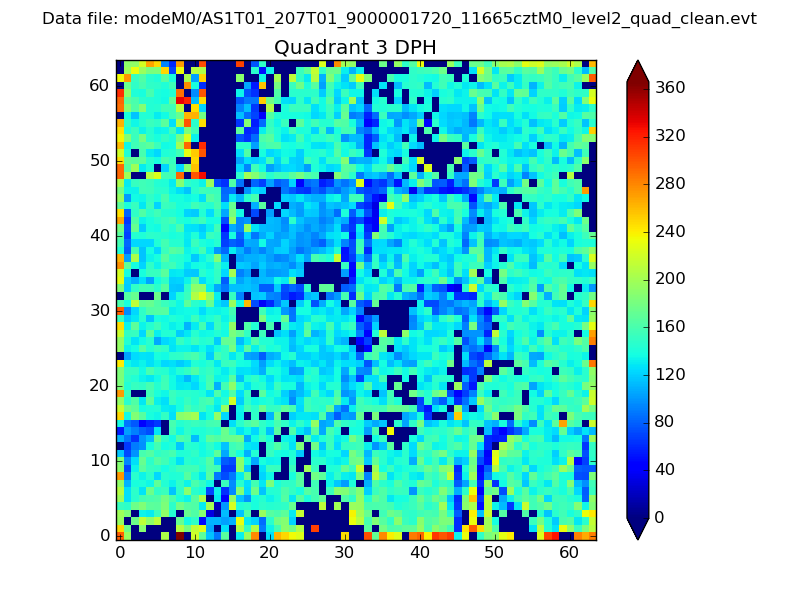 |
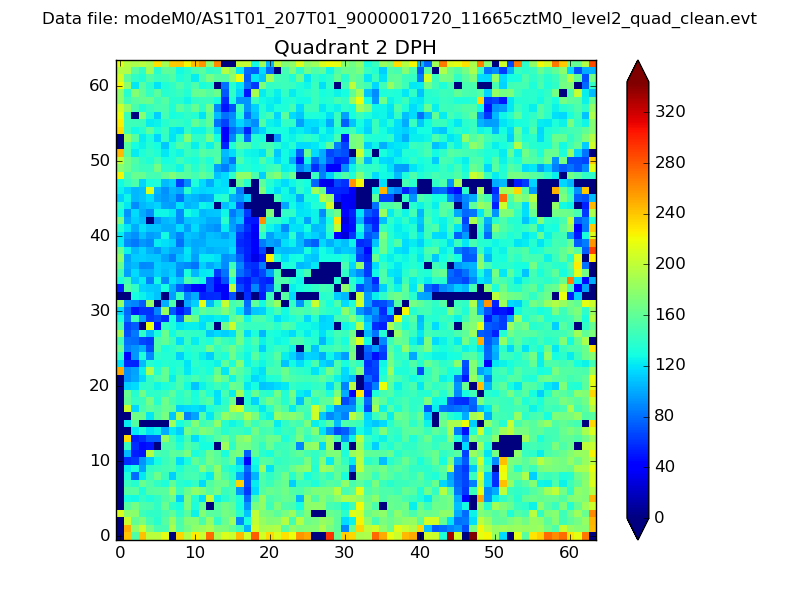 |
Quadrant C |
| Plot type | Count rate plots | Images |
|---|---|---|
| Comparison with Poisson distribution Blue bars denote a histogram of data divided into 1 sec bins. Red curve is a Poisson curve with rate = median count rate of data. |
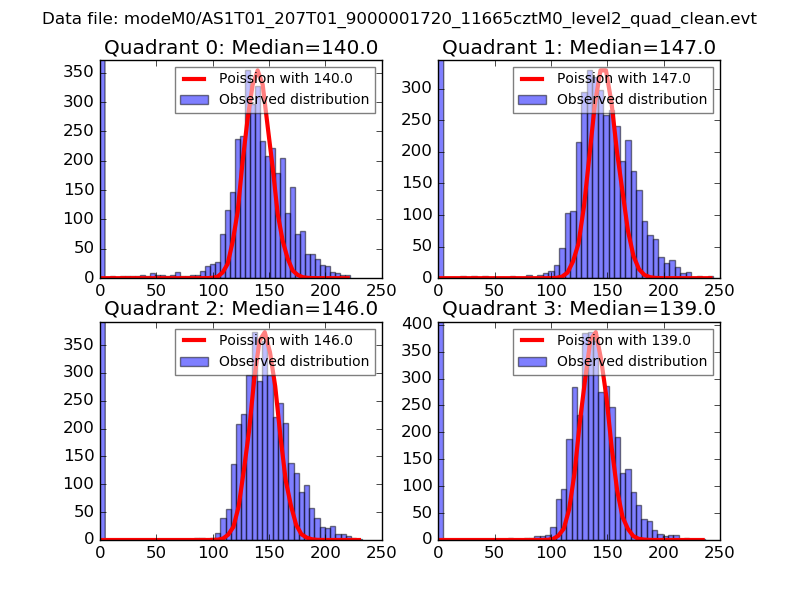 |
 |
| Quadrant-wise count rates Data is divided into 100 sec bins |
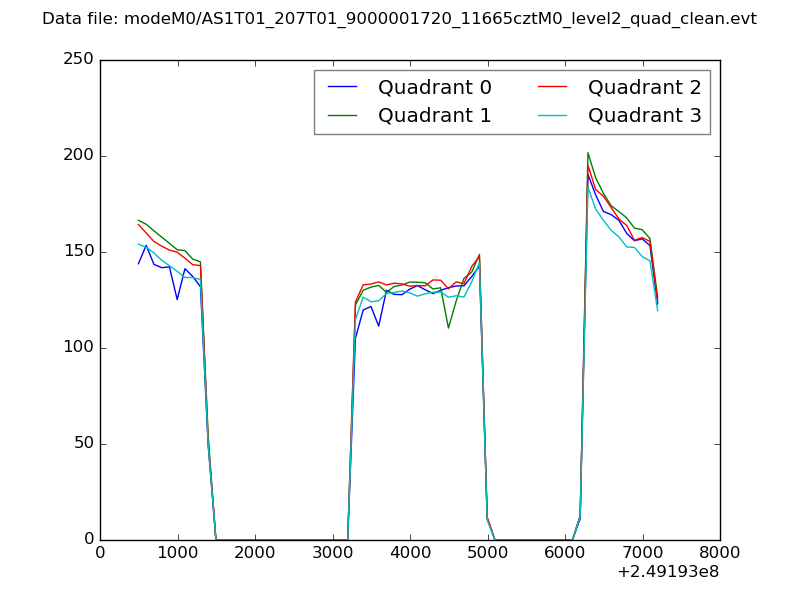 |
|
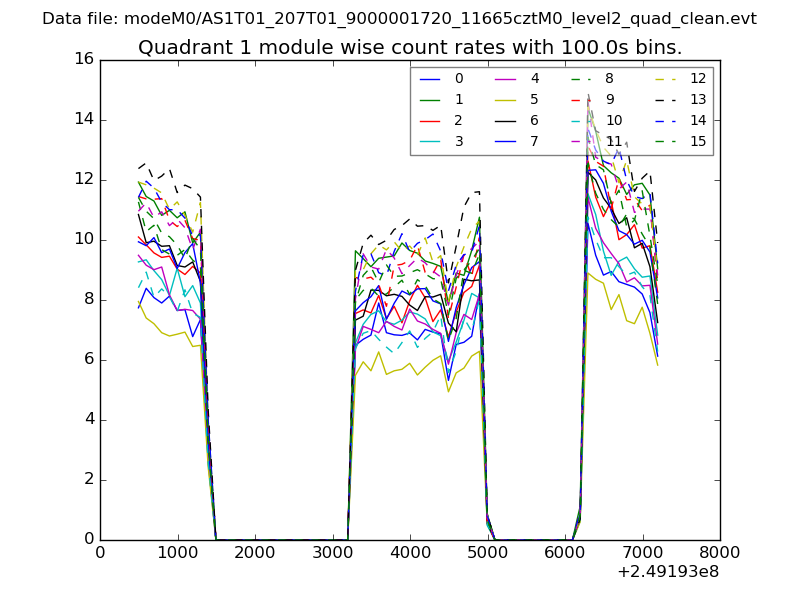
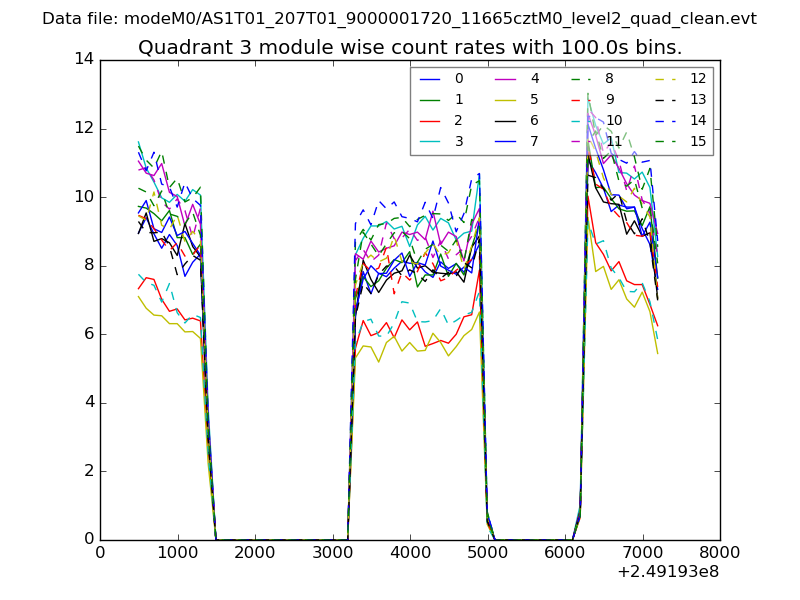
| Module-wise count rates for Quadrant A Data is divided into 100 sec bins |
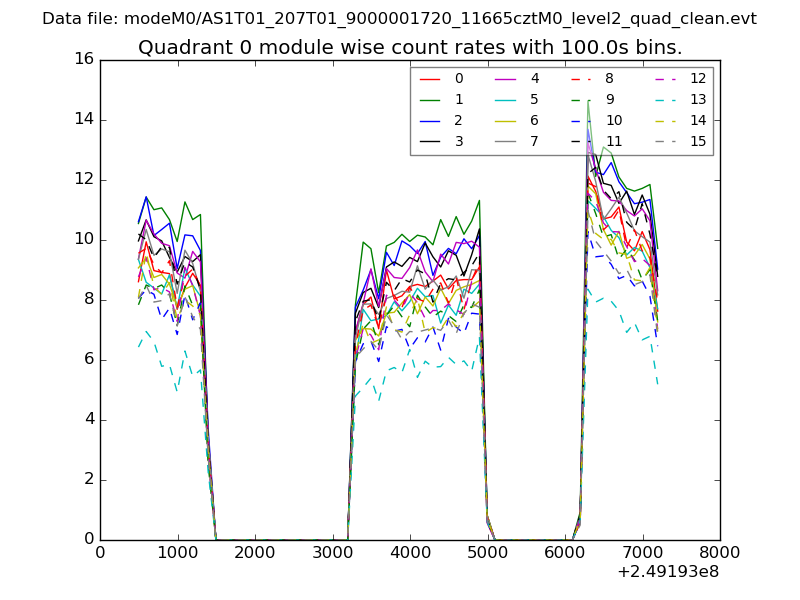 |
 |
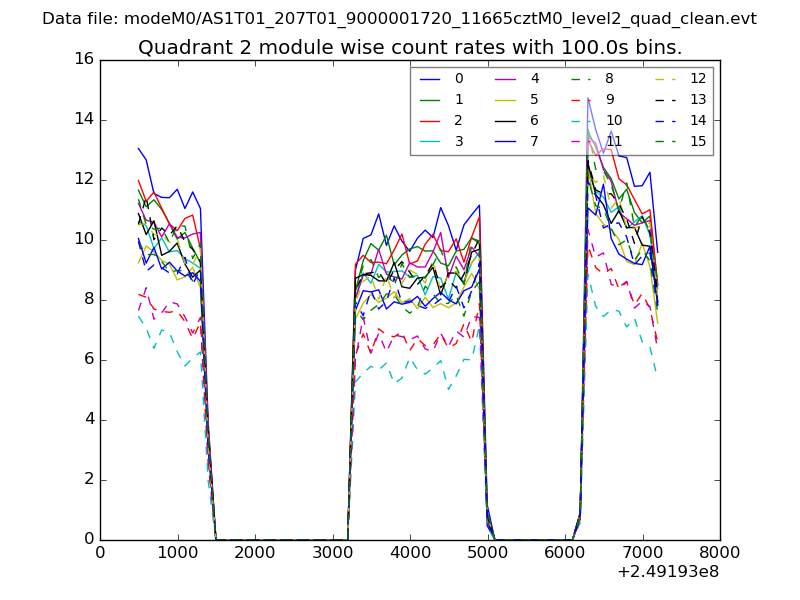
| Module-wise count rates for Quadrant B Data is divided into 100 sec bins |
 |
 |
| Module-wise count rates for Quadrant C Data is divided into 100 sec bins |
 |
 |
| Module-wise count rates for Quadrant D Data is divided into 100 sec bins |
 |
 |
| Parameter | Plot |
|---|---|
| CZT HV Monitor | 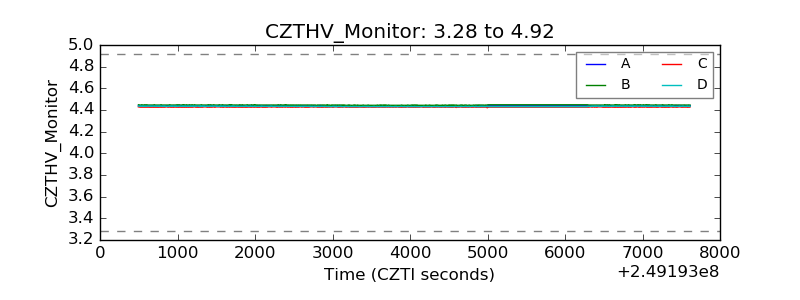 |
| D_VDD | 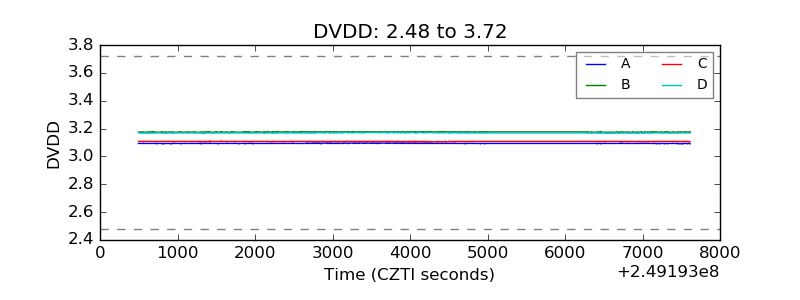 |
| Temperature 1 | 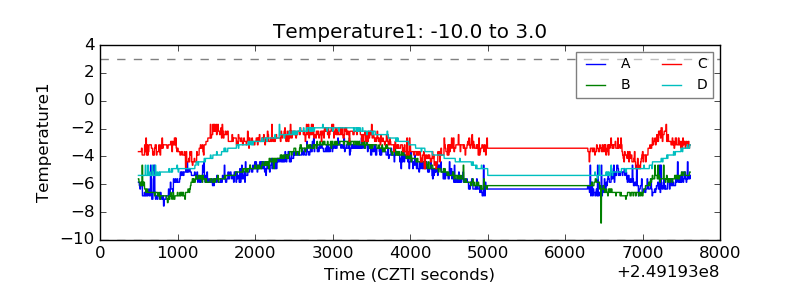 |
| Veto HV Monitor |  |
| Veto LLD | 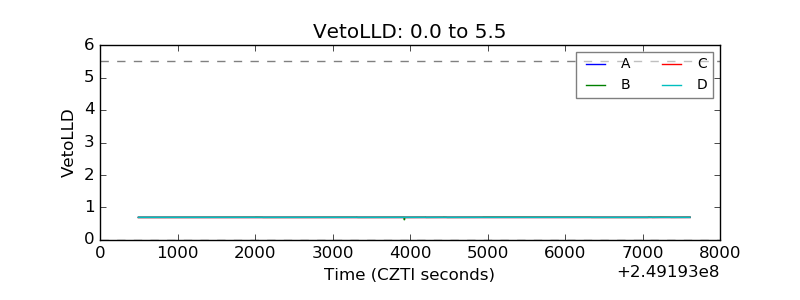 |
| Alpha Counter | 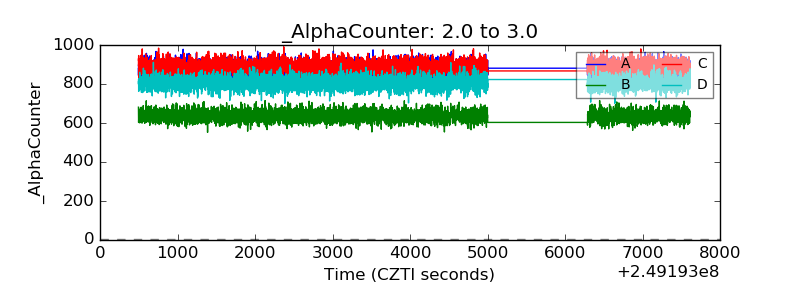 |
| _CPM_Rate | 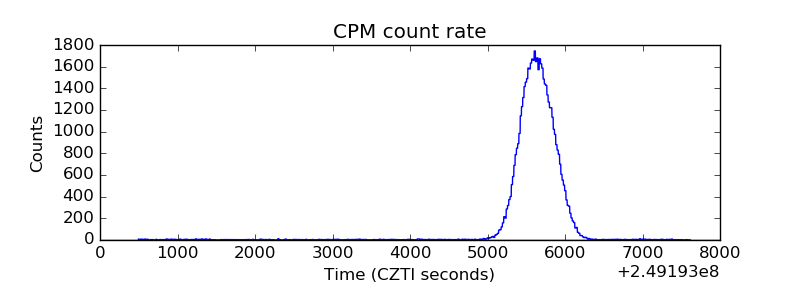 |
| CZT Counter | 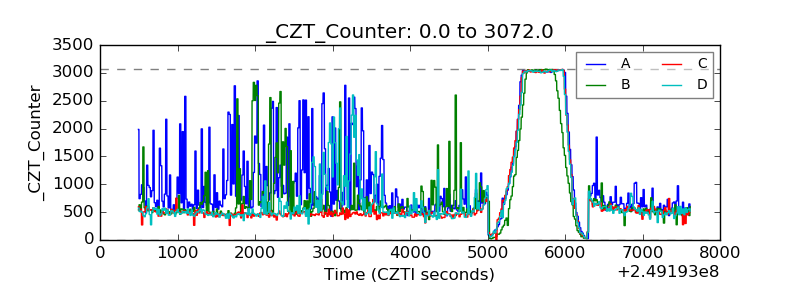 |
| +2.5 Volts monitor |  |
| +5 Volts monitor |  |
| _ROLL_ROT | 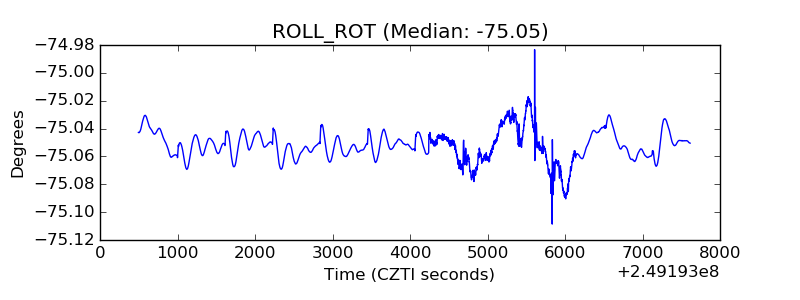 |
| _Roll_DEC | 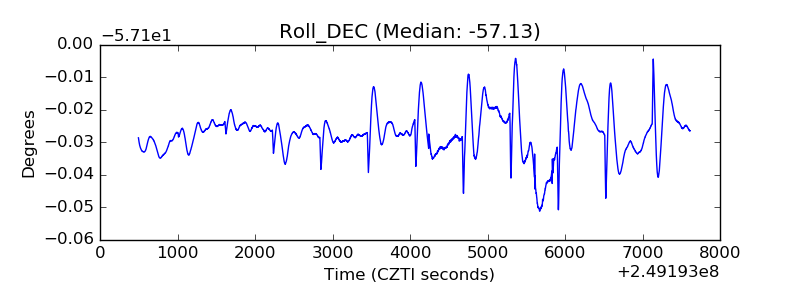 |
| _Roll_RA | 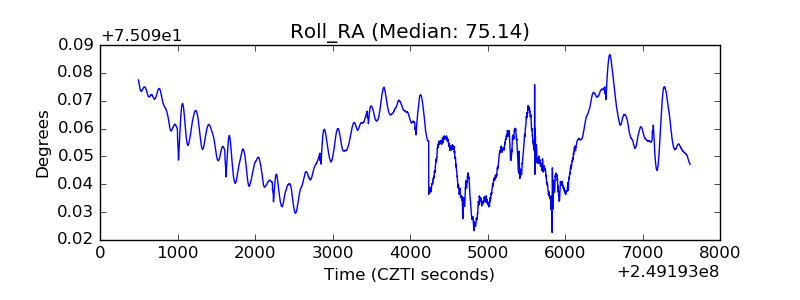 |
| Veto Counter | 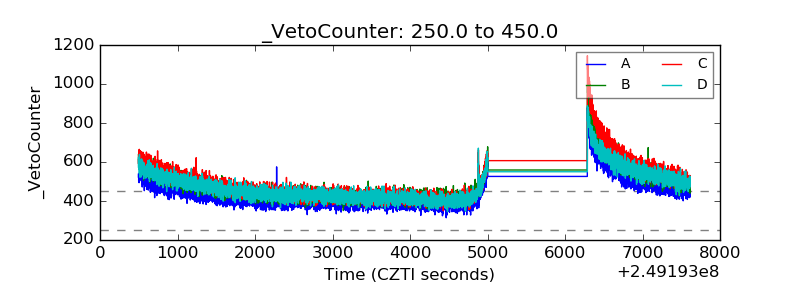 |