| Param | Original file | Final file |
|---|---|---|
| Filename | modeM0/AS1T01_207T01_9000001720_11666cztM0_level2.evt | modeM0/AS1T01_207T01_9000001720_11666cztM0_level2_quad_clean.evt |
| Size (bytes) | 517,705,920 | 85,072,320 |
| Size | 493.7 MB | 81.1 MB |
| Events in quadrant A | 4,359,974 | 531,599 |
| Events in quadrant B | 3,694,913 | 549,667 |
| Events in quadrant C | 3,129,986 | 544,320 |
| Events in quadrant D | 4,071,285 | 515,463 |
| Mode M0 | |||
|---|---|---|---|
| Quadrant | BADHDUFLAG | Total packets | Discarded packets |
| A | 0 | 17141 | 3 |
| B | 0 | 14670 | 1 |
| C | 0 | 13076 | 1 |
| D | 0 | 16028 | 1 |
| Mode M9 | |||
|---|---|---|---|
| Quadrant | BADHDUFLAG | Total packets | Discarded packets |
| A | 0 | 13 | 0 |
| B | 0 | 13 | 0 |
| C | 0 | 13 | 0 |
| D | 0 | 13 | 0 |
| Mode SS | |||
|---|---|---|---|
| Quadrant | BADHDUFLAG | Total packets | Discarded packets |
| A | 0 | 126 | 0 |
| B | 0 | 126 | 0 |
| C | 0 | 126 | 0 |
| D | 0 | 126 | 0 |
| Quadrant | Total seconds | Saturated seconds | Saturation percentage |
|---|---|---|---|
| A | 6236 | 244 | 3.912765% |
| B | 6236 | 157 | 2.517640% |
| C | 6236 | 61 | 0.978191% |
| D | 6236 | 179 | 2.870430% |
Noise dominated data is calculated using 1-second bins in cleaned event files. If a bin has >2000 counts, and if more than 50% of those come from <1% of pixels, then it is considered to be noise-dominated and hence unusable.
| Quadrant | # 1 sec bins | Bins with >0 counts | Bins with >2000 counts | High rate bins dominated by noise | Noise dominated (total time) | Noise dominated (detector-on time) | Marked lightcurve |
|---|---|---|---|---|---|---|---|
| A | 7498 | 6239 | 92 | 92 | 1.23% | 1.47% | 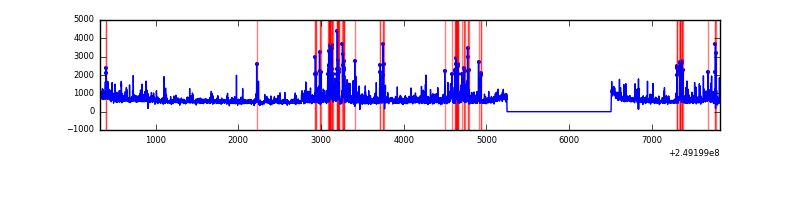 |
| B | 7498 | 6239 | 36 | 36 | 0.48% | 0.58% | 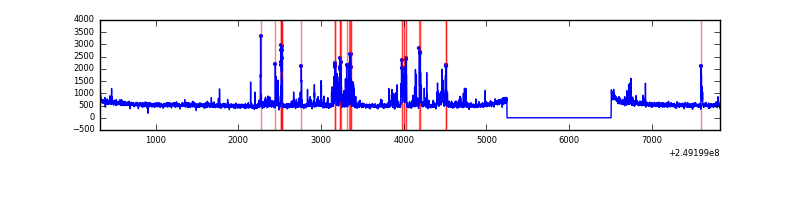 |
| C | 7498 | 6239 | 0 | 0 | 0.00% | 0.00% | 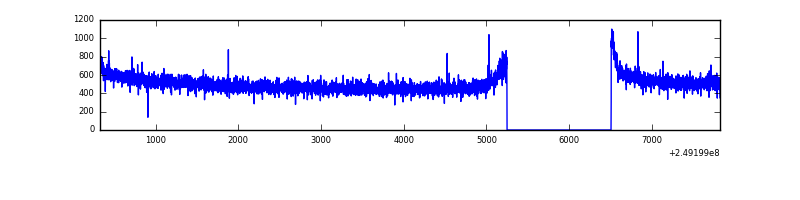 |
| D | 7498 | 6239 | 102 | 102 | 1.36% | 1.63% | 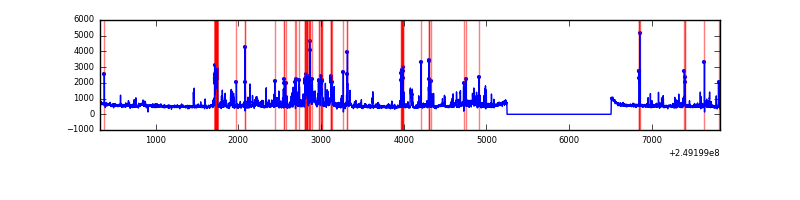 |
Top three noisy pixels from each quadrant. If the there are fewer than three noisy pixels in the level2.evt file, extra rows are filled as -1
| Pixel properties | Quadrant properties | ||||||
|---|---|---|---|---|---|---|---|
| Quadrant | DetID | PixID | Counts | Sigma | Mean | Median | Sigma |
| A | 8 | 5 | 843451 | 5271.1 | 800 | 784 | 159.9 |
| A | 1 | 162 | 156940 | 976.8 | 800 | 784 | 159.9 |
| A | 1 | 178 | 90380 | 560.45 | 800 | 784 | 159.9 |
| B | 4 | 239 | 405614 | 2737.74 | 807 | 787 | 147.9 |
| B | 15 | 204 | 54614 | 364.02 | 807 | 787 | 147.9 |
| B | 3 | 64 | 51712 | 344.39 | 807 | 787 | 147.9 |
| C | 13 | 61 | 5761 | 27.19 | 803 | 810 | 182.1 |
| C | 3 | 202 | 1969 | 6.36 | 803 | 810 | 182.1 |
| C | 3 | 203 | 1754 | 5.18 | 803 | 810 | 182.1 |
| D | 13 | 104 | 482478 | 2564.4 | 790 | 770 | 187.8 |
| D | 1 | 52 | 431266 | 2291.77 | 790 | 770 | 187.8 |
| D | 13 | 249 | 48784 | 255.6 | 790 | 770 | 187.8 |
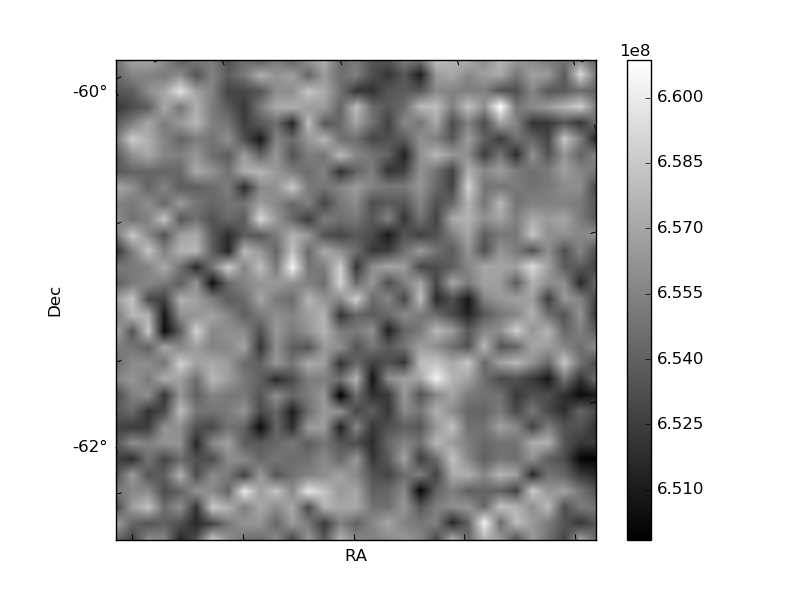
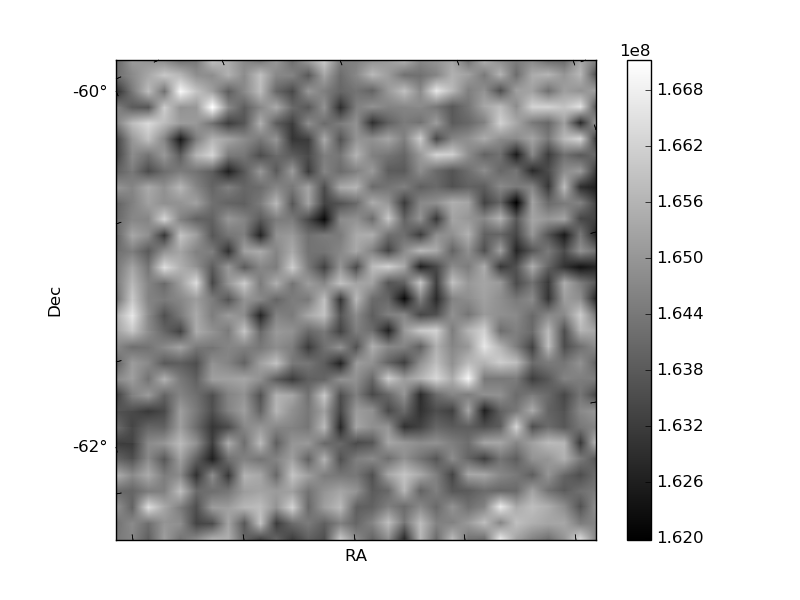
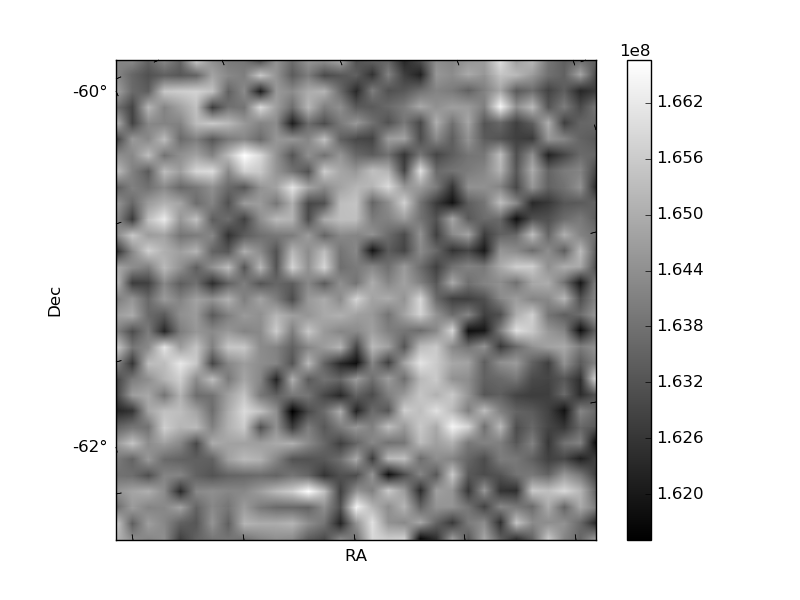
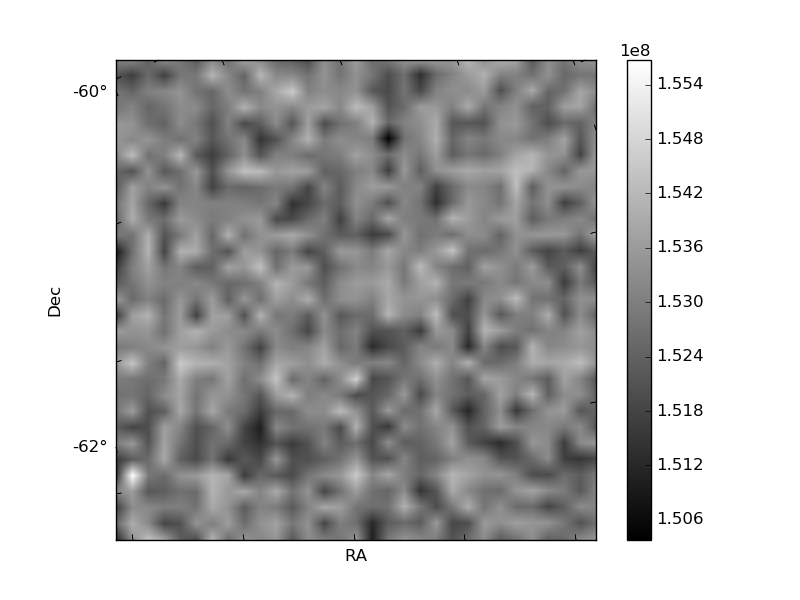
Histogram calculated using DETX and DETY for each event in the final _common_clean file
| Quadrant A | 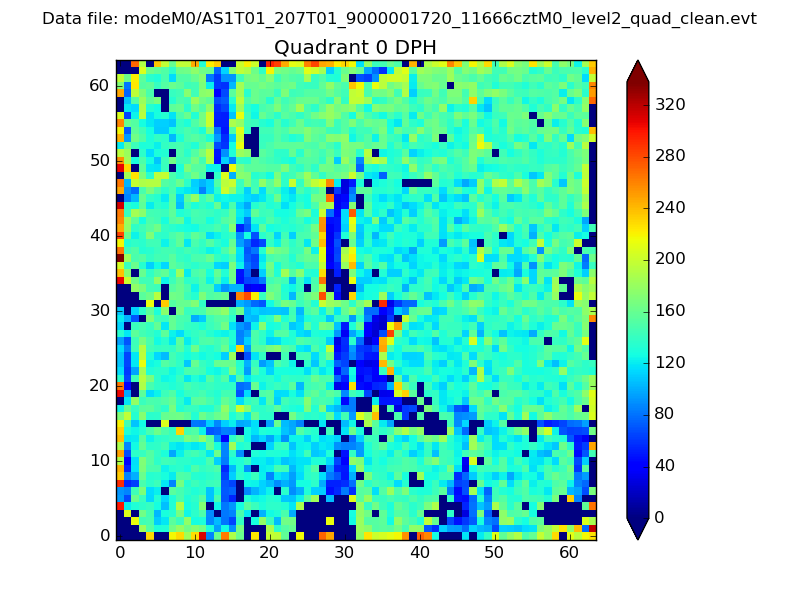 |
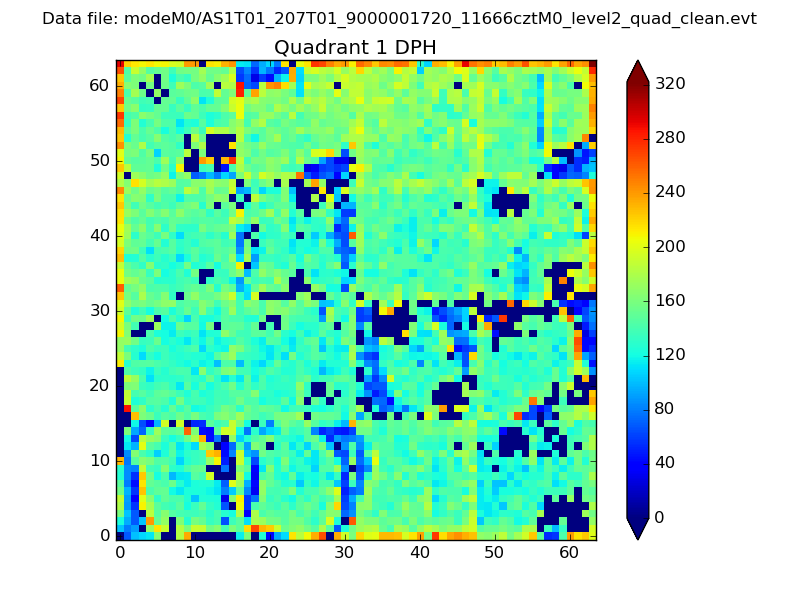 |
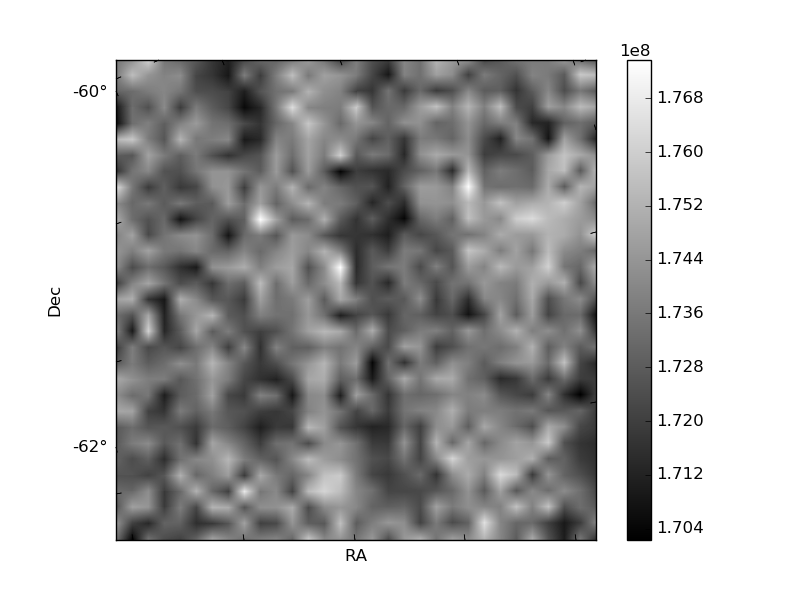
Quadrant B |
|---|---|---|---|
| Quadrant D | 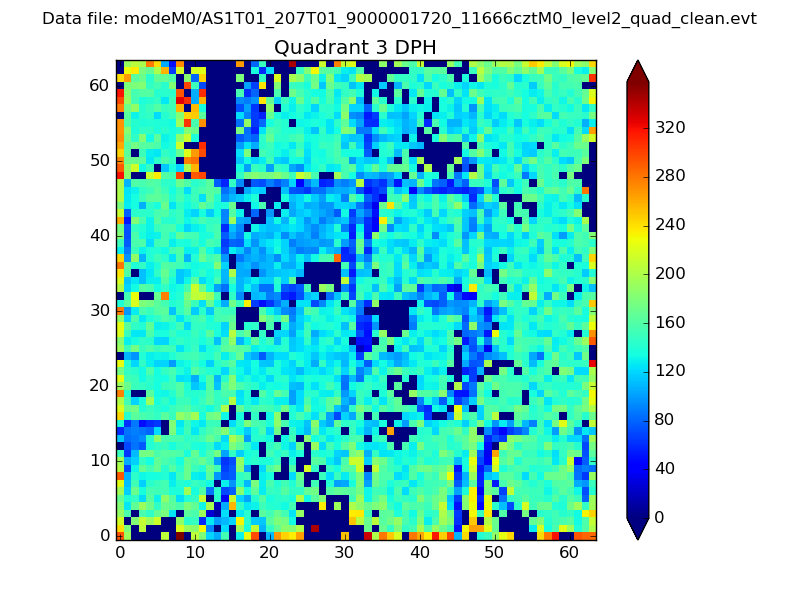 |
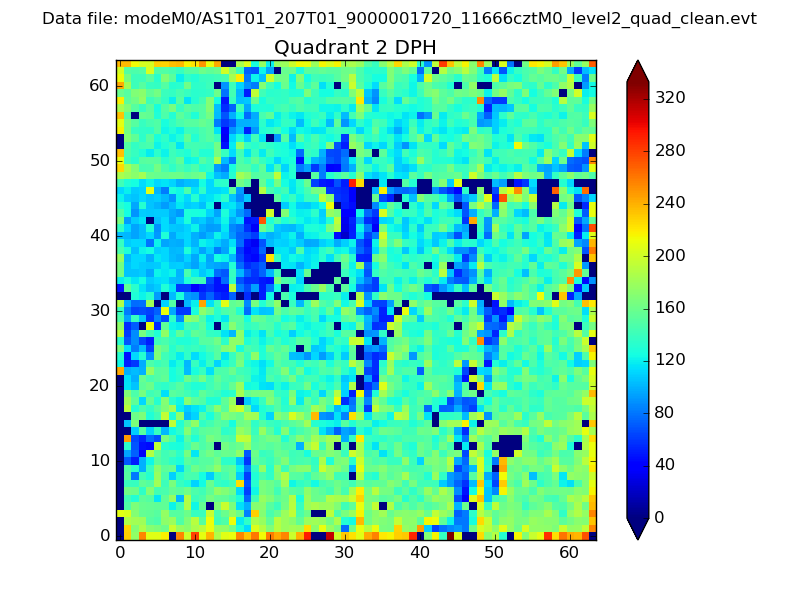 |
Quadrant C |
| Plot type | Count rate plots | Images |
|---|---|---|
| Comparison with Poisson distribution Blue bars denote a histogram of data divided into 1 sec bins. Red curve is a Poisson curve with rate = median count rate of data. |
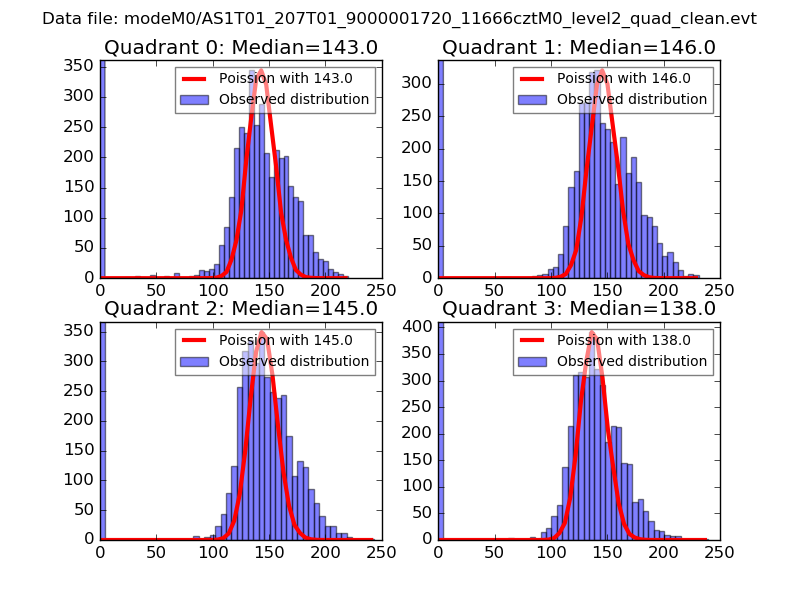 |
 |
| Quadrant-wise count rates Data is divided into 100 sec bins |
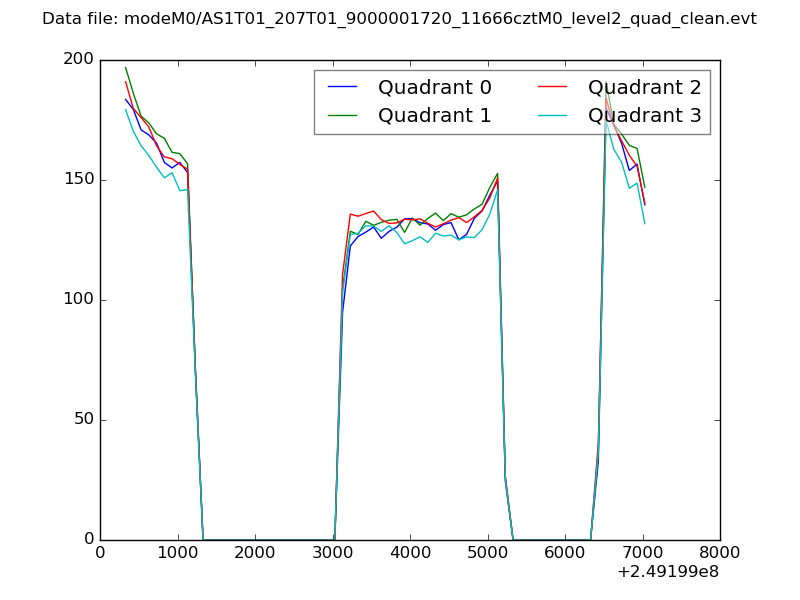 |
|
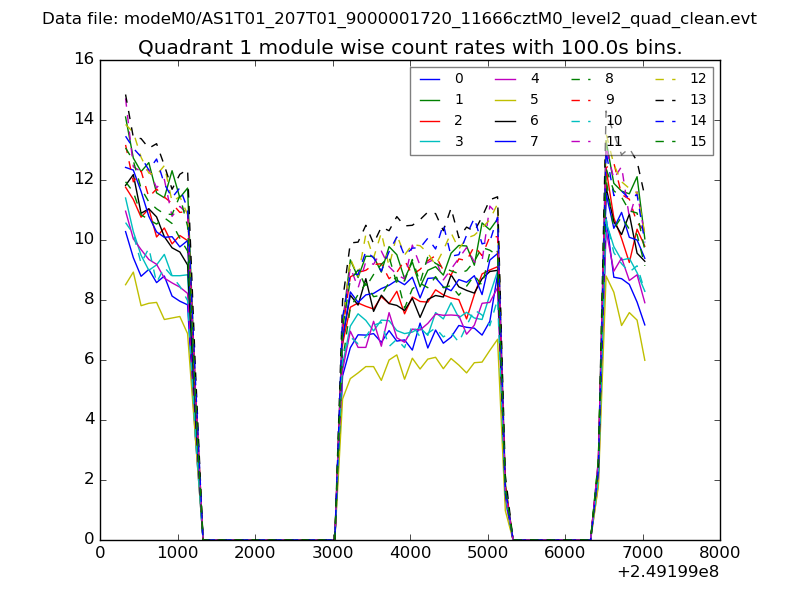
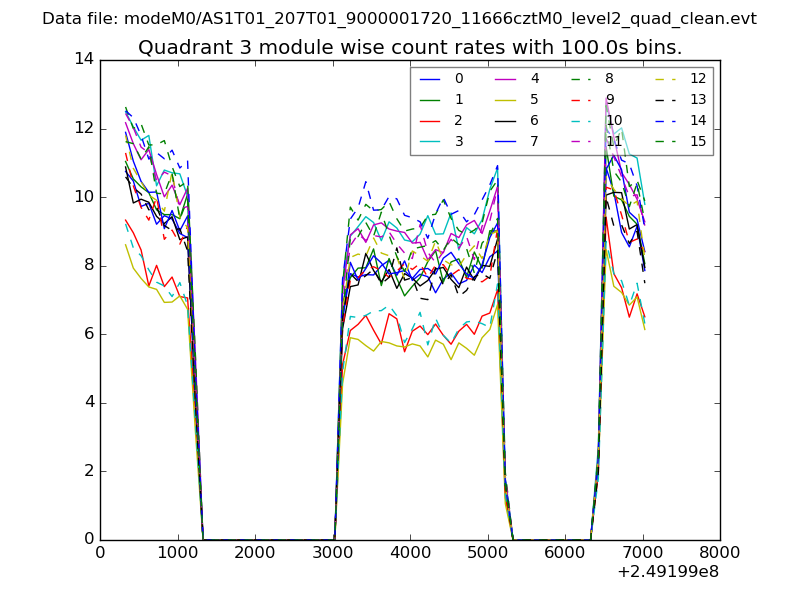
| Module-wise count rates for Quadrant A Data is divided into 100 sec bins |
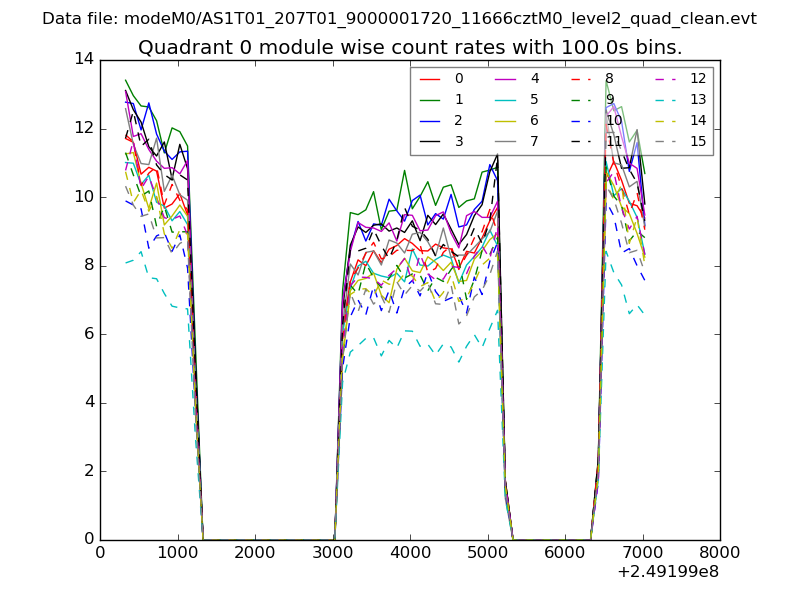 |
 |
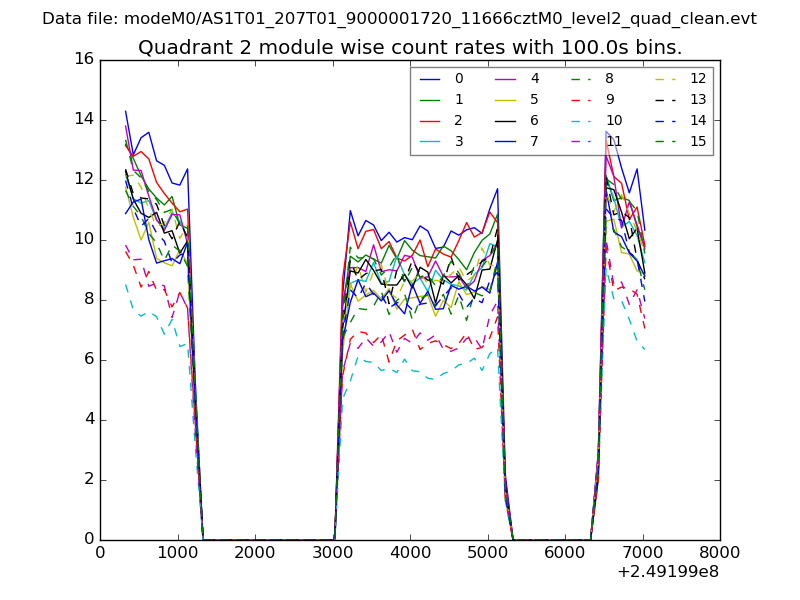
| Module-wise count rates for Quadrant B Data is divided into 100 sec bins |
 |
 |
| Module-wise count rates for Quadrant C Data is divided into 100 sec bins |
 |
 |
| Module-wise count rates for Quadrant D Data is divided into 100 sec bins |
 |
 |
| Parameter | Plot |
|---|---|
| CZT HV Monitor | 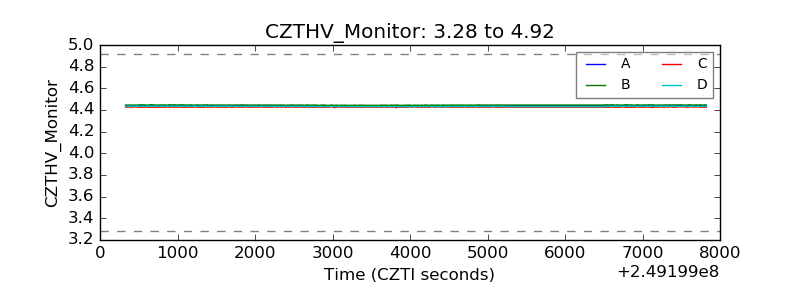 |
| D_VDD |  |
| Temperature 1 | 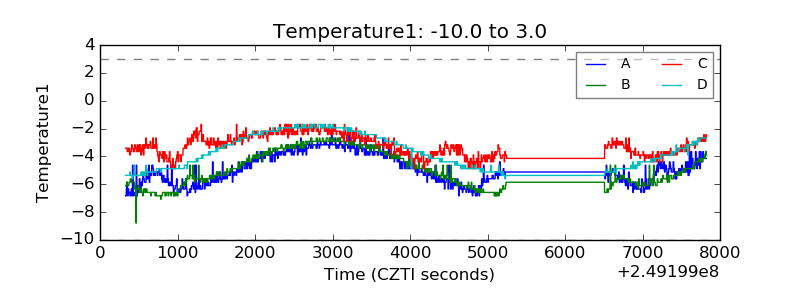 |
| Veto HV Monitor | 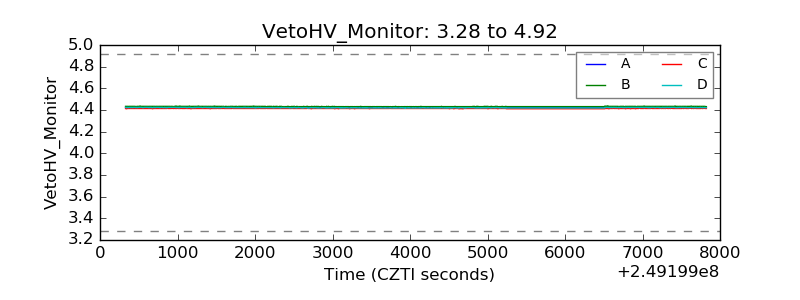 |
| Veto LLD | 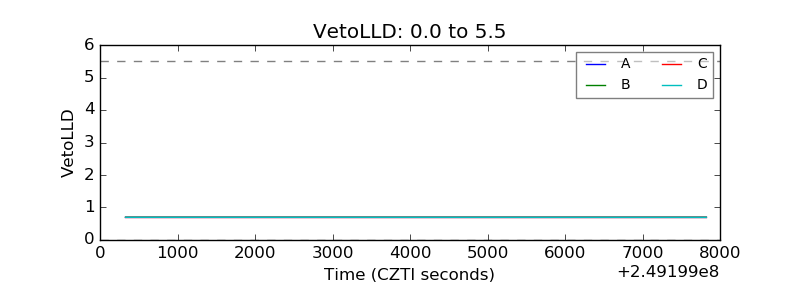 |
| Alpha Counter | 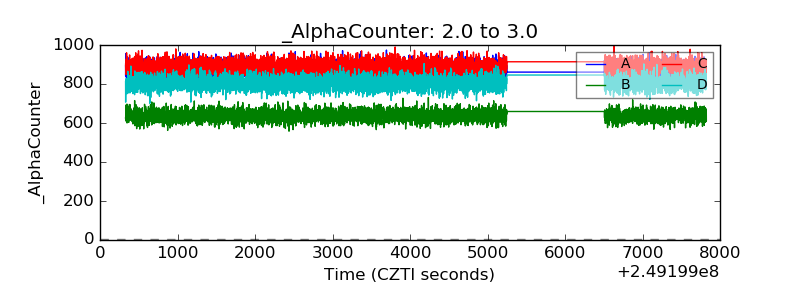 |
| _CPM_Rate | 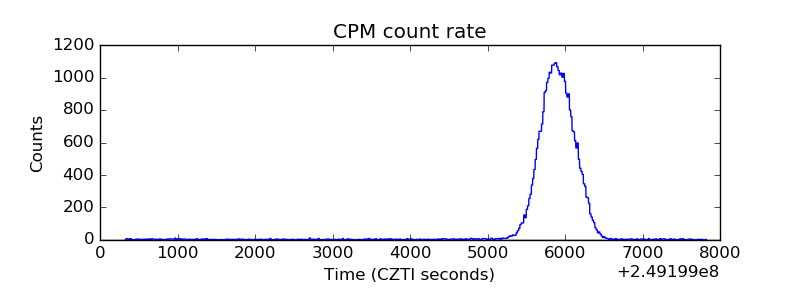 |
| CZT Counter | 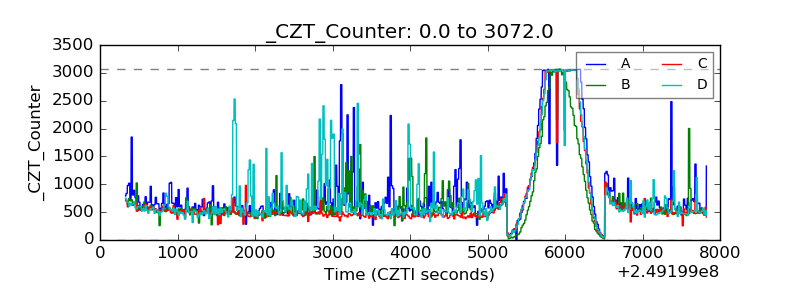 |
| +2.5 Volts monitor |  |
| +5 Volts monitor |  |
| _ROLL_ROT | 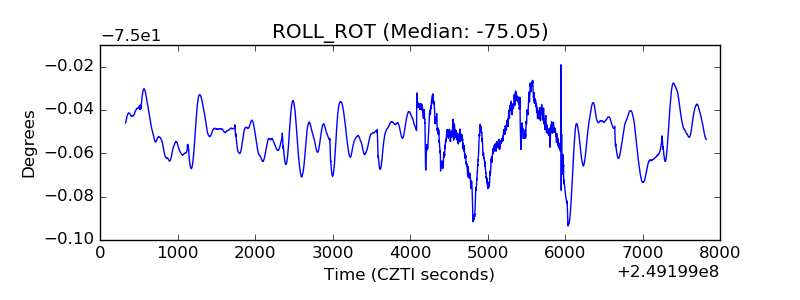 |
| _Roll_DEC | 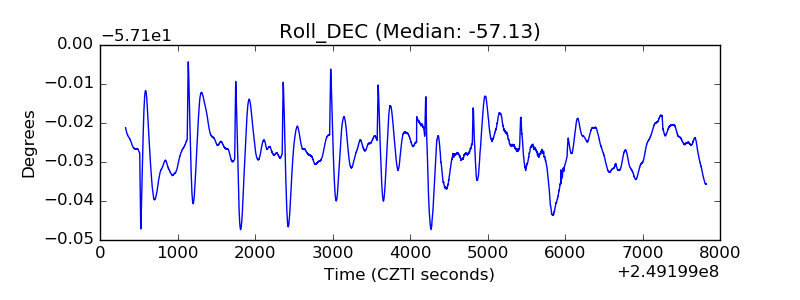 |
| _Roll_RA | 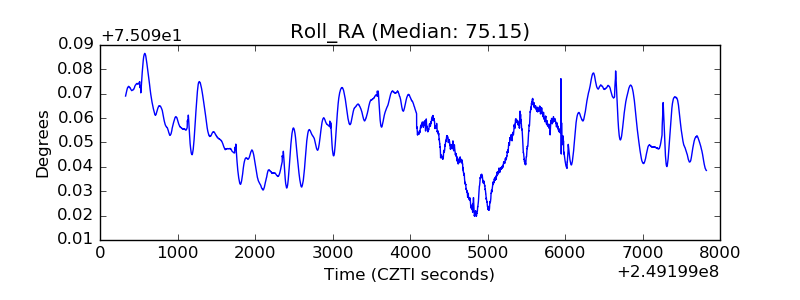 |
| Veto Counter | 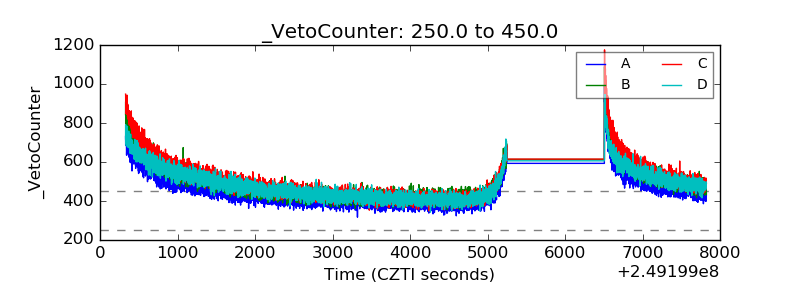 |