| Param | Original file | Final file |
|---|---|---|
| Filename | modeM0/AS1T01_207T01_9000001720_11668cztM0_level2.evt | modeM0/AS1T01_207T01_9000001720_11668cztM0_level2_quad_clean.evt |
| Size (bytes) | 517,196,160 | 72,921,600 |
| Size | 493.2 MB | 69.5 MB |
| Events in quadrant A | 4,154,862 | 439,968 |
| Events in quadrant B | 4,055,349 | 439,313 |
| Events in quadrant C | 3,128,434 | 442,255 |
| Events in quadrant D | 3,876,098 | 425,200 |
| Mode M0 | |||
|---|---|---|---|
| Quadrant | BADHDUFLAG | Total packets | Discarded packets |
| A | 0 | 16598 | 3 |
| B | 0 | 16074 | 2 |
| C | 0 | 13676 | 2 |
| D | 0 | 15990 | 2 |
| Mode M9 | |||
|---|---|---|---|
| Quadrant | BADHDUFLAG | Total packets | Discarded packets |
| A | 0 | 10 | 0 |
| B | 0 | 10 | 0 |
| C | 0 | 10 | 0 |
| D | 0 | 11 | 0 |
| Mode SS | |||
|---|---|---|---|
| Quadrant | BADHDUFLAG | Total packets | Discarded packets |
| A | 0 | 134 | 0 |
| B | 0 | 134 | 0 |
| C | 0 | 134 | 0 |
| D | 0 | 134 | 0 |
| Quadrant | Total seconds | Saturated seconds | Saturation percentage |
|---|---|---|---|
| A | 6613 | 242 | 3.659459% |
| B | 6613 | 273 | 4.128232% |
| C | 6613 | 107 | 1.618025% |
| D | 6613 | 199 | 3.009224% |
Noise dominated data is calculated using 1-second bins in cleaned event files. If a bin has >2000 counts, and if more than 50% of those come from <1% of pixels, then it is considered to be noise-dominated and hence unusable.
| Quadrant | # 1 sec bins | Bins with >0 counts | Bins with >2000 counts | High rate bins dominated by noise | Noise dominated (total time) | Noise dominated (detector-on time) | Marked lightcurve |
|---|---|---|---|---|---|---|---|
| A | 7534 | 6615 | 40 | 40 | 0.53% | 0.60% | 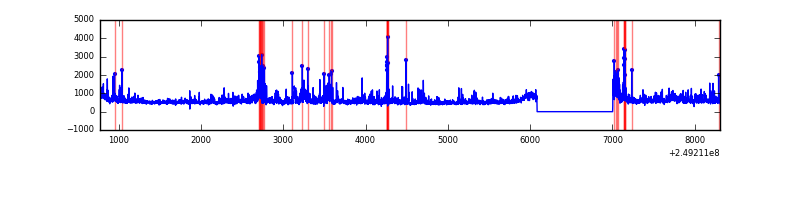 |
| B | 7534 | 6615 | 86 | 86 | 1.14% | 1.30% | 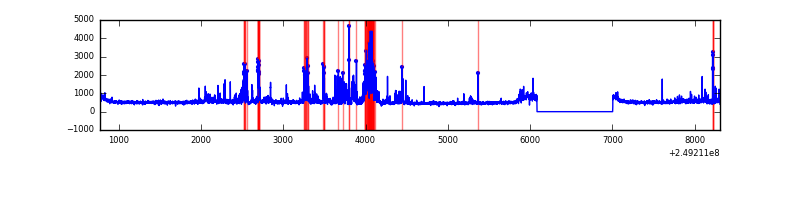 |
| C | 7534 | 6615 | 0 | 0 | 0.00% | 0.00% | 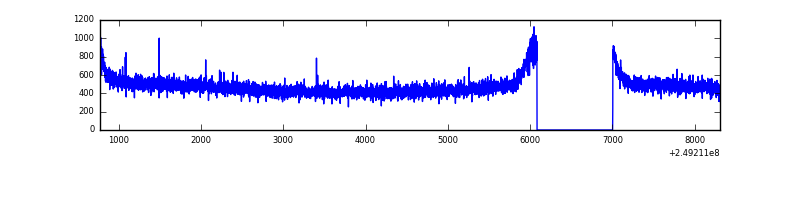 |
| D | 7534 | 6615 | 74 | 74 | 0.98% | 1.12% | 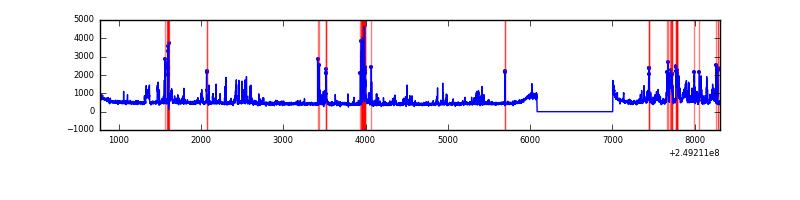 |
Top three noisy pixels from each quadrant. If the there are fewer than three noisy pixels in the level2.evt file, extra rows are filled as -1
| Pixel properties | Quadrant properties | ||||||
|---|---|---|---|---|---|---|---|
| Quadrant | DetID | PixID | Counts | Sigma | Mean | Median | Sigma |
| A | 8 | 5 | 600246 | 3654.81 | 811 | 793 | 164.0 |
| A | 1 | 162 | 165728 | 1005.59 | 811 | 793 | 164.0 |
| A | 1 | 178 | 91682 | 554.14 | 811 | 793 | 164.0 |
| B | 4 | 239 | 625327 | 4045.4 | 810 | 787 | 154.4 |
| B | 0 | 214 | 81127 | 520.39 | 810 | 787 | 154.4 |
| B | 15 | 204 | 78870 | 505.77 | 810 | 787 | 154.4 |
| C | 13 | 61 | 5879 | 27.69 | 801 | 804 | 183.3 |
| C | 12 | 4 | 2228 | 7.77 | 801 | 804 | 183.3 |
| C | 14 | 234 | 2023 | 6.65 | 801 | 804 | 183.3 |
| D | 13 | 104 | 411294 | 2191.67 | 793 | 772 | 187.3 |
| D | 1 | 52 | 133455 | 708.36 | 793 | 772 | 187.3 |
| D | 10 | 253 | 120731 | 640.43 | 793 | 772 | 187.3 |
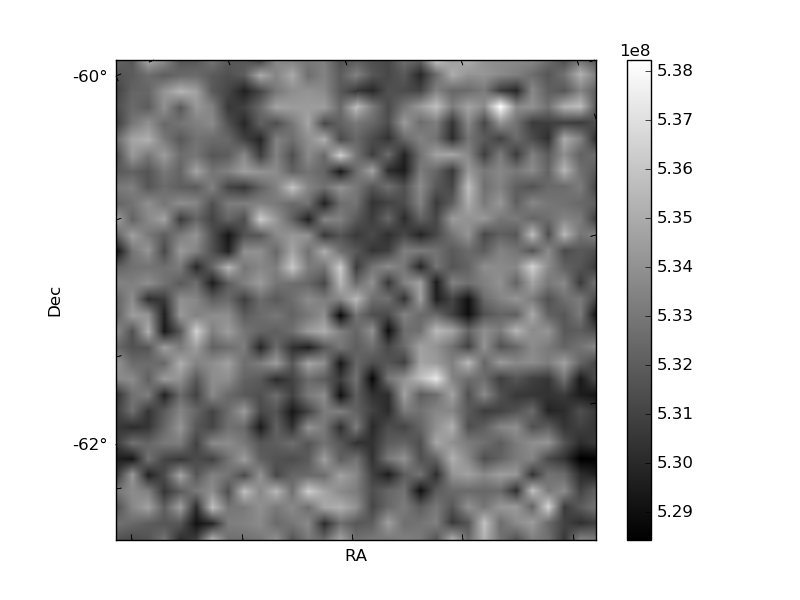
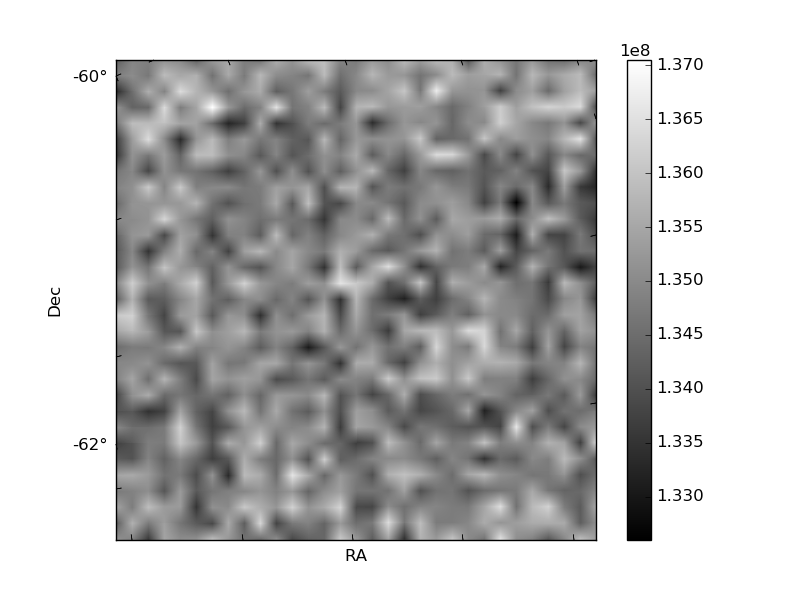
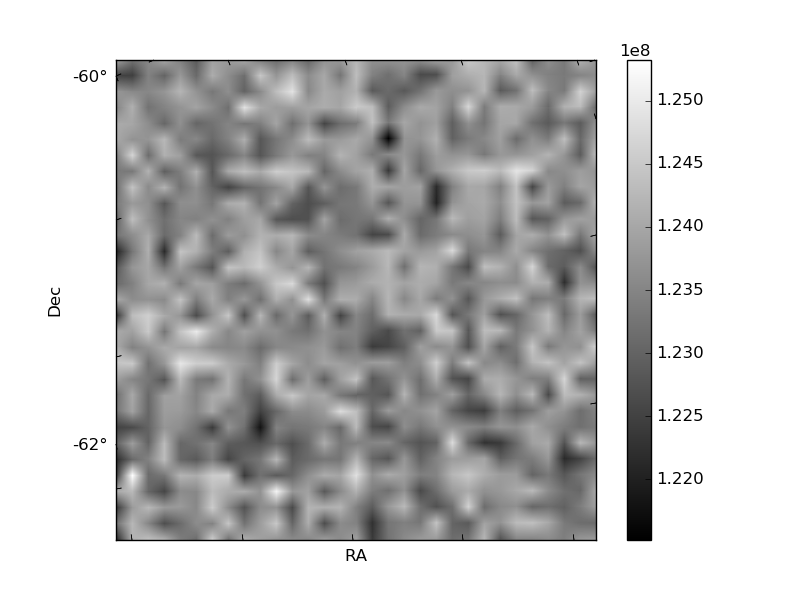
Histogram calculated using DETX and DETY for each event in the final _common_clean file
| Quadrant A | 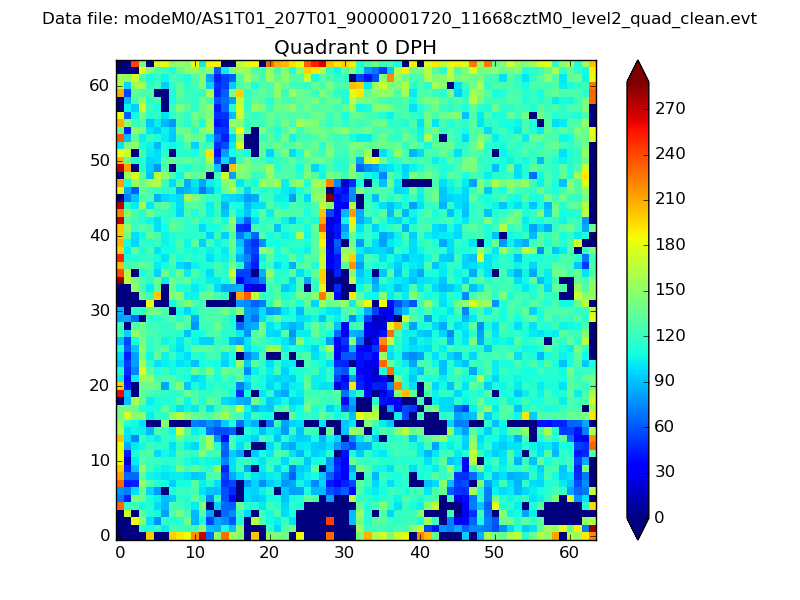 |
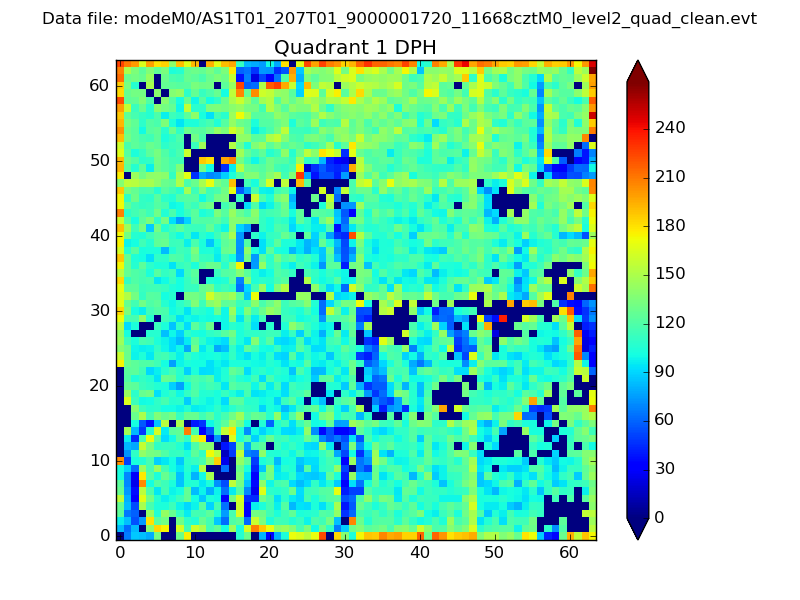 |
Quadrant B |
|---|---|---|---|
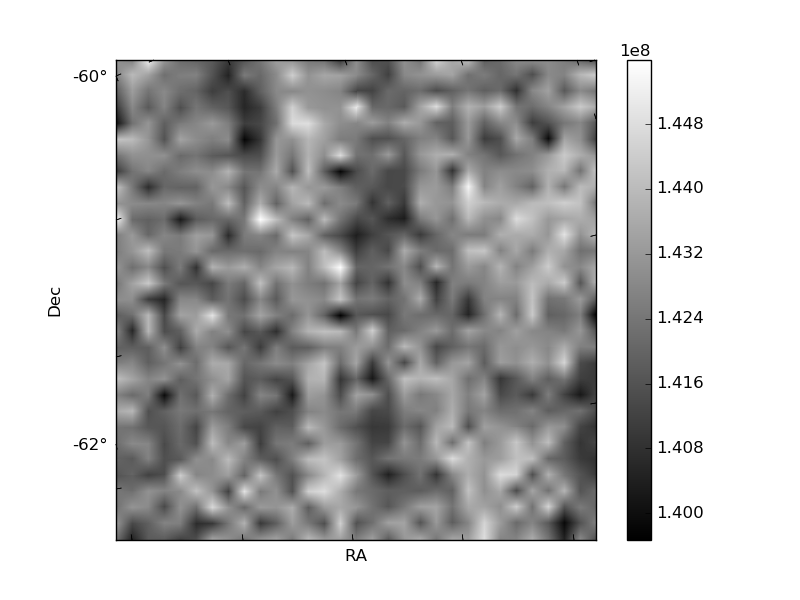
| Quadrant D | 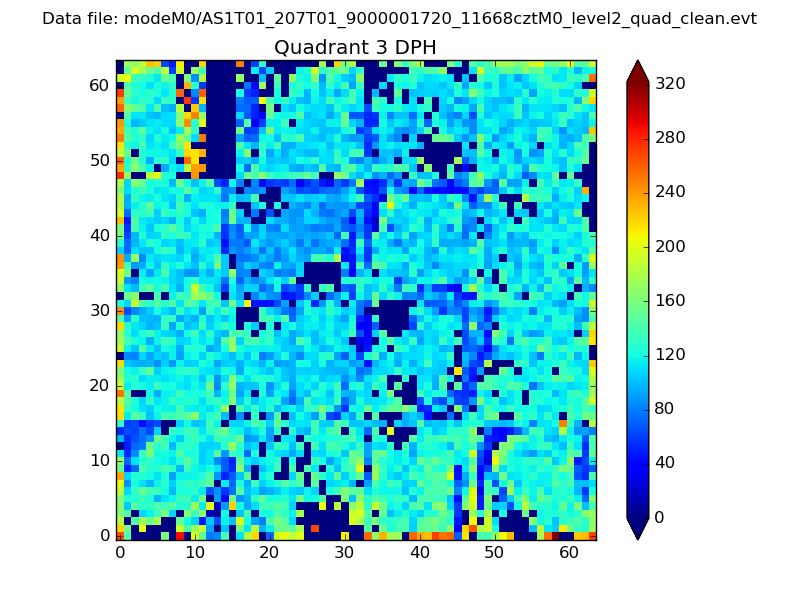 |
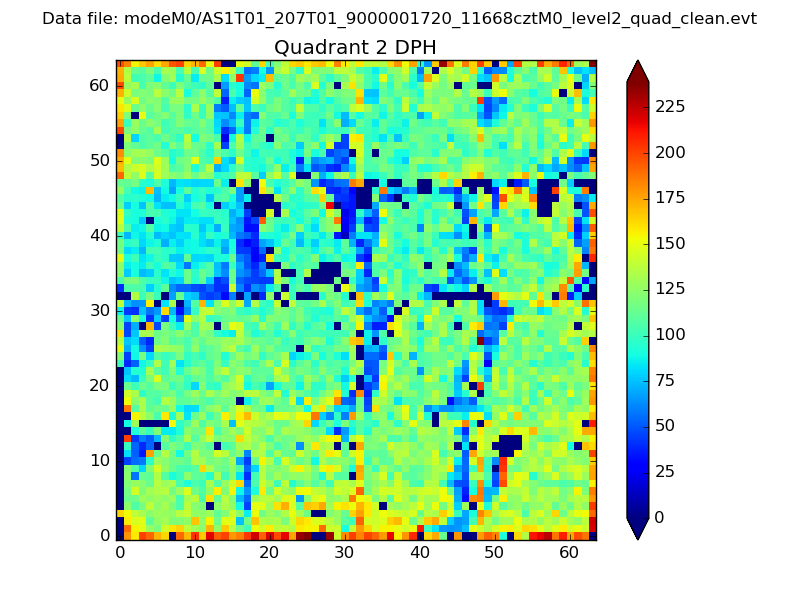 |
Quadrant C |
| Plot type | Count rate plots | Images |
|---|---|---|
| Comparison with Poisson distribution Blue bars denote a histogram of data divided into 1 sec bins. Red curve is a Poisson curve with rate = median count rate of data. |
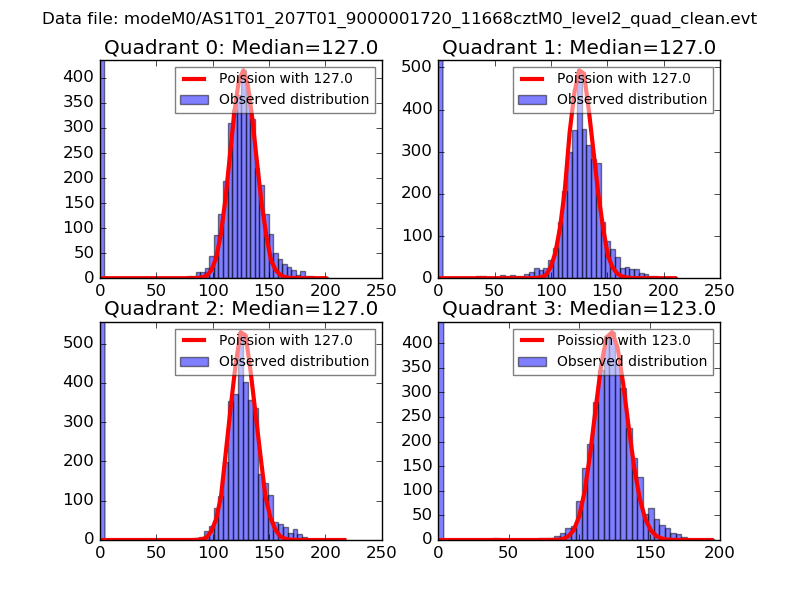 |
 |
| Quadrant-wise count rates Data is divided into 100 sec bins |
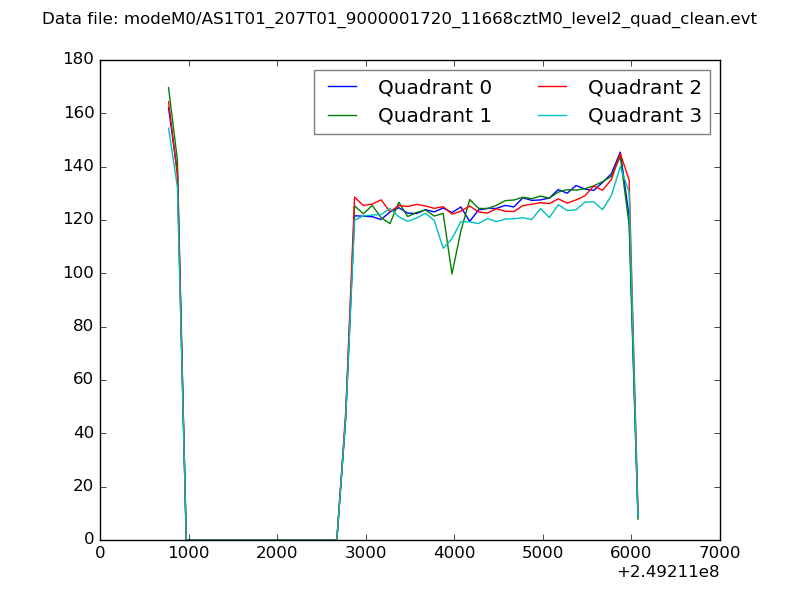 |
|
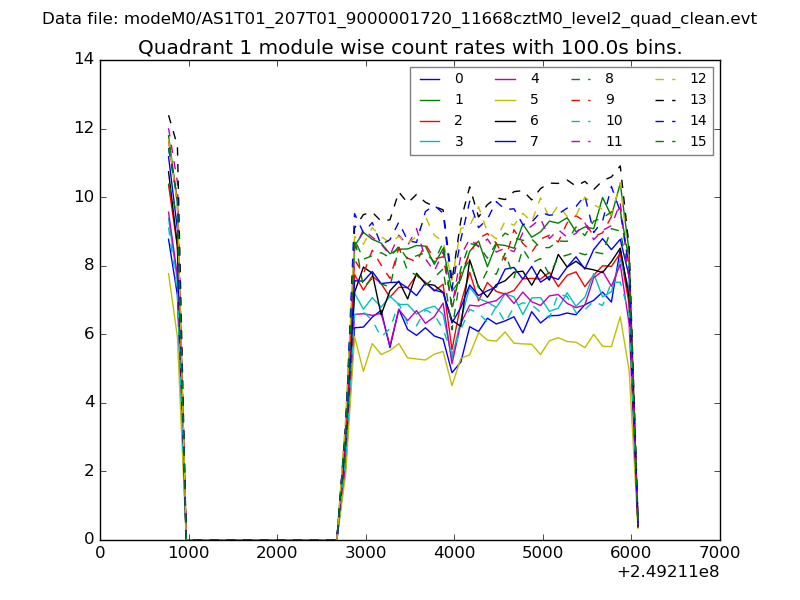
| Module-wise count rates for Quadrant A Data is divided into 100 sec bins |
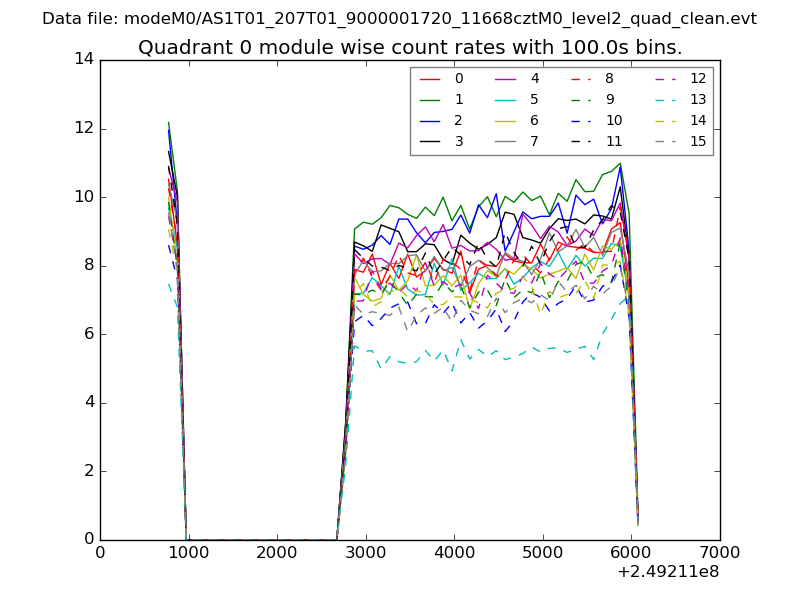 |
 |
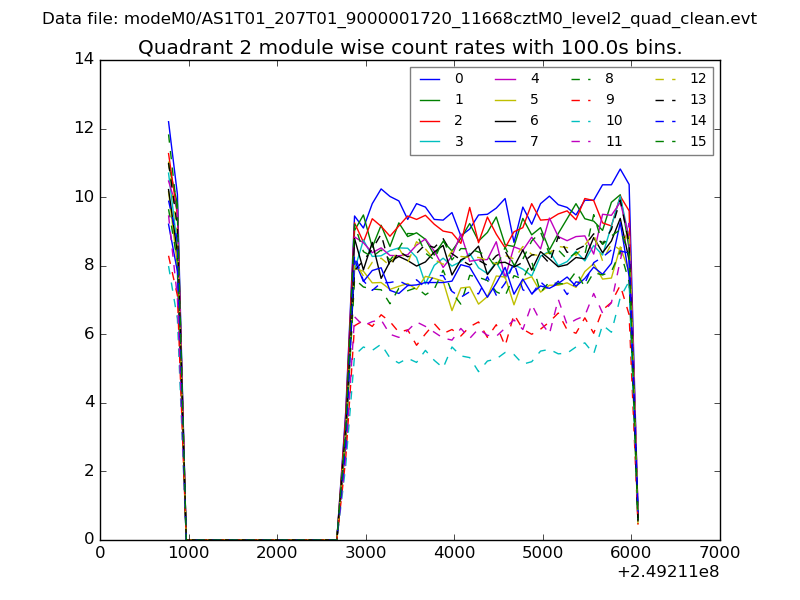
| Module-wise count rates for Quadrant B Data is divided into 100 sec bins |
 |
 |
| Module-wise count rates for Quadrant C Data is divided into 100 sec bins |
 |
 |
| Module-wise count rates for Quadrant D Data is divided into 100 sec bins |
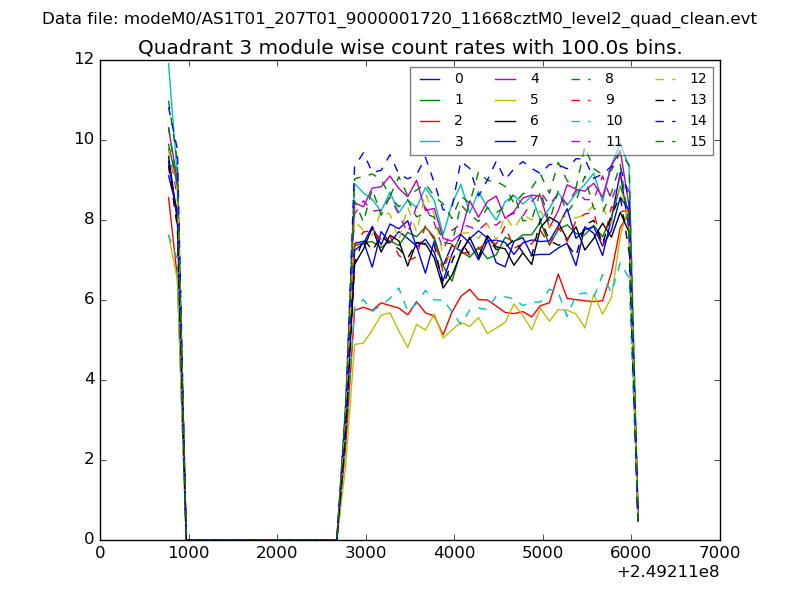 |
 |
| Parameter | Plot |
|---|---|
| CZT HV Monitor | 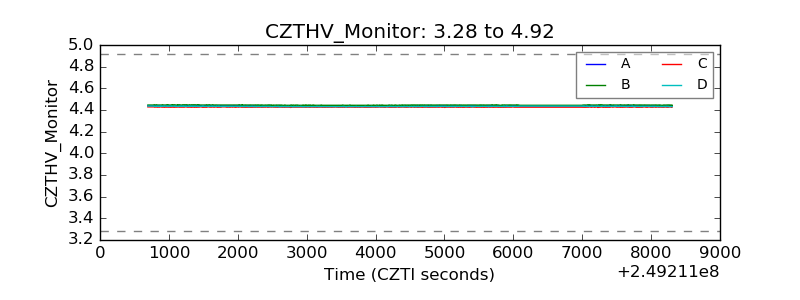 |
| D_VDD | 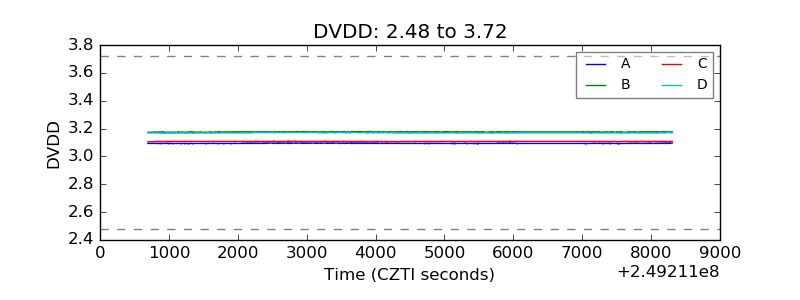 |
| Temperature 1 | 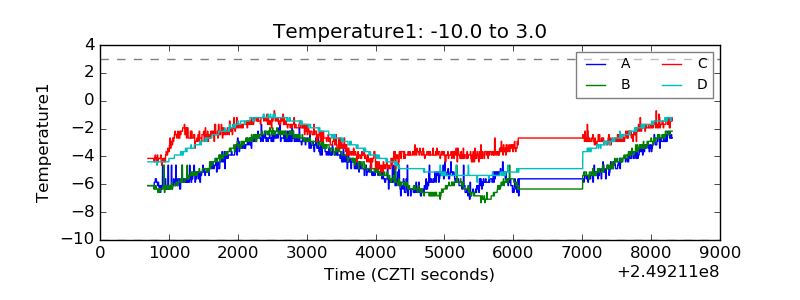 |
| Veto HV Monitor | 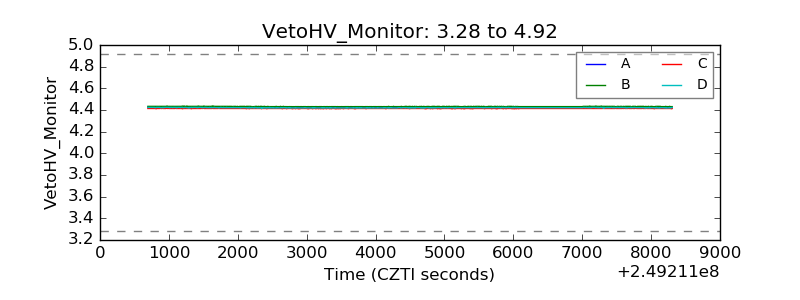 |
| Veto LLD | 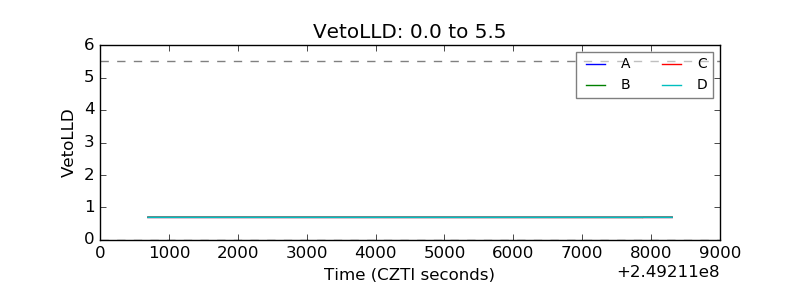 |
| Alpha Counter | 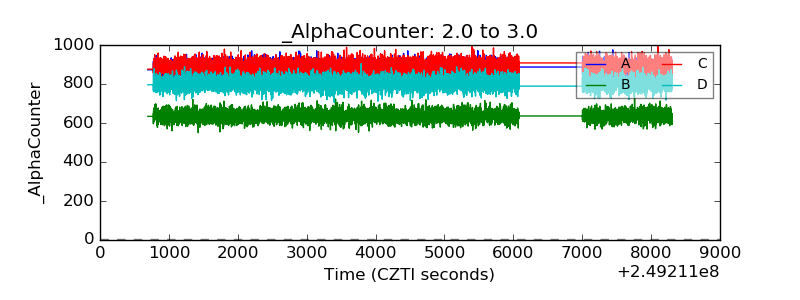 |
| _CPM_Rate | 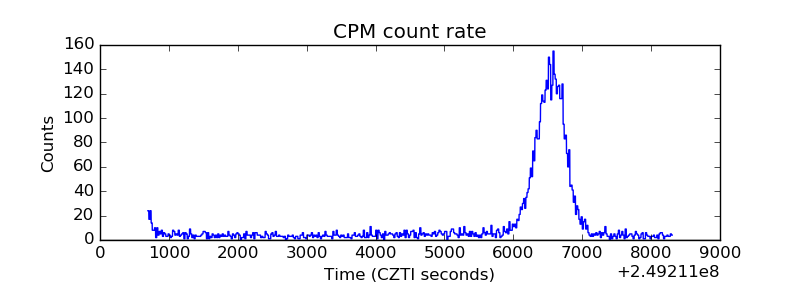 |
| CZT Counter | 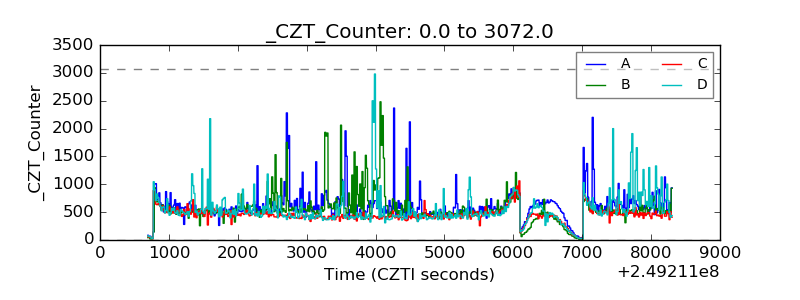 |
| +2.5 Volts monitor |  |
| +5 Volts monitor |  |
| _ROLL_ROT | 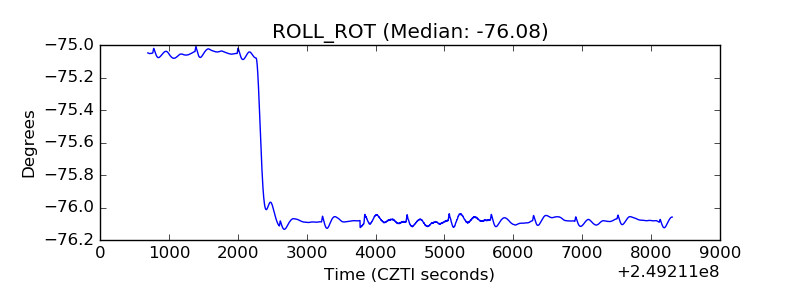 |
| _Roll_DEC |  |
| _Roll_RA | 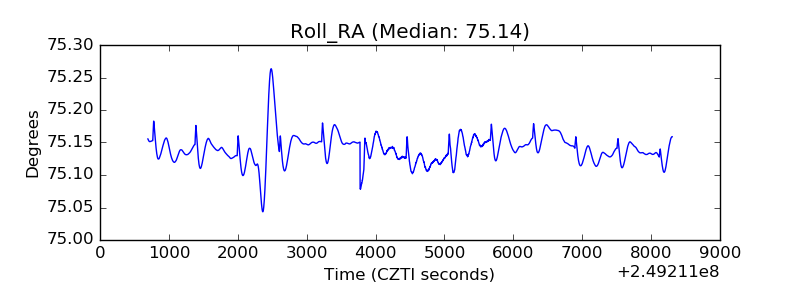 |
| Veto Counter | 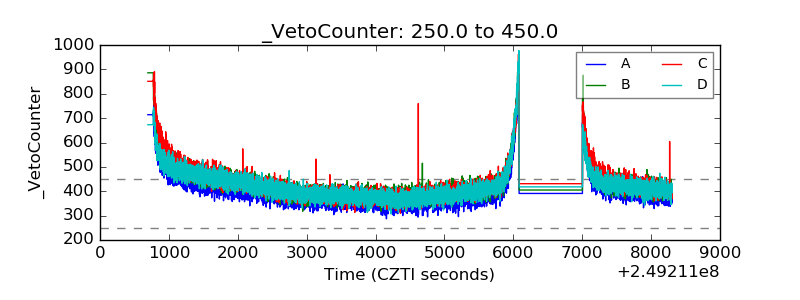 |