| Param | Original file | Final file |
|---|---|---|
| Filename | modeM0/AS1T01_207T01_9000001720_11669cztM0_level2.evt | modeM0/AS1T01_207T01_9000001720_11669cztM0_level2_quad_clean.evt |
| Size (bytes) | 581,034,240 | 84,389,760 |
| Size | 554.1 MB | 80.5 MB |
| Events in quadrant A | 4,979,527 | 510,986 |
| Events in quadrant B | 4,350,401 | 518,128 |
| Events in quadrant C | 3,365,151 | 519,691 |
| Events in quadrant D | 4,410,434 | 502,189 |
| Mode M0 | |||
|---|---|---|---|
| Quadrant | BADHDUFLAG | Total packets | Discarded packets |
| A | 0 | 19706 | 4 |
| B | 0 | 17479 | 3 |
| C | 0 | 15021 | 3 |
| D | 0 | 17980 | 3 |
| Mode M9 | |||
|---|---|---|---|
| Quadrant | BADHDUFLAG | Total packets | Discarded packets |
| A | 0 | 15 | 0 |
| B | 0 | 15 | 0 |
| C | 0 | 15 | 0 |
| D | 0 | 15 | 0 |
| Mode SS | |||
|---|---|---|---|
| Quadrant | BADHDUFLAG | Total packets | Discarded packets |
| A | 0 | 148 | 0 |
| B | 0 | 148 | 0 |
| C | 0 | 148 | 0 |
| D | 0 | 148 | 0 |
| Quadrant | Total seconds | Saturated seconds | Saturation percentage |
|---|---|---|---|
| A | 7246 | 375 | 5.175269% |
| B | 7246 | 329 | 4.540436% |
| C | 7246 | 129 | 1.780293% |
| D | 7246 | 227 | 3.132763% |
Noise dominated data is calculated using 1-second bins in cleaned event files. If a bin has >2000 counts, and if more than 50% of those come from <1% of pixels, then it is considered to be noise-dominated and hence unusable.
| Quadrant | # 1 sec bins | Bins with >0 counts | Bins with >2000 counts | High rate bins dominated by noise | Noise dominated (total time) | Noise dominated (detector-on time) | Marked lightcurve |
|---|---|---|---|---|---|---|---|
| A | 8702 | 7250 | 79 | 79 | 0.91% | 1.09% | 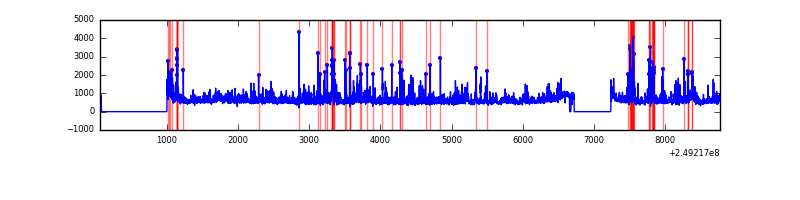 |
| B | 8702 | 7250 | 93 | 93 | 1.07% | 1.28% | 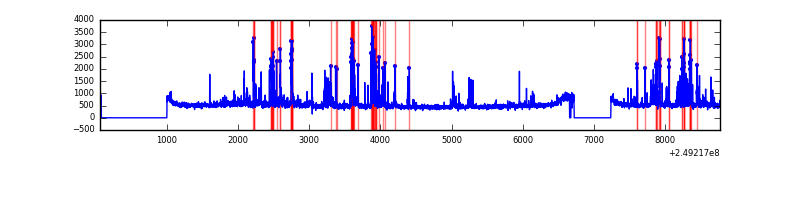 |
| C | 8702 | 7250 | 0 | 0 | 0.00% | 0.00% | 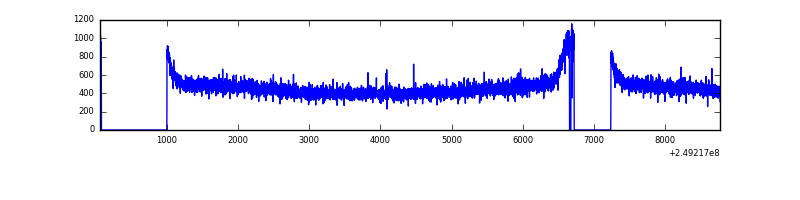 |
| D | 8702 | 7250 | 55 | 55 | 0.63% | 0.76% | 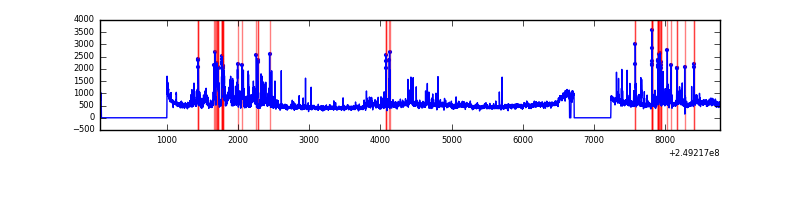 |
Top three noisy pixels from each quadrant. If the there are fewer than three noisy pixels in the level2.evt file, extra rows are filled as -1
| Pixel properties | Quadrant properties | ||||||
|---|---|---|---|---|---|---|---|
| Quadrant | DetID | PixID | Counts | Sigma | Mean | Median | Sigma |
| A | 8 | 5 | 970702 | 5504.22 | 868 | 849 | 176.2 |
| A | 1 | 162 | 244066 | 1380.33 | 868 | 849 | 176.2 |
| A | 1 | 178 | 143174 | 807.74 | 868 | 849 | 176.2 |
| B | 4 | 239 | 648336 | 3876.23 | 870 | 844 | 167.0 |
| B | 15 | 204 | 92982 | 551.59 | 870 | 844 | 167.0 |
| B | 0 | 214 | 74630 | 441.72 | 870 | 844 | 167.0 |
| C | 13 | 61 | 6425 | 27.77 | 863 | 866 | 200.2 |
| C | 14 | 234 | 2191 | 6.62 | 863 | 866 | 200.2 |
| C | 3 | 202 | 2149 | 6.41 | 863 | 866 | 200.2 |
| D | 13 | 104 | 493494 | 2418.57 | 855 | 829 | 203.7 |
| D | 8 | 195 | 351517 | 1721.59 | 855 | 829 | 203.7 |
| D | 1 | 52 | 204188 | 998.32 | 855 | 829 | 203.7 |
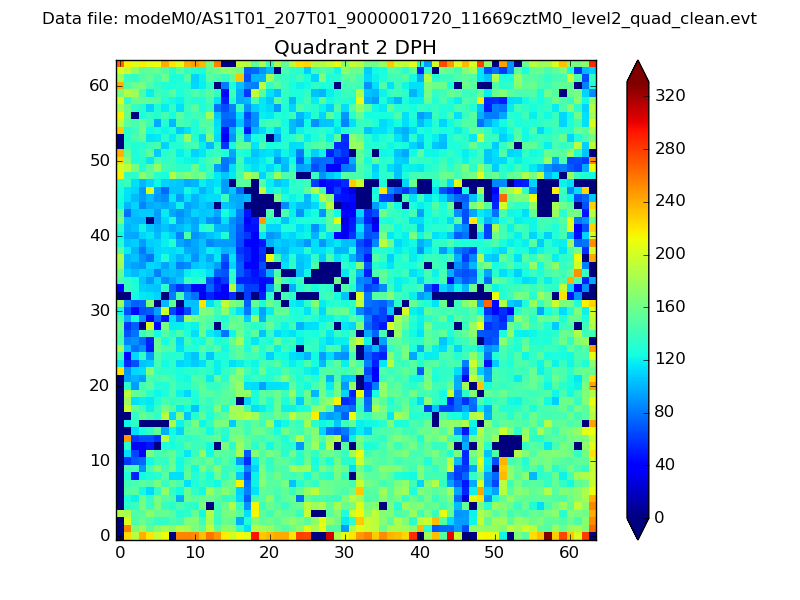
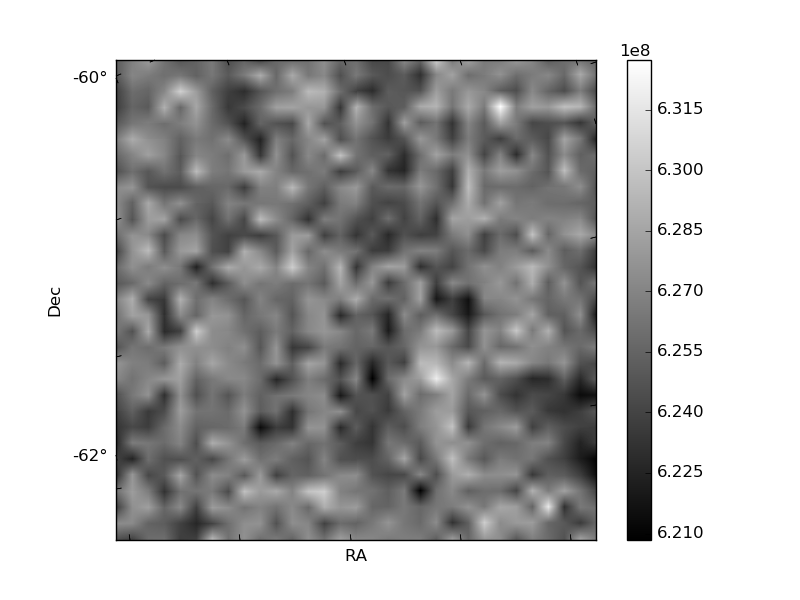
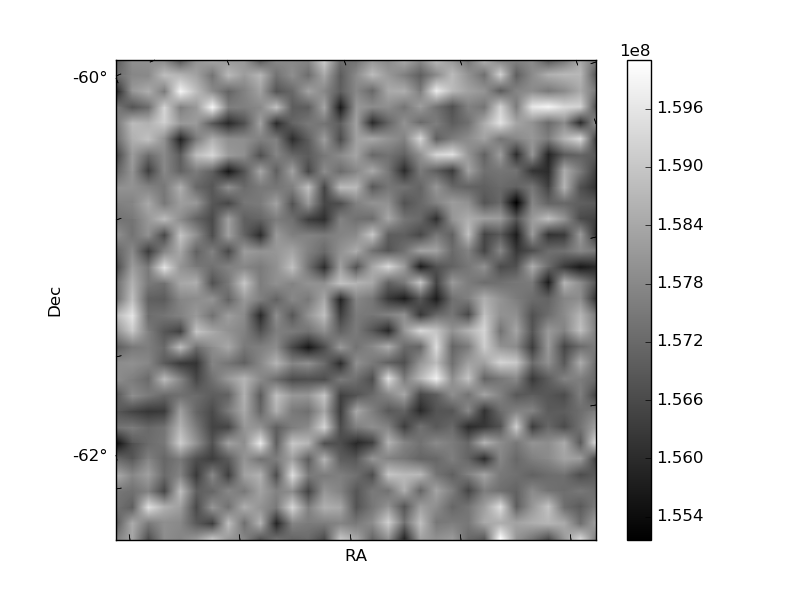
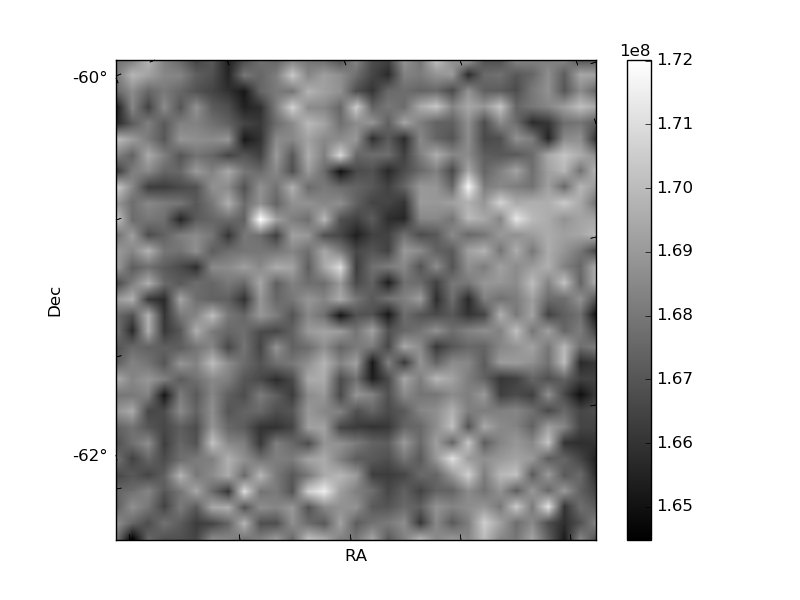
Histogram calculated using DETX and DETY for each event in the final _common_clean file
| Quadrant A | 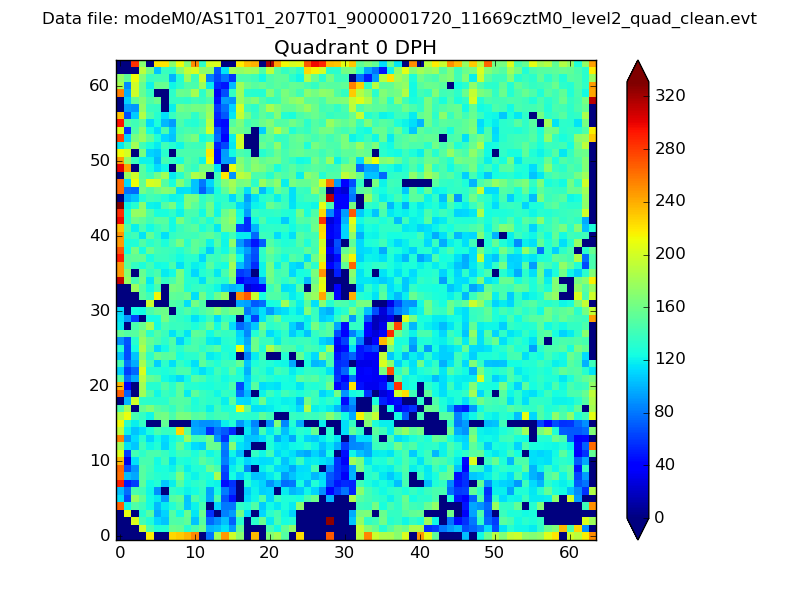 |
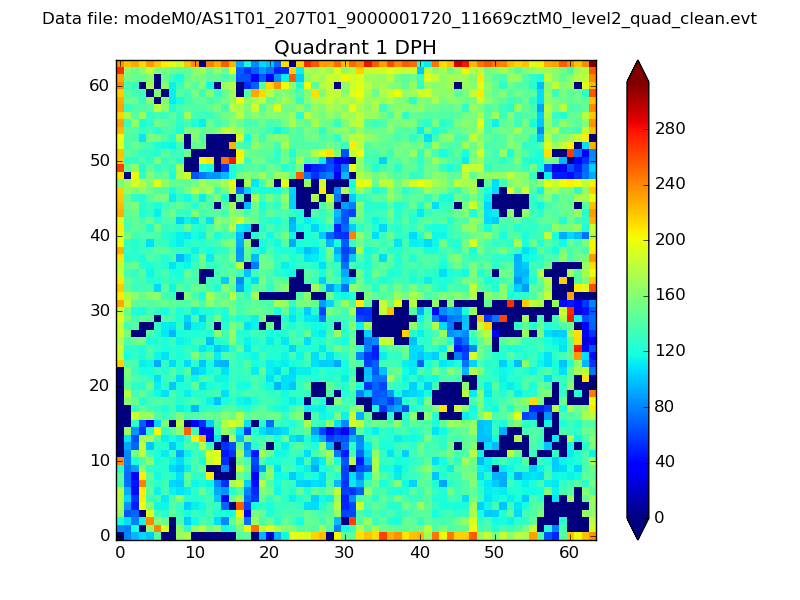 |
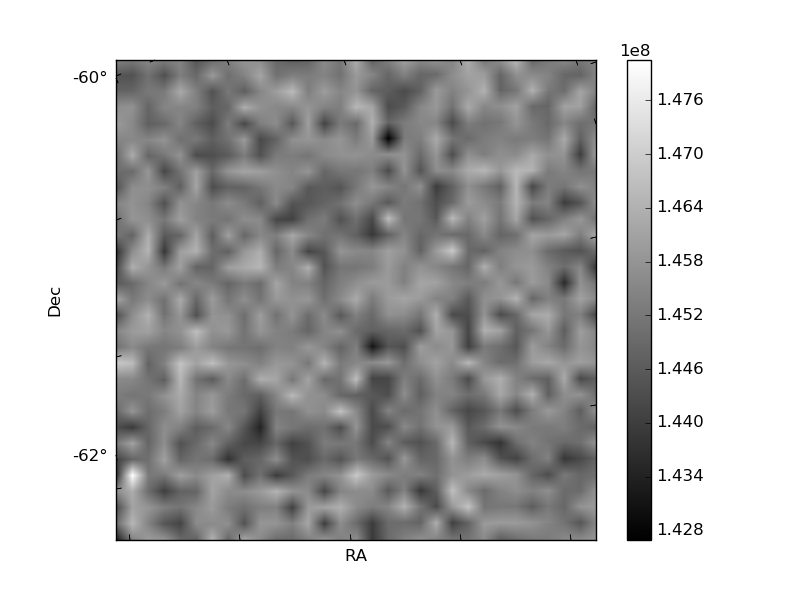
Quadrant B |
|---|---|---|---|
| Quadrant D | 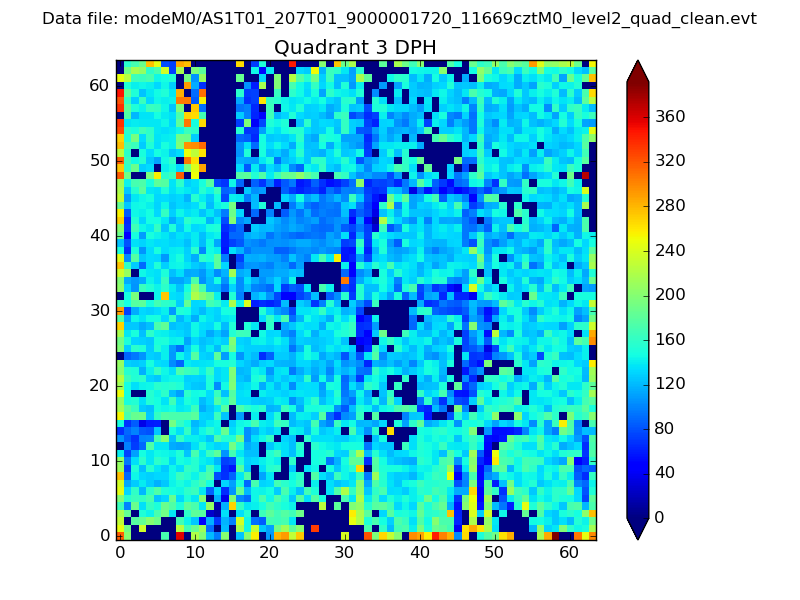 |
 |
Quadrant C |
| Plot type | Count rate plots | Images |
|---|---|---|
| Comparison with Poisson distribution Blue bars denote a histogram of data divided into 1 sec bins. Red curve is a Poisson curve with rate = median count rate of data. |
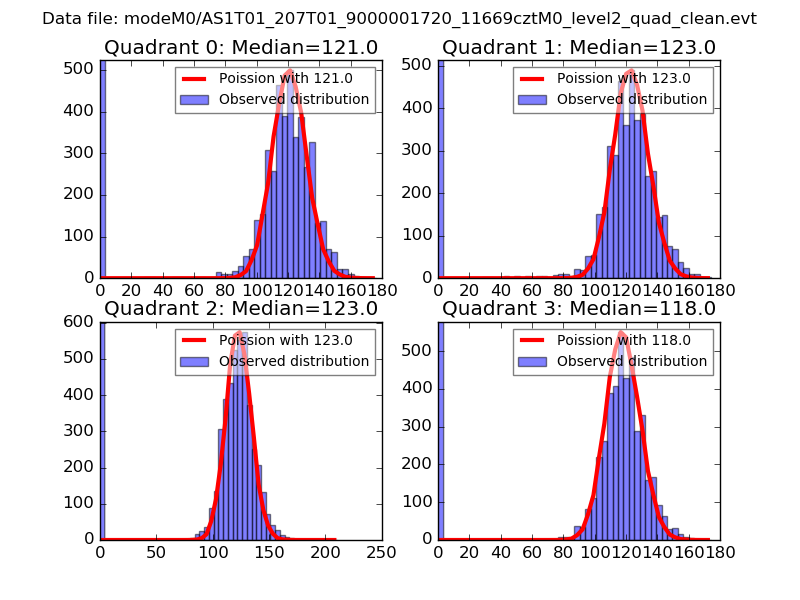 |
 |
| Quadrant-wise count rates Data is divided into 100 sec bins |
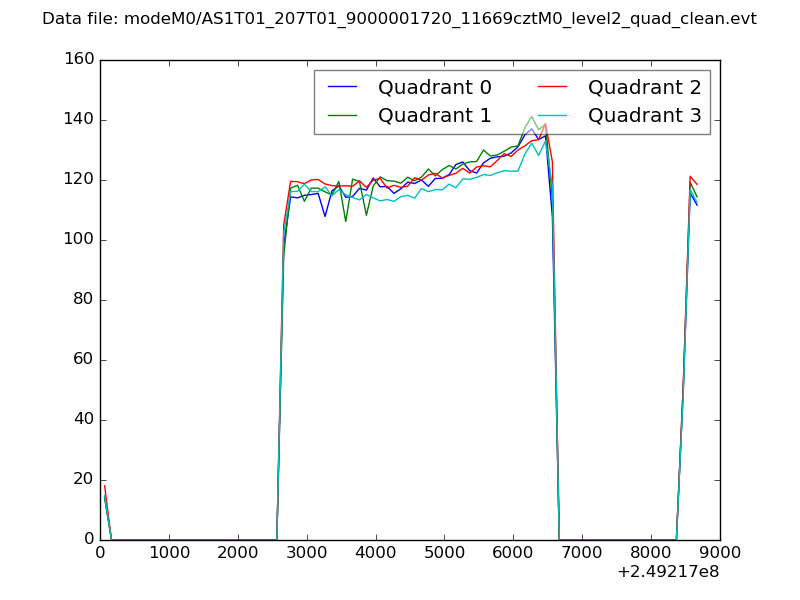 |
|
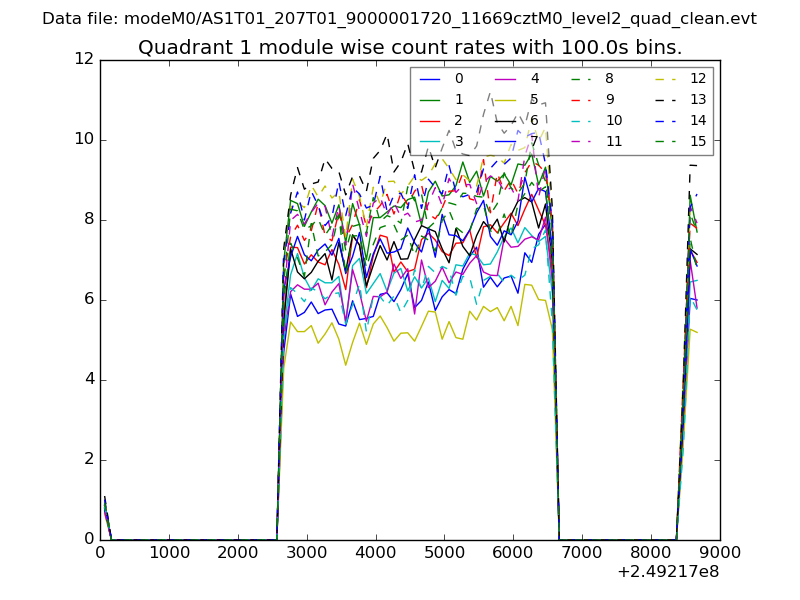
| Module-wise count rates for Quadrant A Data is divided into 100 sec bins |
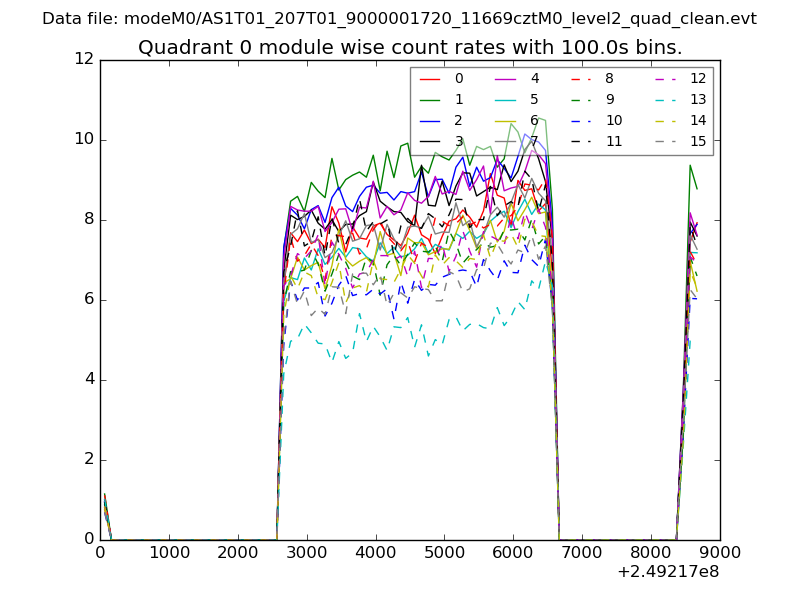 |
 |
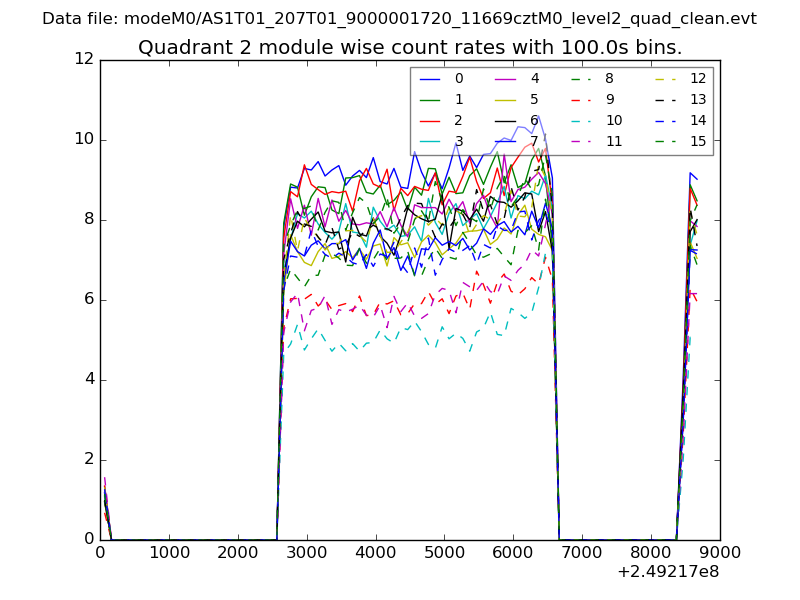
| Module-wise count rates for Quadrant B Data is divided into 100 sec bins |
 |
 |
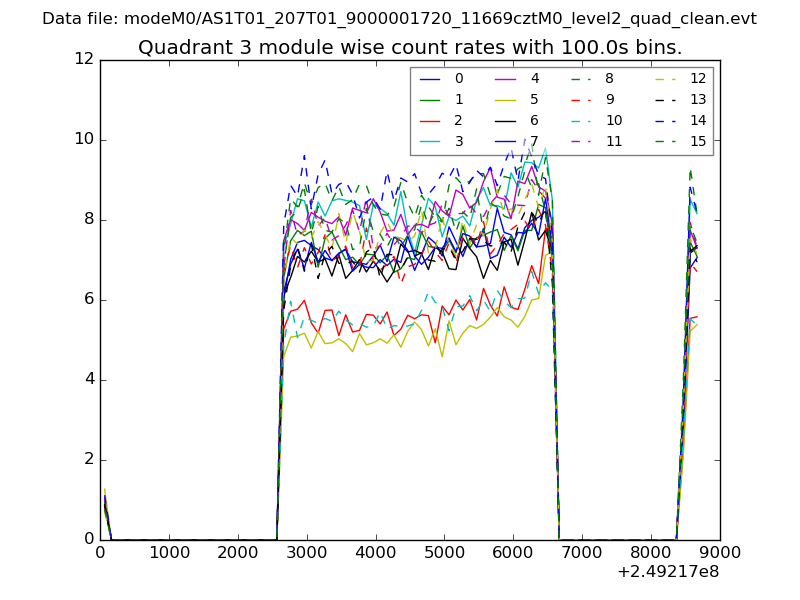
| Module-wise count rates for Quadrant C Data is divided into 100 sec bins |
 |
 |
| Module-wise count rates for Quadrant D Data is divided into 100 sec bins |
 |
 |
| Parameter | Plot |
|---|---|
| CZT HV Monitor | 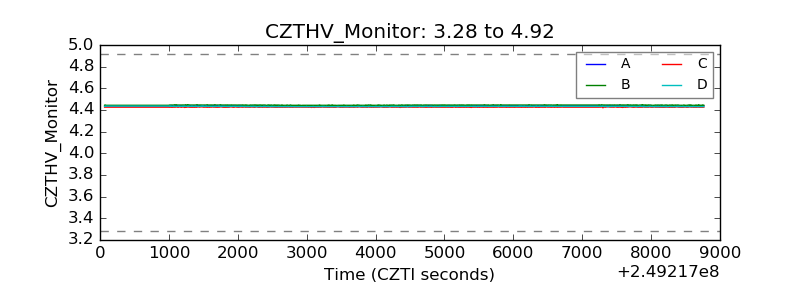 |
| D_VDD | 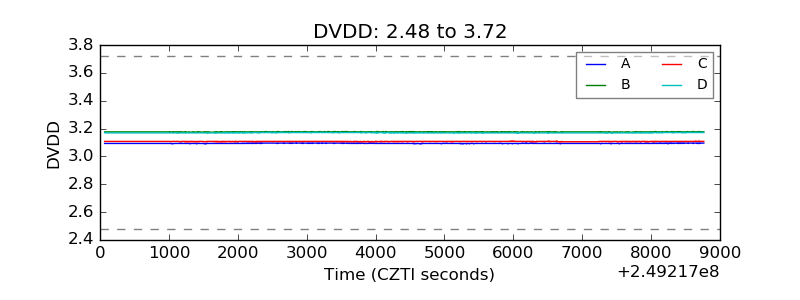 |
| Temperature 1 |  |
| Veto HV Monitor | 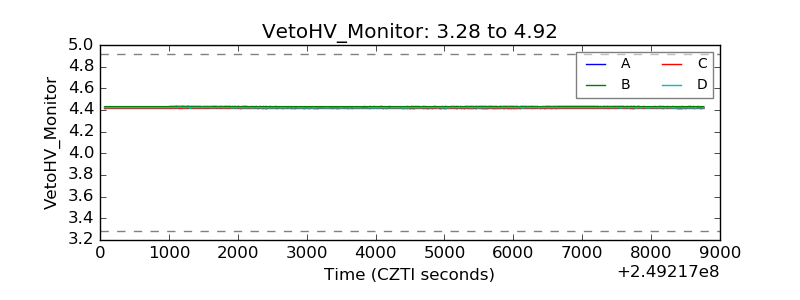 |
| Veto LLD | 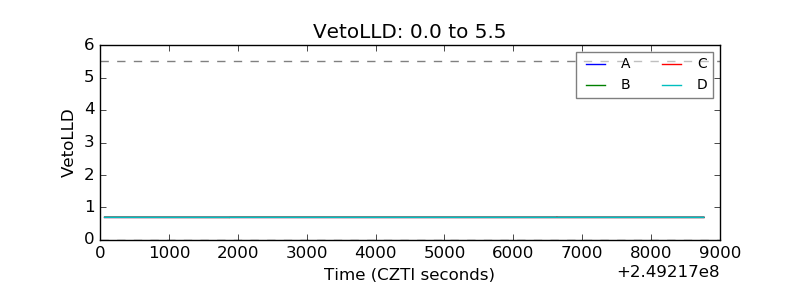 |
| Alpha Counter | 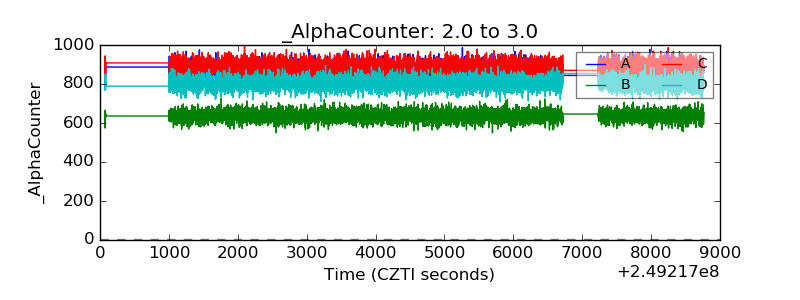 |
| _CPM_Rate | 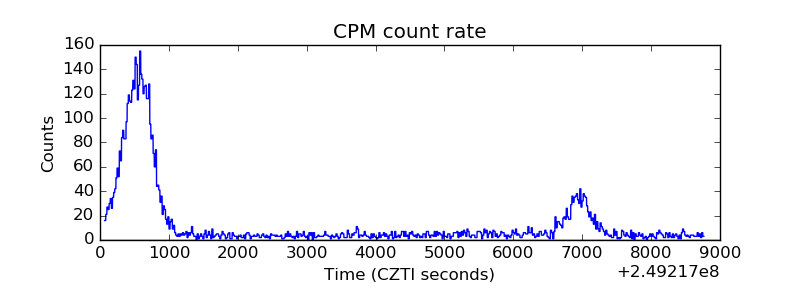 |
| CZT Counter | 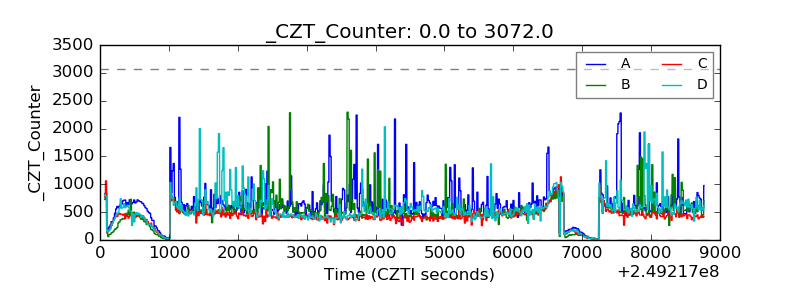 |
| +2.5 Volts monitor |  |
| +5 Volts monitor |  |
| _ROLL_ROT | 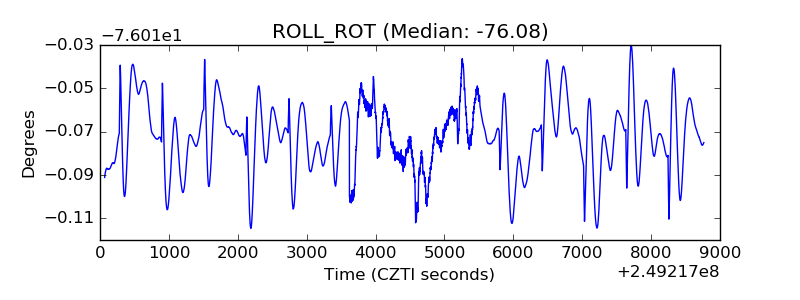 |
| _Roll_DEC | 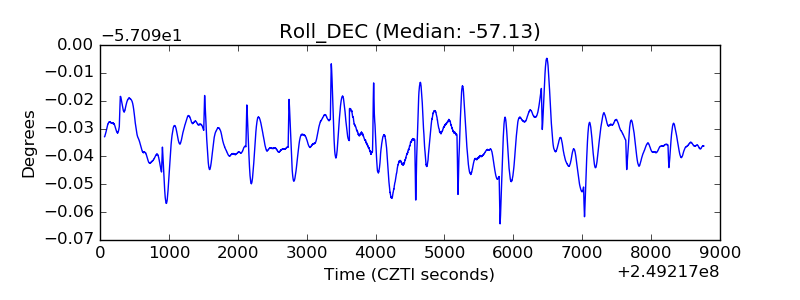 |
| _Roll_RA | 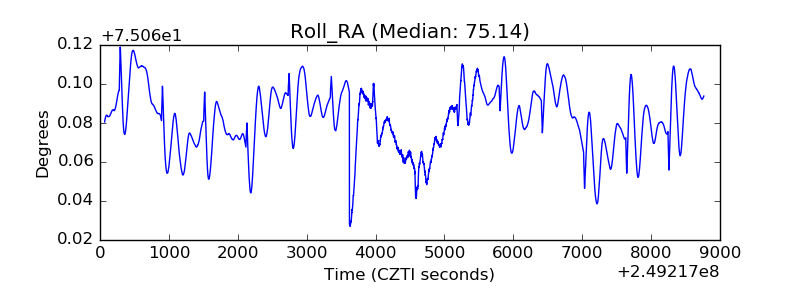 |
| Veto Counter | 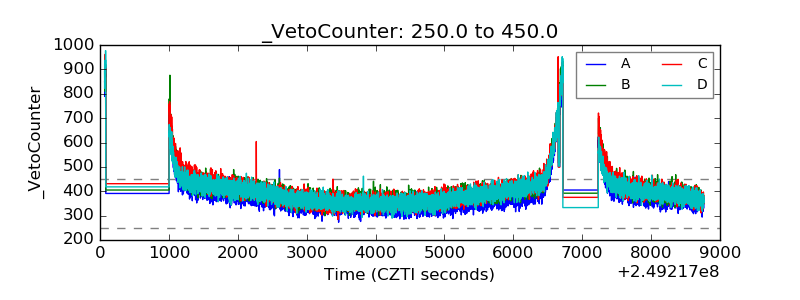 |