| Param | Original file | Final file |
|---|---|---|
| Filename | modeM0/AS1T01_207T01_9000001720_11670cztM0_level2.evt | modeM0/AS1T01_207T01_9000001720_11670cztM0_level2_quad_clean.evt |
| Size (bytes) | 400,844,160 | 66,237,120 |
| Size | 382.3 MB | 63.2 MB |
| Events in quadrant A | 3,729,658 | 413,233 |
| Events in quadrant B | 2,824,822 | 424,576 |
| Events in quadrant C | 2,192,863 | 422,390 |
| Events in quadrant D | 3,058,726 | 401,409 |
| Mode M0 | |||
|---|---|---|---|
| Quadrant | BADHDUFLAG | Total packets | Discarded packets |
| A | 0 | 14448 | 3 |
| B | 0 | 11602 | 2 |
| C | 0 | 10185 | 2 |
| D | 0 | 12250 | 2 |
| Mode M9 | |||
|---|---|---|---|
| Quadrant | BADHDUFLAG | Total packets | Discarded packets |
| A | 0 | 5 | 0 |
| B | 0 | 5 | 0 |
| C | 0 | 5 | 0 |
| D | 0 | 5 | 0 |
| Mode SS | |||
|---|---|---|---|
| Quadrant | BADHDUFLAG | Total packets | Discarded packets |
| A | 0 | 102 | 0 |
| B | 0 | 102 | 0 |
| C | 0 | 102 | 0 |
| D | 0 | 102 | 0 |
| Quadrant | Total seconds | Saturated seconds | Saturation percentage |
|---|---|---|---|
| A | 4897 | 336 | 6.861344% |
| B | 4897 | 224 | 4.574229% |
| C | 4897 | 103 | 2.103329% |
| D | 4897 | 210 | 4.288340% |
Noise dominated data is calculated using 1-second bins in cleaned event files. If a bin has >2000 counts, and if more than 50% of those come from <1% of pixels, then it is considered to be noise-dominated and hence unusable.
| Quadrant | # 1 sec bins | Bins with >0 counts | Bins with >2000 counts | High rate bins dominated by noise | Noise dominated (total time) | Noise dominated (detector-on time) | Marked lightcurve |
|---|---|---|---|---|---|---|---|
| A | 5433 | 4900 | 121 | 121 | 2.23% | 2.47% | 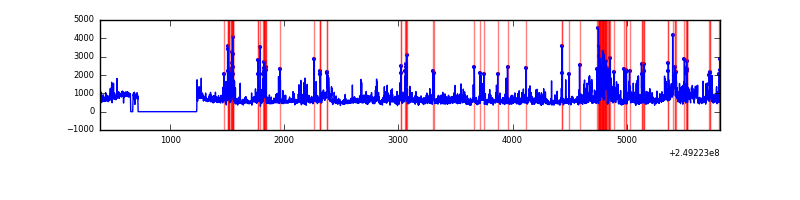 |
| B | 5433 | 4900 | 46 | 46 | 0.85% | 0.94% | 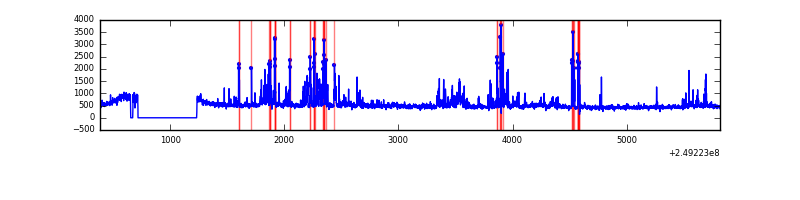 |
| C | 5433 | 4900 | 0 | 0 | 0.00% | 0.00% | 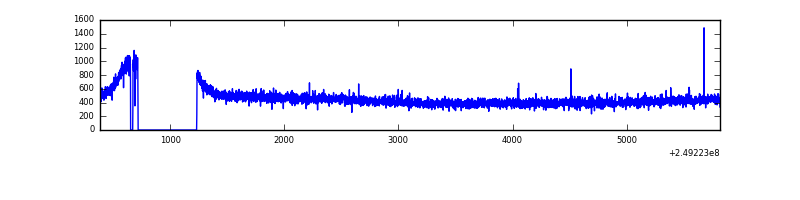 |
| D | 5433 | 4900 | 77 | 77 | 1.42% | 1.57% | 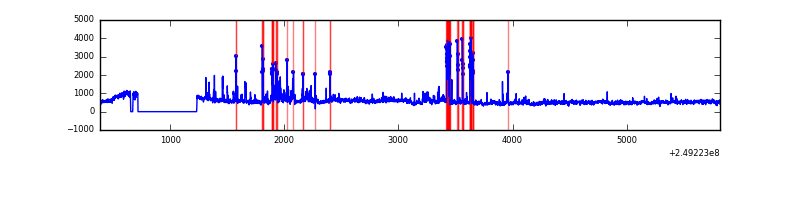 |
Top three noisy pixels from each quadrant. If the there are fewer than three noisy pixels in the level2.evt file, extra rows are filled as -1
| Pixel properties | Quadrant properties | ||||||
|---|---|---|---|---|---|---|---|
| Quadrant | DetID | PixID | Counts | Sigma | Mean | Median | Sigma |
| A | 8 | 5 | 989983 | 8371.89 | 568 | 554 | 118.2 |
| A | 1 | 162 | 184901 | 1559.82 | 568 | 554 | 118.2 |
| A | 1 | 178 | 108659 | 914.71 | 568 | 554 | 118.2 |
| B | 4 | 239 | 330864 | 2937.92 | 575 | 559 | 112.4 |
| B | 3 | 64 | 110230 | 975.48 | 575 | 559 | 112.4 |
| B | 15 | 204 | 57673 | 508.0 | 575 | 559 | 112.4 |
| C | 13 | 61 | 4144 | 27.29 | 562 | 564 | 131.2 |
| C | 9 | 54 | 1540 | 7.44 | 562 | 564 | 131.2 |
| C | 14 | 234 | 1447 | 6.73 | 562 | 564 | 131.2 |
| D | 8 | 195 | 425661 | 3148.88 | 557 | 539 | 135.0 |
| D | 1 | 52 | 266450 | 1969.61 | 557 | 539 | 135.0 |
| D | 13 | 104 | 145956 | 1077.11 | 557 | 539 | 135.0 |
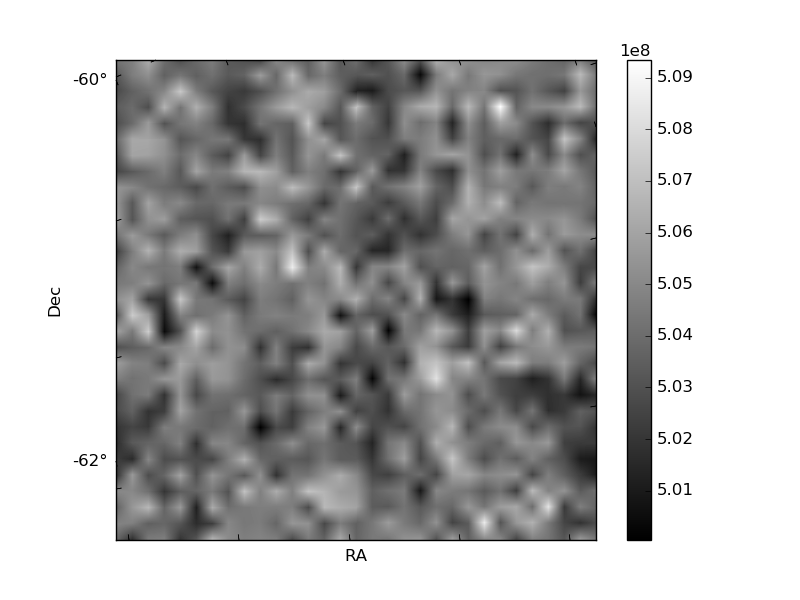
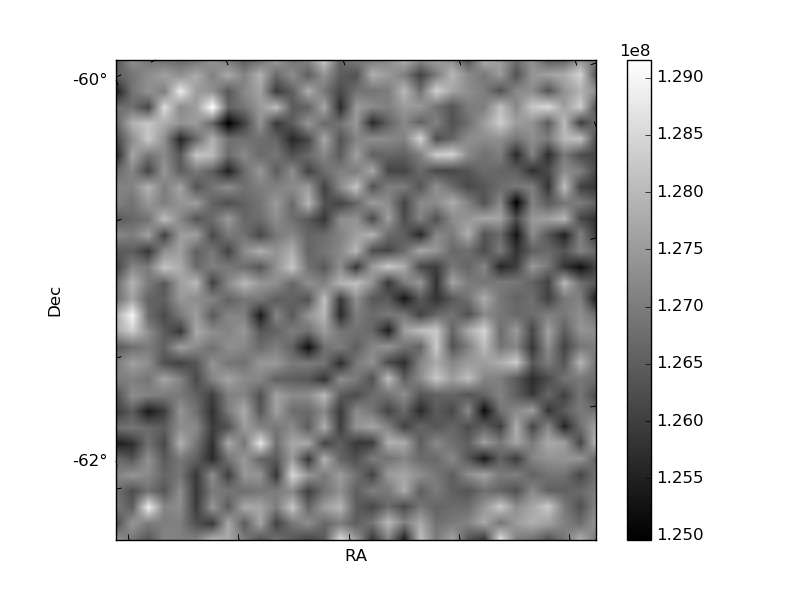
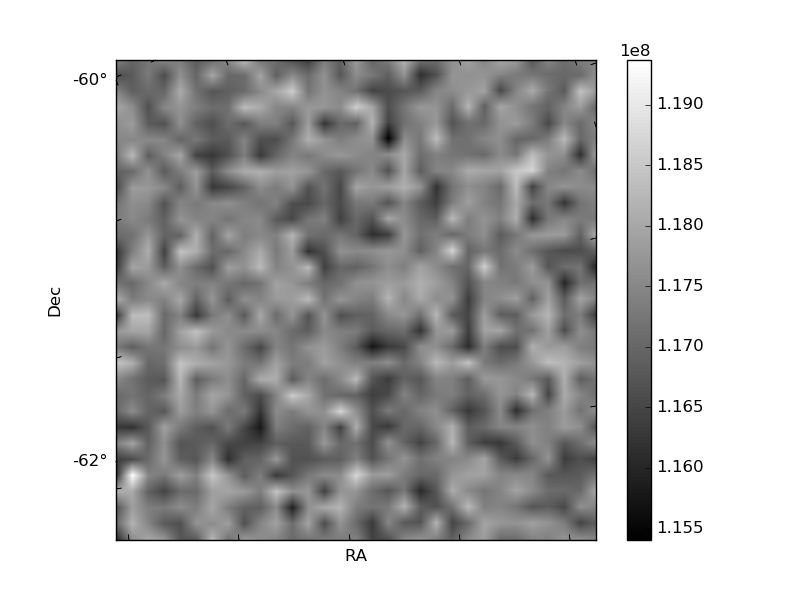
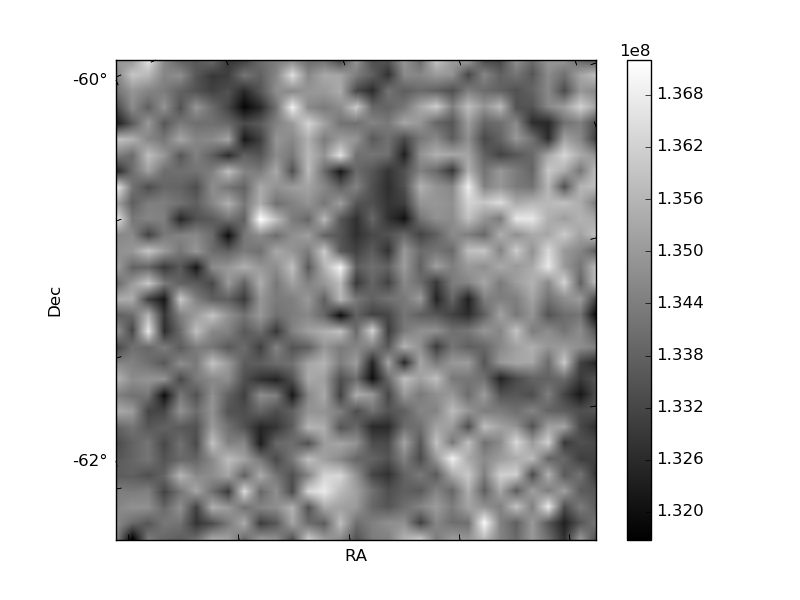
Histogram calculated using DETX and DETY for each event in the final _common_clean file
| Quadrant A | 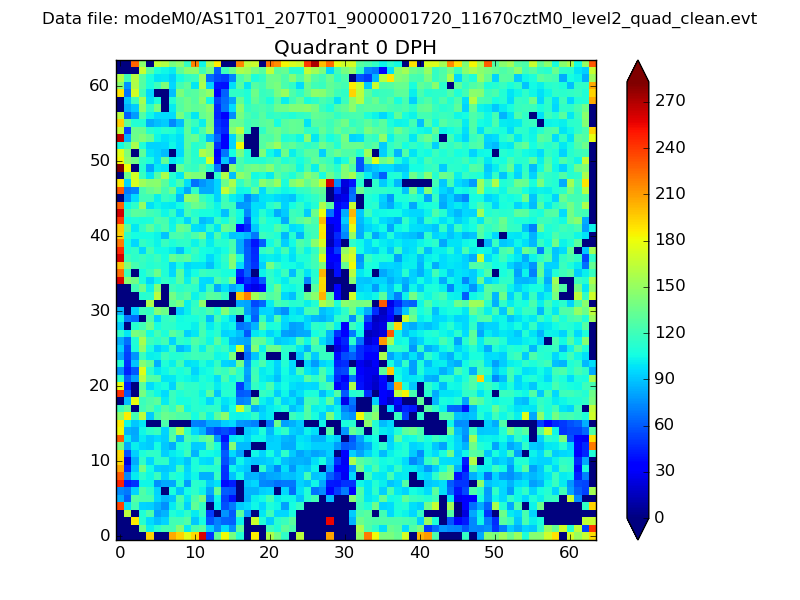 |
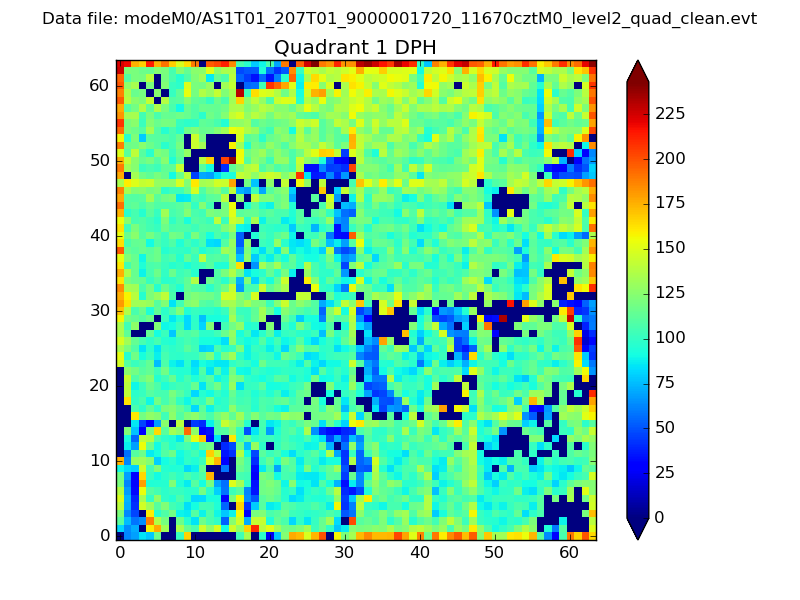 |
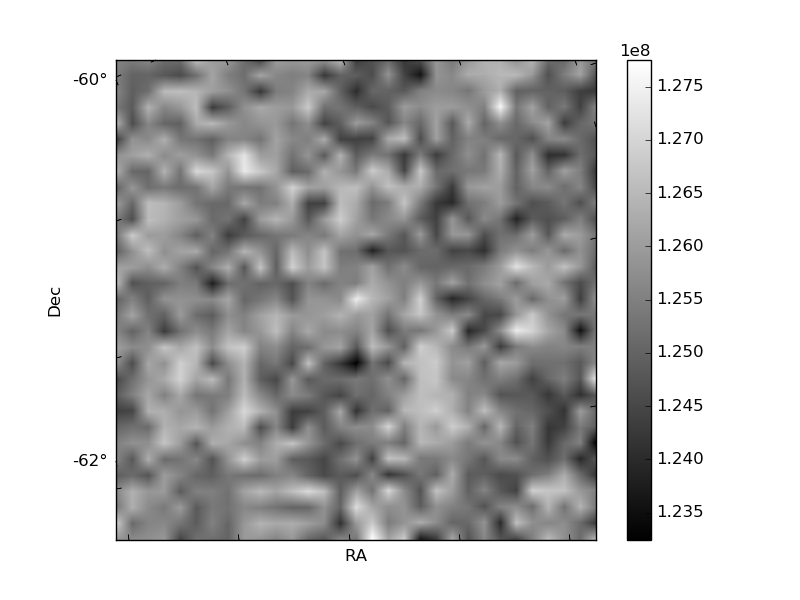
Quadrant B |
|---|---|---|---|
| Quadrant D | 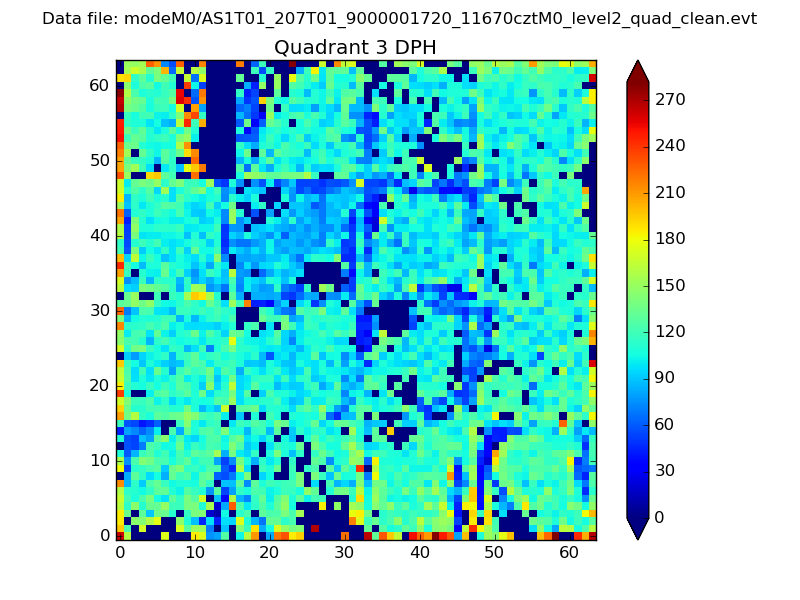 |
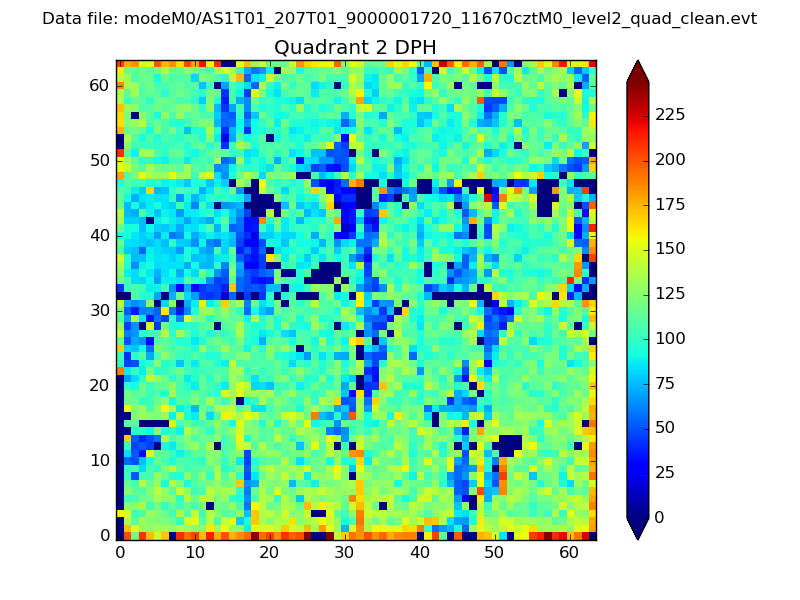 |
Quadrant C |
| Plot type | Count rate plots | Images |
|---|---|---|
| Comparison with Poisson distribution Blue bars denote a histogram of data divided into 1 sec bins. Red curve is a Poisson curve with rate = median count rate of data. |
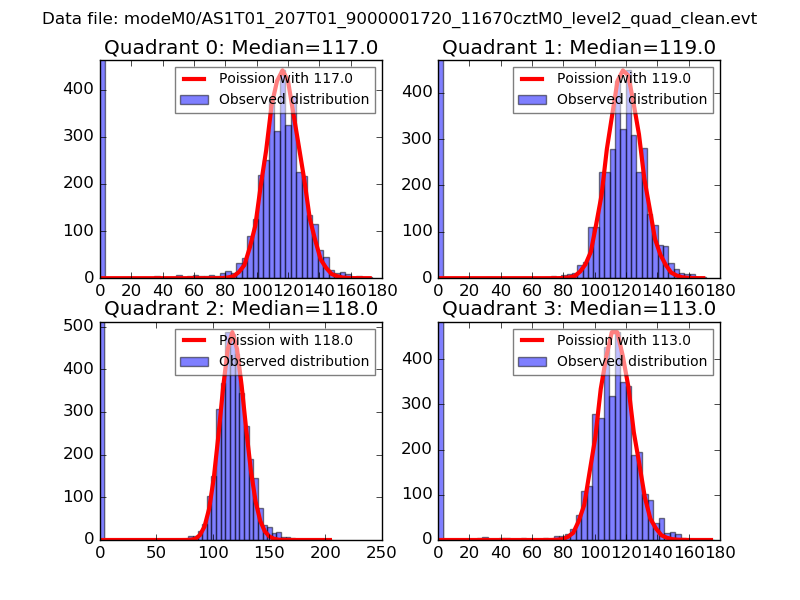 |
 |
| Quadrant-wise count rates Data is divided into 100 sec bins |
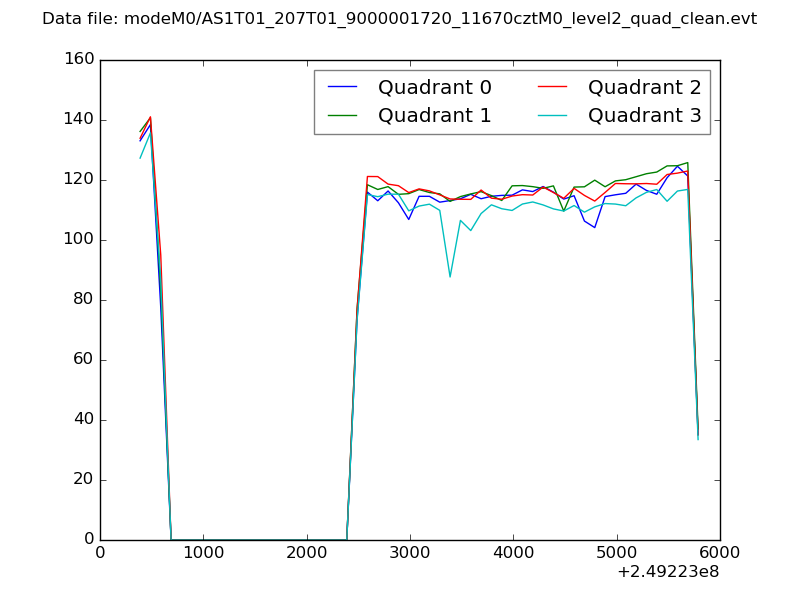 |
|
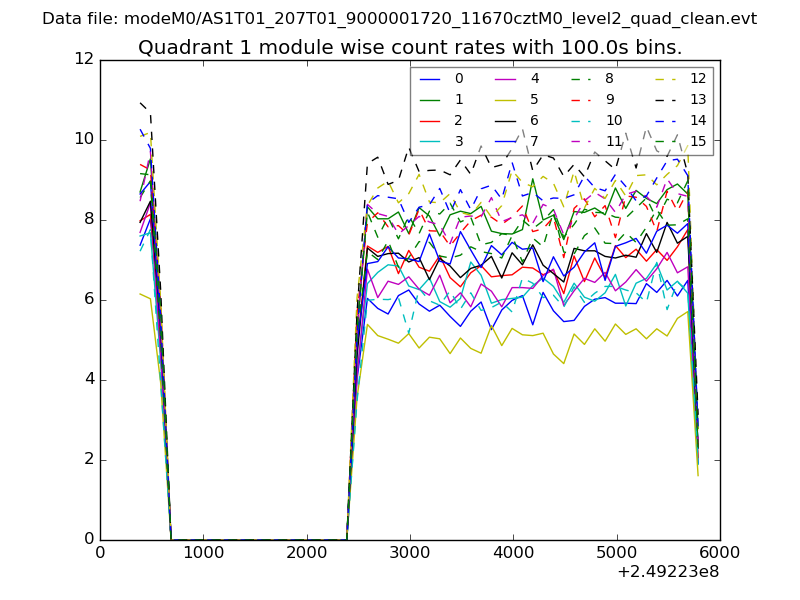
| Module-wise count rates for Quadrant A Data is divided into 100 sec bins |
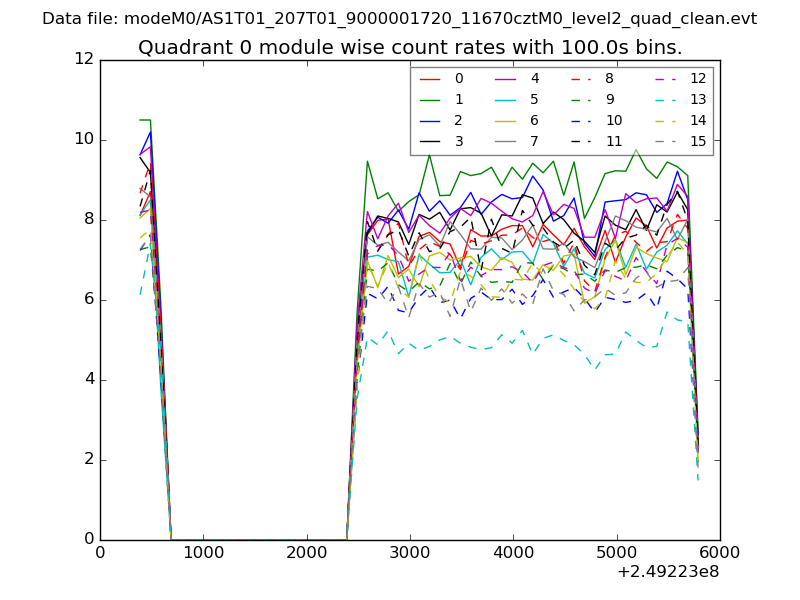 |
 |
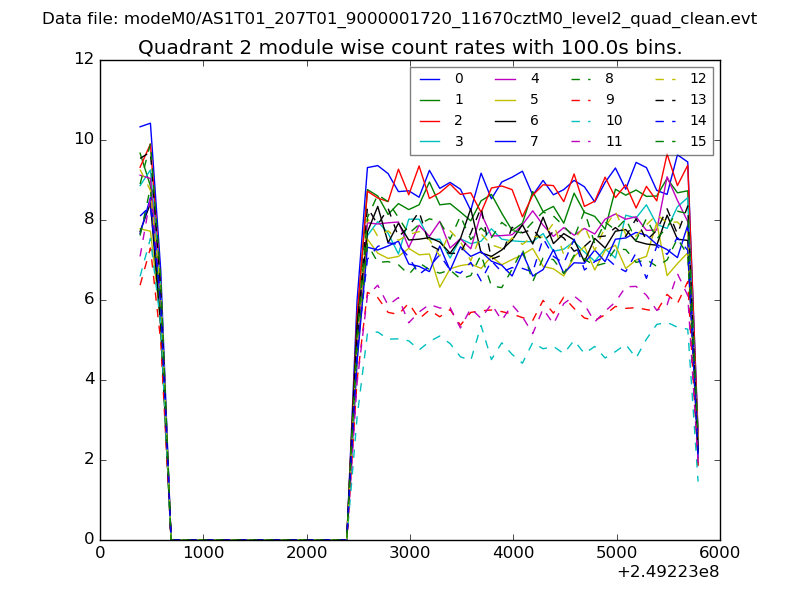
| Module-wise count rates for Quadrant B Data is divided into 100 sec bins |
 |
 |
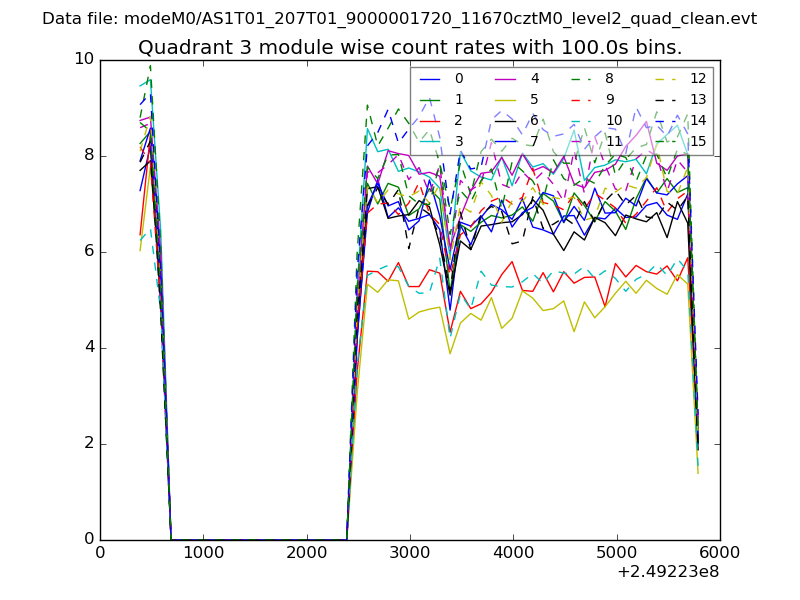
| Module-wise count rates for Quadrant C Data is divided into 100 sec bins |
 |
 |
| Module-wise count rates for Quadrant D Data is divided into 100 sec bins |
 |
 |
| Parameter | Plot |
|---|---|
| CZT HV Monitor | 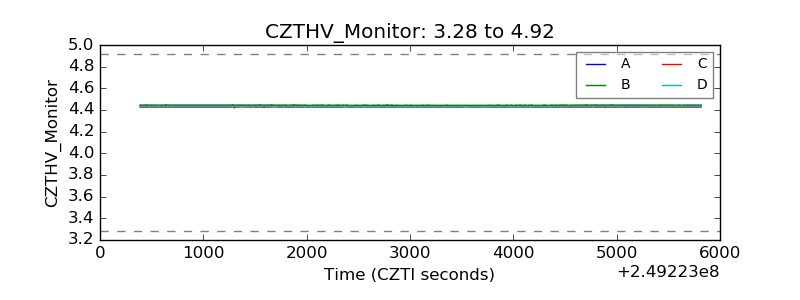 |
| D_VDD | 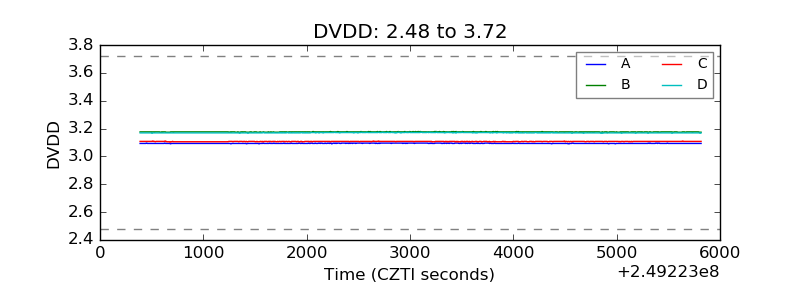 |
| Temperature 1 | 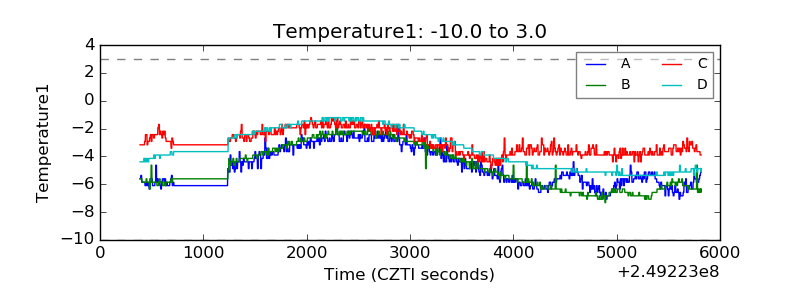 |
| Veto HV Monitor | 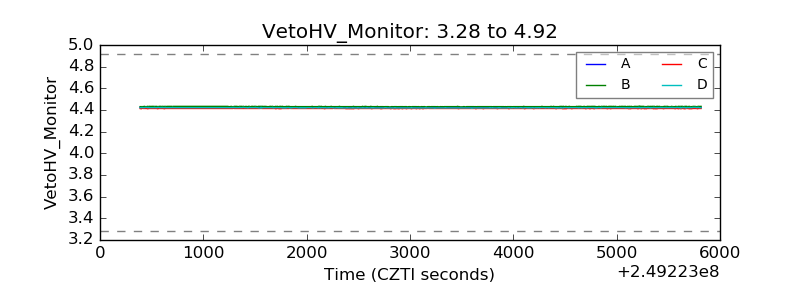 |
| Veto LLD | 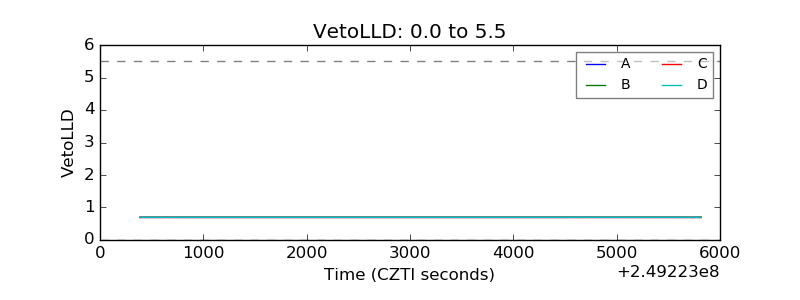 |
| Alpha Counter | 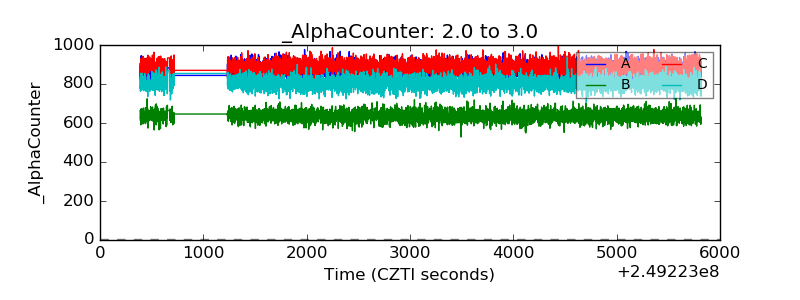 |
| _CPM_Rate | 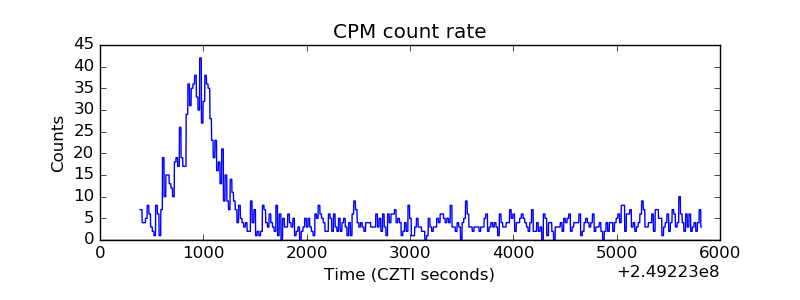 |
| CZT Counter | 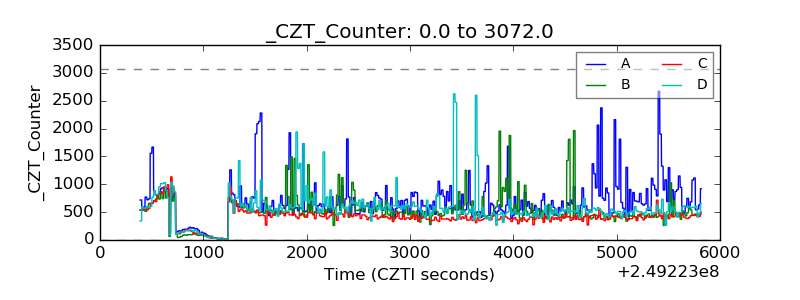 |
| +2.5 Volts monitor |  |
| +5 Volts monitor |  |
| _ROLL_ROT | 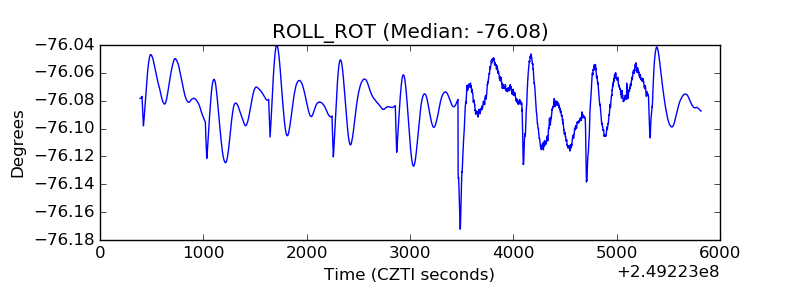 |
| _Roll_DEC | 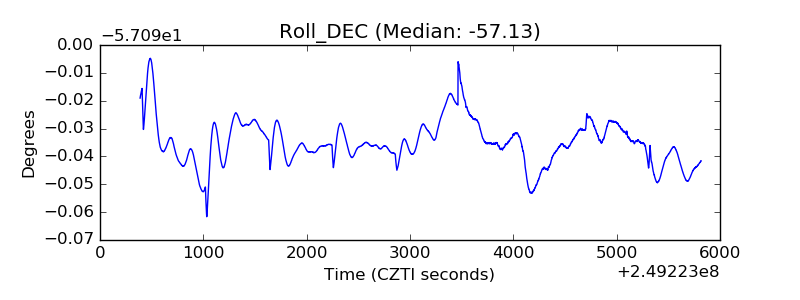 |
| _Roll_RA | 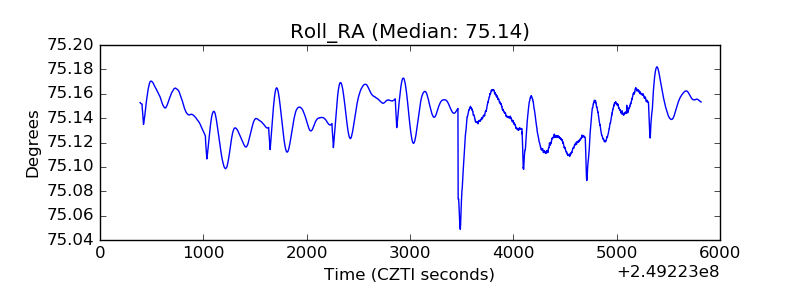 |
| Veto Counter | 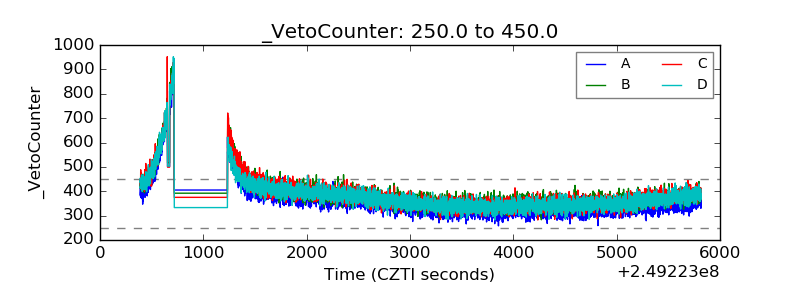 |