| Param | Original file | Final file |
|---|---|---|
| Filename | modeM0/AS1T01_207T01_9000001720_11674cztM0_level2.evt | modeM0/AS1T01_207T01_9000001720_11674cztM0_level2_quad_clean.evt |
| Size (bytes) | 86,682,240 | 14,201,280 |
| Size | 82.7 MB | 13.5 MB |
| Events in quadrant A | 842,937 | 84,933 |
| Events in quadrant B | 560,627 | 89,098 |
| Events in quadrant C | 546,148 | 86,622 |
| Events in quadrant D | 596,327 | 83,460 |
| Mode M0 | |||
|---|---|---|---|
| Quadrant | BADHDUFLAG | Total packets | Discarded packets |
| A | 0 | 3283 | 1 |
| B | 0 | 2299 | 0 |
| C | 0 | 2265 | 0 |
| D | 0 | 2367 | 0 |
| Mode SS | |||
|---|---|---|---|
| Quadrant | BADHDUFLAG | Total packets | Discarded packets |
| A | 0 | 22 | 0 |
| B | 0 | 22 | 0 |
| C | 0 | 22 | 0 |
| D | 0 | 22 | 0 |
| Quadrant | Total seconds | Saturated seconds | Saturation percentage |
|---|---|---|---|
| A | 1122 | 62 | 5.525847% |
| B | 1122 | 2 | 0.178253% |
| C | 1122 | 1 | 0.089127% |
| D | 1122 | 0 | 0.000000% |
Noise dominated data is calculated using 1-second bins in cleaned event files. If a bin has >2000 counts, and if more than 50% of those come from <1% of pixels, then it is considered to be noise-dominated and hence unusable.
| Quadrant | # 1 sec bins | Bins with >0 counts | Bins with >2000 counts | High rate bins dominated by noise | Noise dominated (total time) | Noise dominated (detector-on time) | Marked lightcurve |
|---|---|---|---|---|---|---|---|
| A | 1123 | 1123 | 43 | 43 | 3.83% | 3.83% | 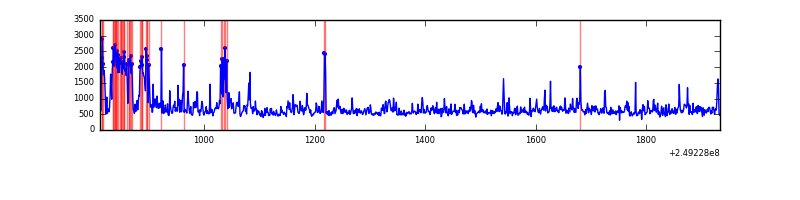 |
| B | 1123 | 1123 | 0 | 0 | 0.00% | 0.00% | 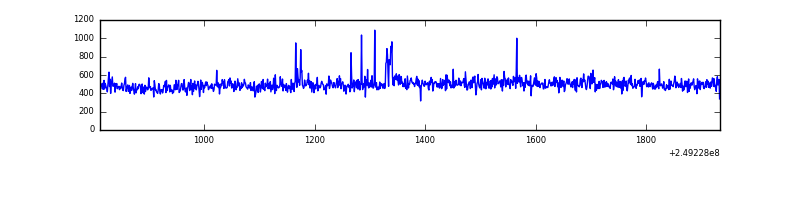 |
| C | 1123 | 1123 | 0 | 0 | 0.00% | 0.00% | 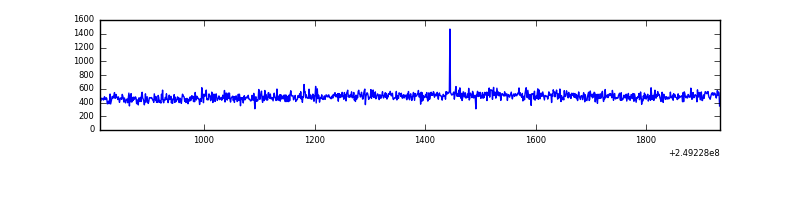 |
| D | 1123 | 1123 | 1 | 1 | 0.09% | 0.09% | 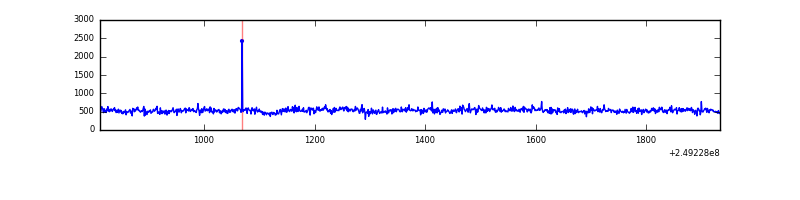 |
Top three noisy pixels from each quadrant. If the there are fewer than three noisy pixels in the level2.evt file, extra rows are filled as -1
| Pixel properties | Quadrant properties | ||||||
|---|---|---|---|---|---|---|---|
| Quadrant | DetID | PixID | Counts | Sigma | Mean | Median | Sigma |
| A | 8 | 5 | 202426 | 6737.31 | 136 | 133 | 30.0 |
| A | 1 | 162 | 43470 | 1443.33 | 136 | 133 | 30.0 |
| A | 1 | 178 | 24306 | 805.08 | 136 | 133 | 30.0 |
| B | 3 | 64 | 11255 | 383.16 | 139 | 135 | 29.0 |
| B | 15 | 204 | 4181 | 139.41 | 139 | 135 | 29.0 |
| B | 12 | 111 | 3245 | 107.16 | 139 | 135 | 29.0 |
| C | 14 | 234 | 2023 | 55.07 | 139 | 139 | 34.2 |
| C | 13 | 61 | 1007 | 25.37 | 139 | 139 | 34.2 |
| C | 3 | 202 | 414 | 8.04 | 139 | 139 | 34.2 |
| D | 8 | 195 | 57534 | 1635.72 | 137 | 133 | 35.1 |
| D | 13 | 137 | 9606 | 269.95 | 137 | 133 | 35.1 |
| D | 10 | 157 | 6992 | 195.46 | 137 | 133 | 35.1 |
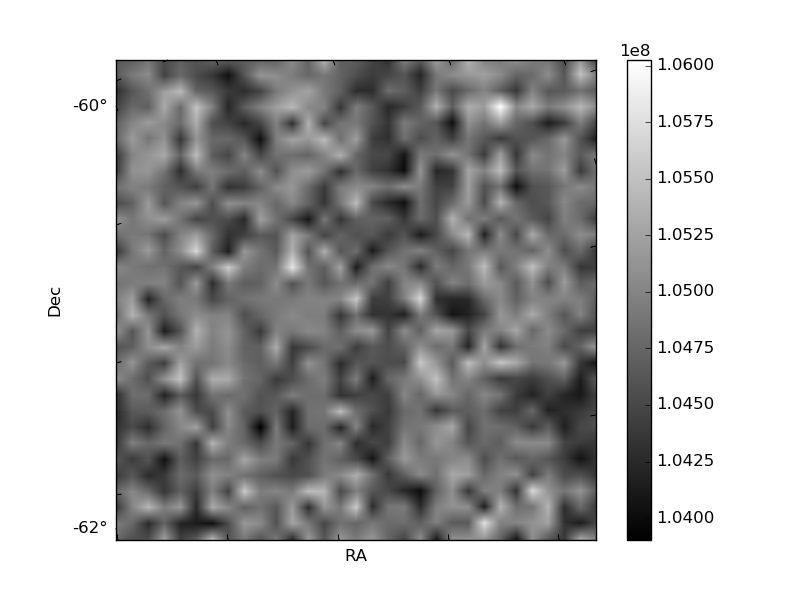
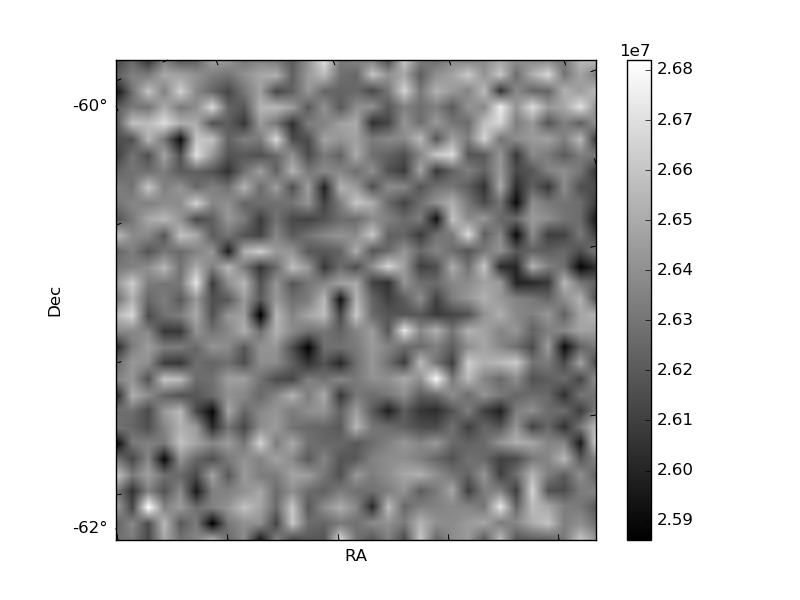
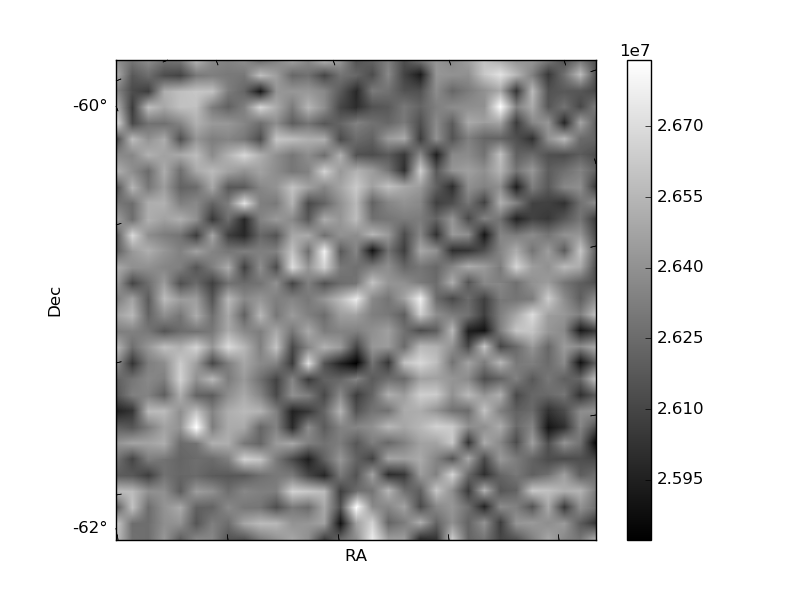
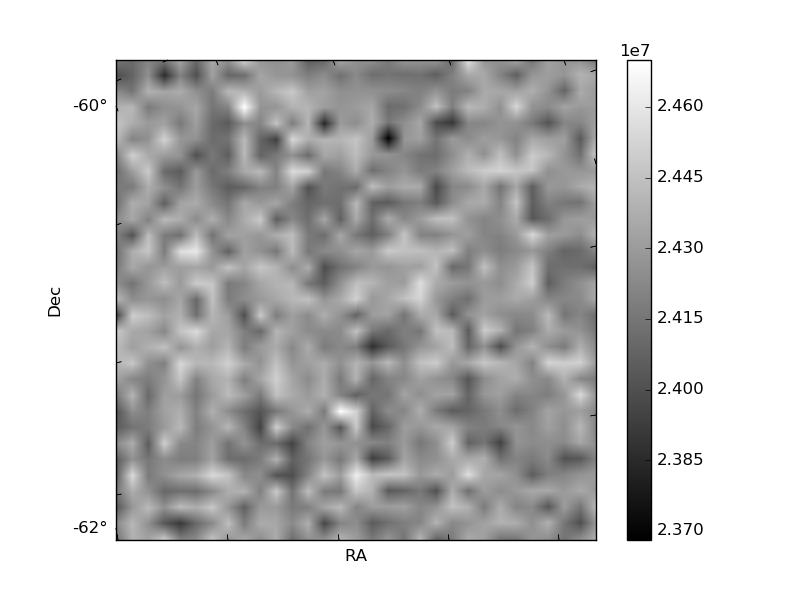
Histogram calculated using DETX and DETY for each event in the final _common_clean file
| Quadrant A | 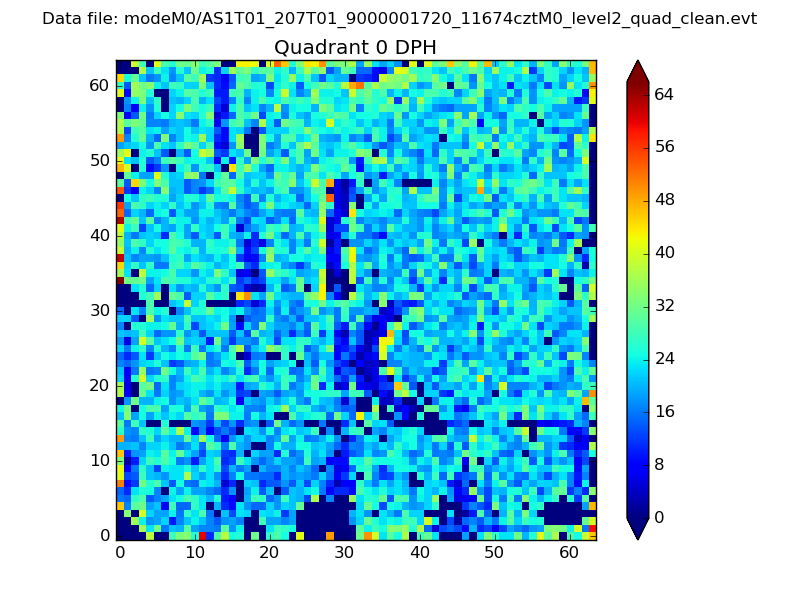 |
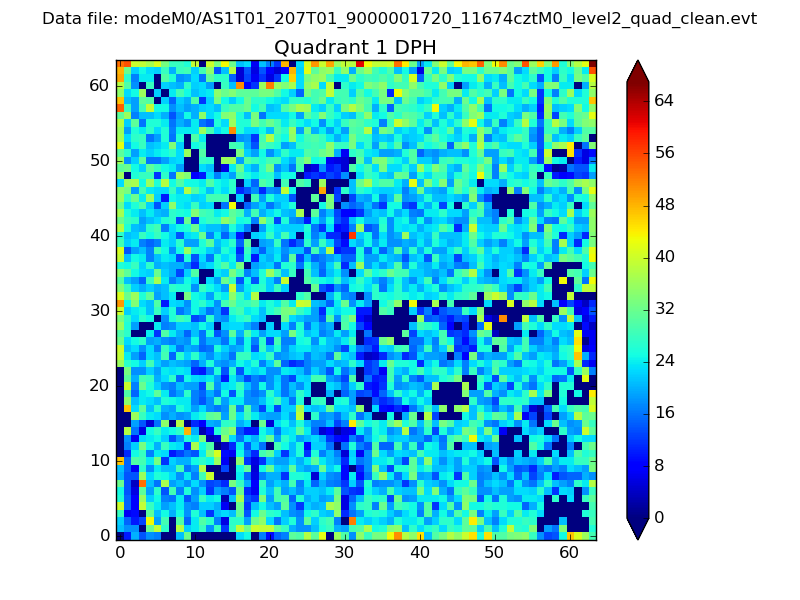 |
Quadrant B |
|---|---|---|---|
| Quadrant D | 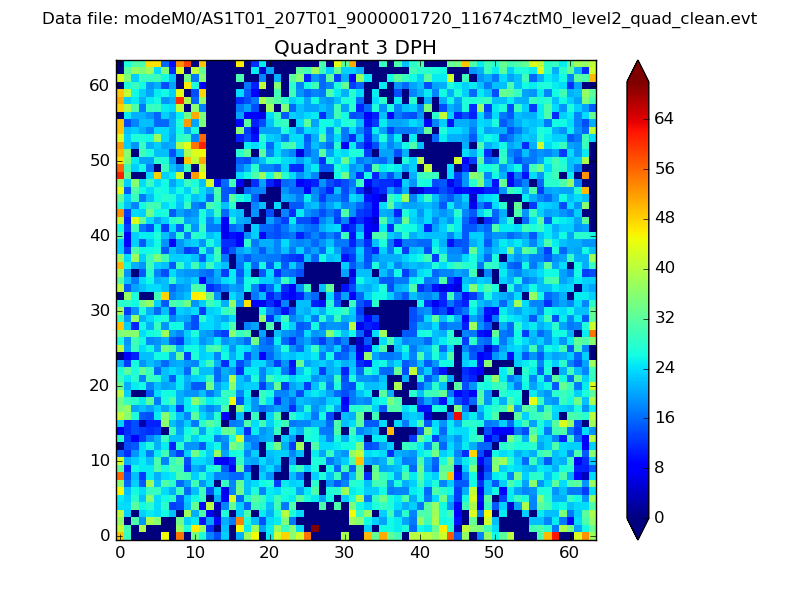 |
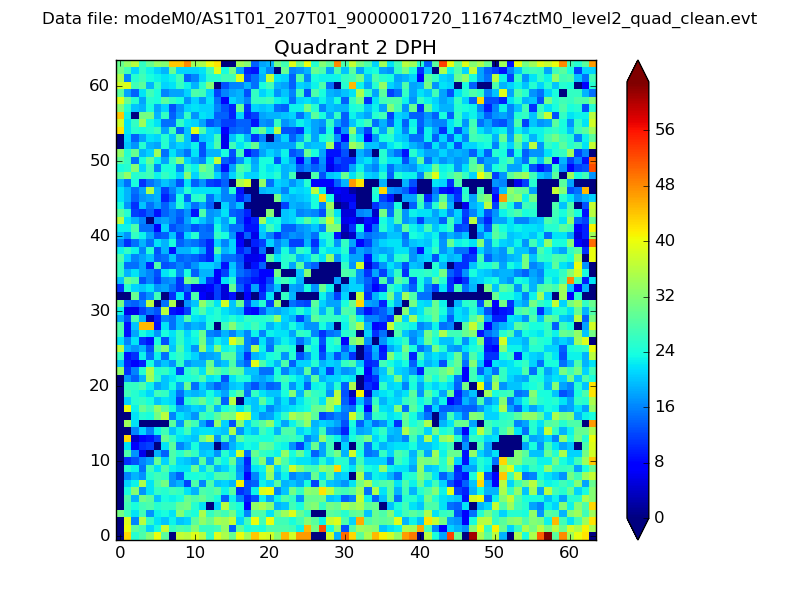 |
Quadrant C |
| Plot type | Count rate plots | Images |
|---|---|---|
| Comparison with Poisson distribution Blue bars denote a histogram of data divided into 1 sec bins. Red curve is a Poisson curve with rate = median count rate of data. |
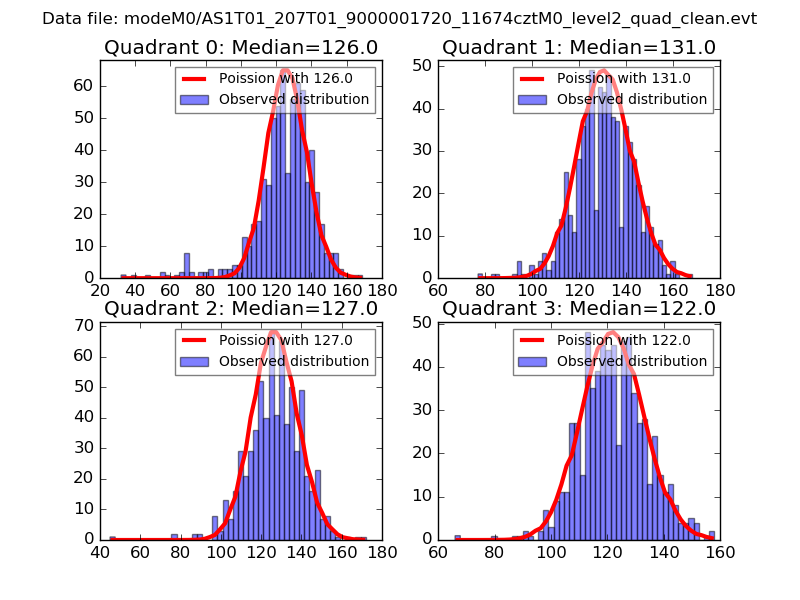 |
 |
| Quadrant-wise count rates Data is divided into 100 sec bins |
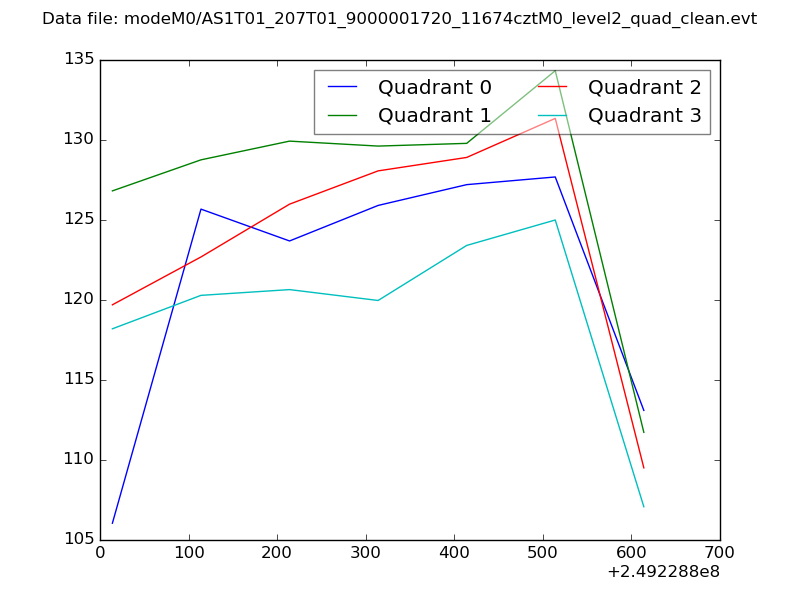 |
|
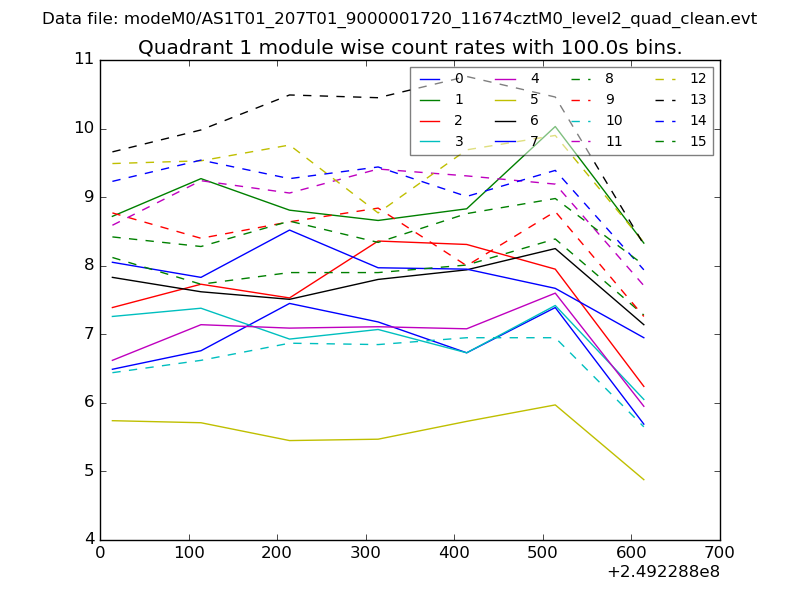
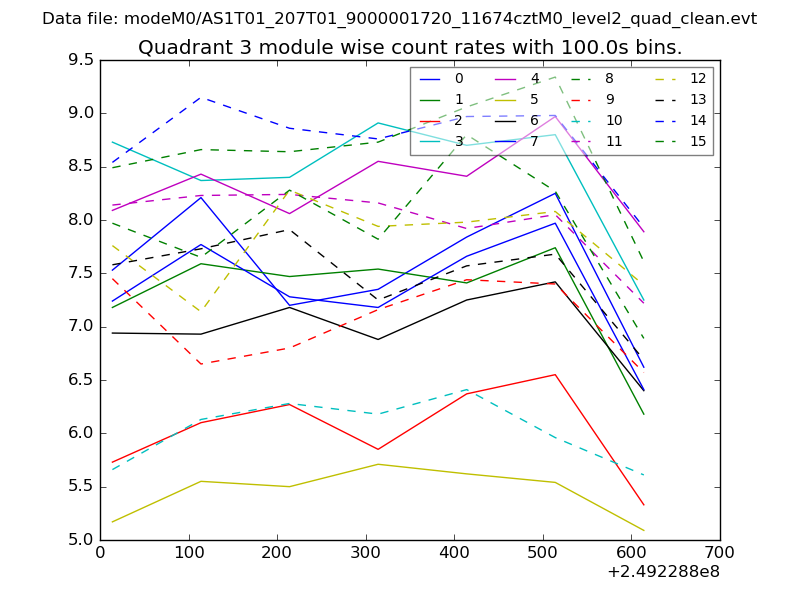
| Module-wise count rates for Quadrant A Data is divided into 100 sec bins |
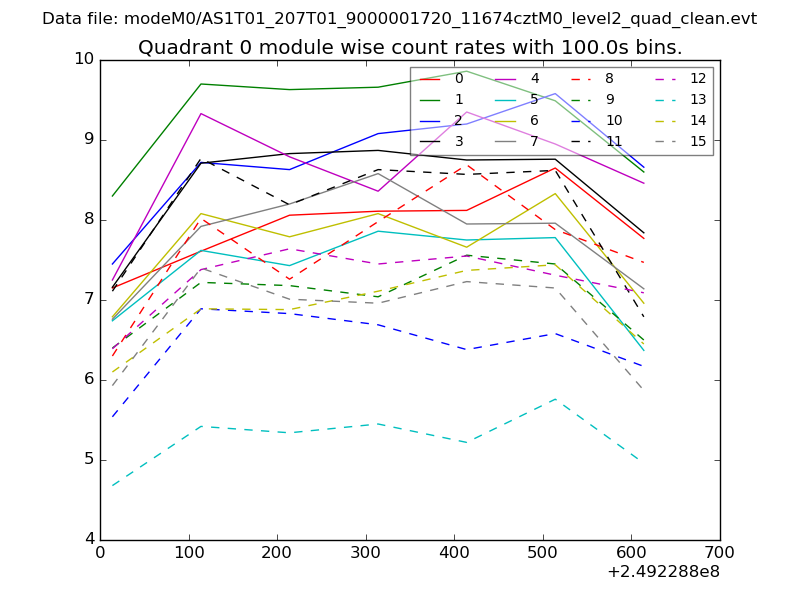 |
 |
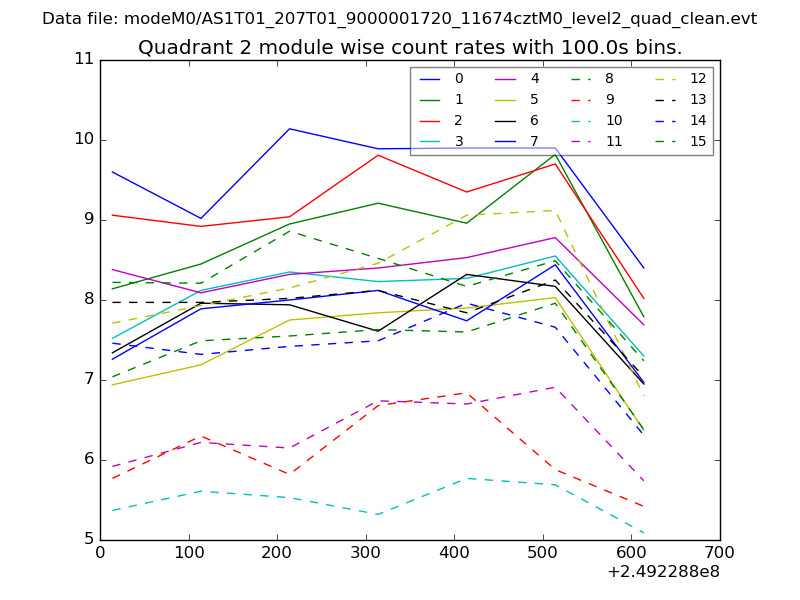
| Module-wise count rates for Quadrant B Data is divided into 100 sec bins |
 |
 |
| Module-wise count rates for Quadrant C Data is divided into 100 sec bins |
 |
 |
| Module-wise count rates for Quadrant D Data is divided into 100 sec bins |
 |
 |
| Parameter | Plot |
|---|---|
| CZT HV Monitor | 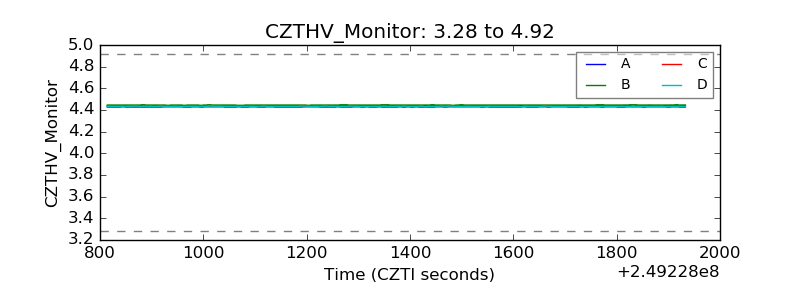 |
| D_VDD | 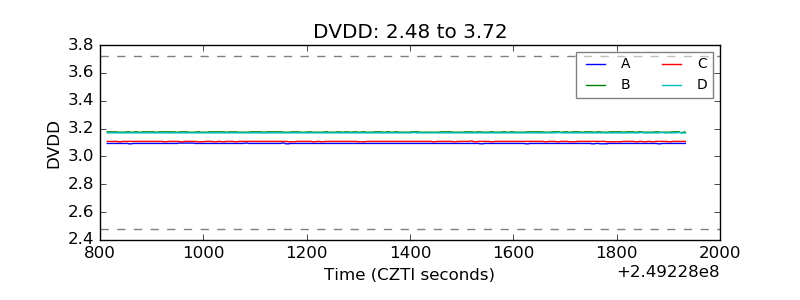 |
| Temperature 1 | 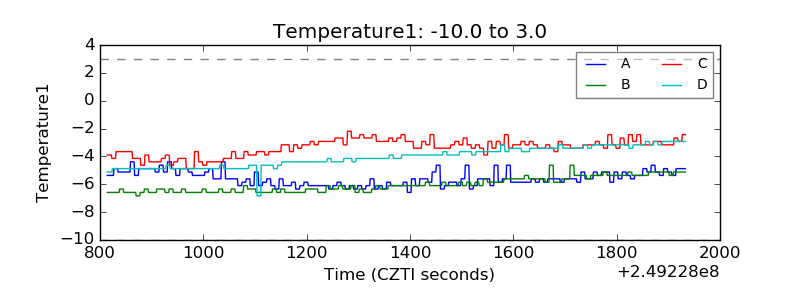 |
| Veto HV Monitor | 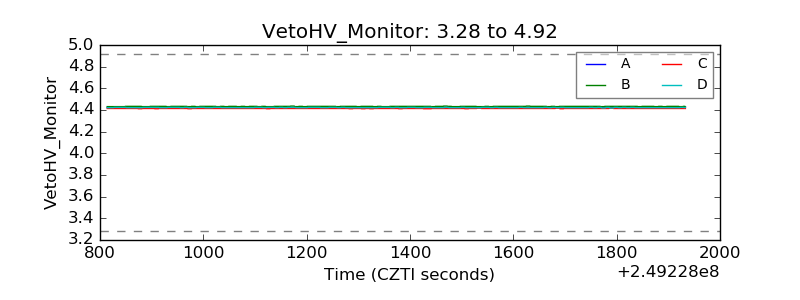 |
| Veto LLD | 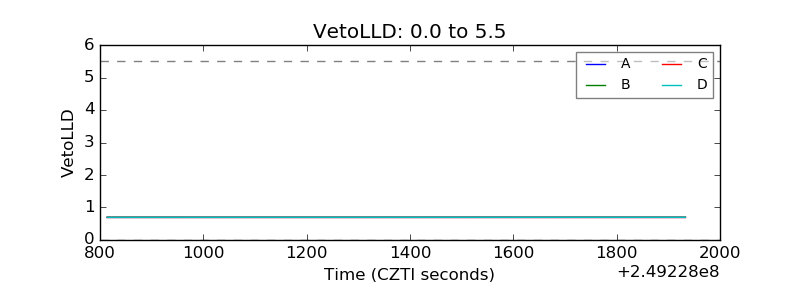 |
| Alpha Counter | 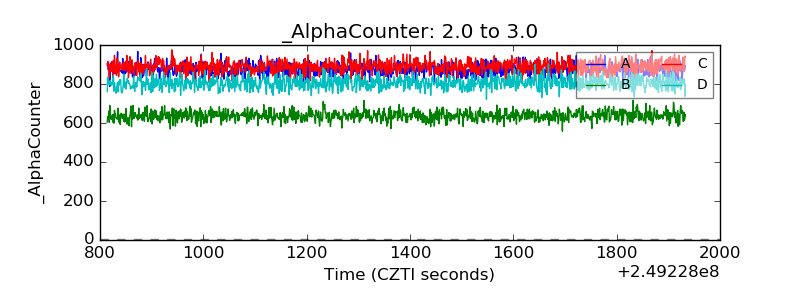 |
| _CPM_Rate | 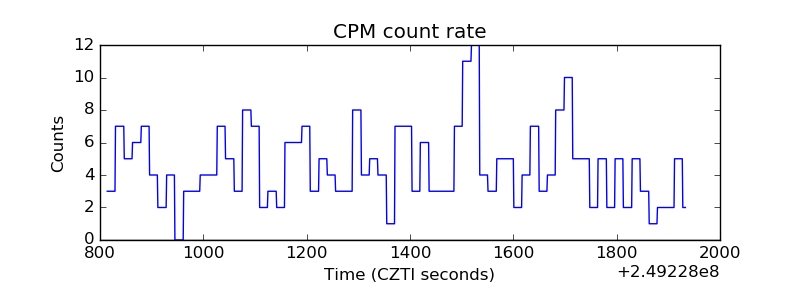 |
| CZT Counter | 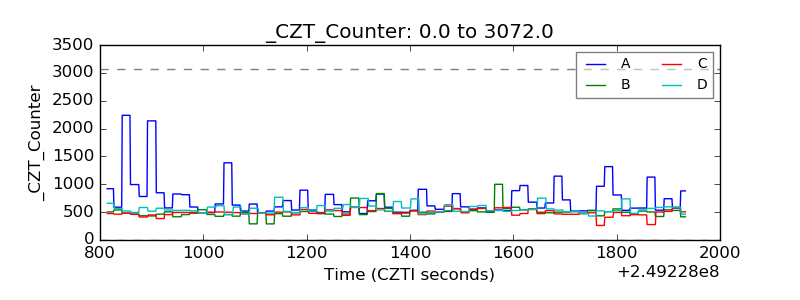 |
| +2.5 Volts monitor |  |
| +5 Volts monitor |  |
| _ROLL_ROT | 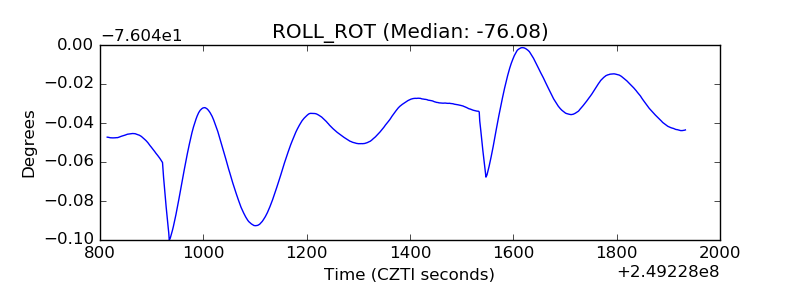 |
| _Roll_DEC | 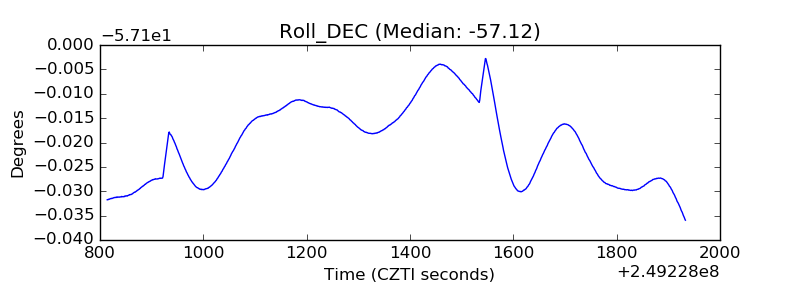 |
| _Roll_RA | 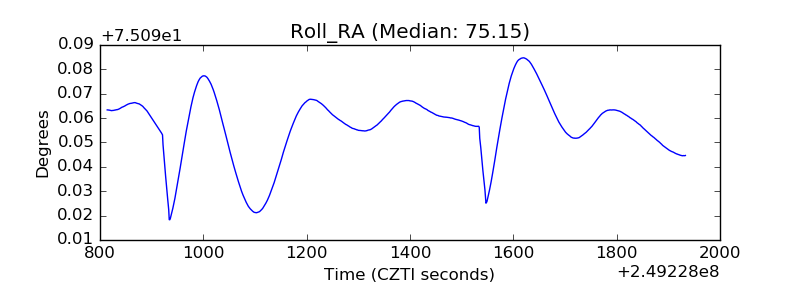 |
| Veto Counter | 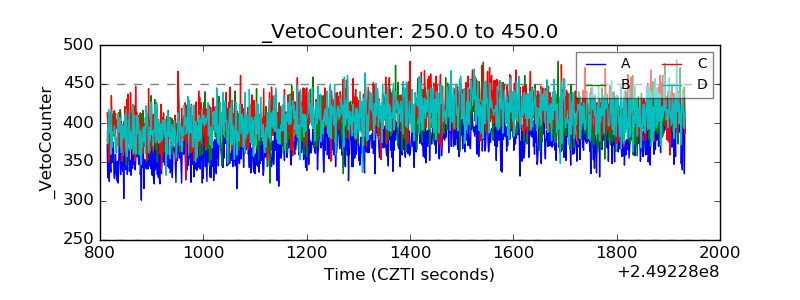 |