| Param | Original file | Final file |
|---|---|---|
| Filename | modeM0/AS1T01_207T01_9000001720_11675cztM0_level2.evt | modeM0/AS1T01_207T01_9000001720_11675cztM0_level2_quad_clean.evt |
| Size (bytes) | 1,610,956,800 | 252,126,720 |
| Size | 1.5 GB | 240.4 MB |
| Events in quadrant A | 14,196,134 | 1,565,095 |
| Events in quadrant B | 12,362,456 | 1,586,335 |
| Events in quadrant C | 9,091,961 | 1,580,774 |
| Events in quadrant D | 11,770,472 | 1,508,967 |
| Mode M0 | |||
|---|---|---|---|
| Quadrant | BADHDUFLAG | Total packets | Discarded packets |
| A | 0 | 56172 | 5 |
| B | 0 | 50262 | 5 |
| C | 0 | 41521 | 5 |
| D | 0 | 48724 | 5 |
| Mode M9 | |||
|---|---|---|---|
| Quadrant | BADHDUFLAG | Total packets | Discarded packets |
| A | 0 | 13 | 0 |
| B | 0 | 13 | 0 |
| C | 0 | 13 | 0 |
| D | 0 | 13 | 0 |
| Mode SS | |||
|---|---|---|---|
| Quadrant | BADHDUFLAG | Total packets | Discarded packets |
| A | 0 | 414 | 0 |
| B | 0 | 414 | 0 |
| C | 0 | 414 | 0 |
| D | 0 | 414 | 0 |
| Quadrant | Total seconds | Saturated seconds | Saturation percentage |
|---|---|---|---|
| A | 20243 | 1097 | 5.419157% |
| B | 20243 | 1122 | 5.542657% |
| C | 20243 | 169 | 0.834856% |
| D | 20243 | 652 | 3.220866% |
Noise dominated data is calculated using 1-second bins in cleaned event files. If a bin has >2000 counts, and if more than 50% of those come from <1% of pixels, then it is considered to be noise-dominated and hence unusable.
| Quadrant | # 1 sec bins | Bins with >0 counts | Bins with >2000 counts | High rate bins dominated by noise | Noise dominated (total time) | Noise dominated (detector-on time) | Marked lightcurve |
|---|---|---|---|---|---|---|---|
| A | 21654 | 20251 | 322 | 322 | 1.49% | 1.59% | 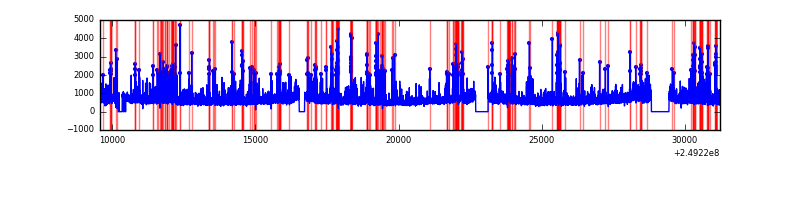 |
| B | 21654 | 20251 | 327 | 327 | 1.51% | 1.61% | 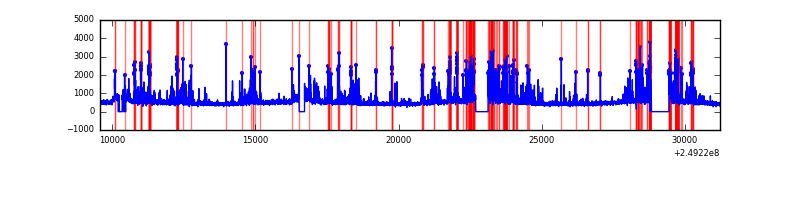 |
| C | 21654 | 20251 | 0 | 0 | 0.00% | 0.00% | 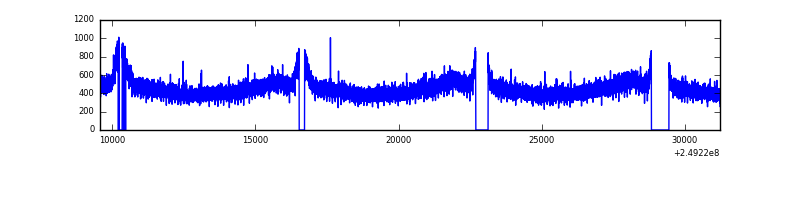 |
| D | 21654 | 20250 | 393 | 393 | 1.81% | 1.94% | 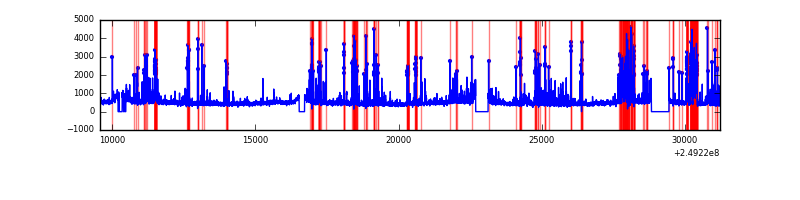 |
Top three noisy pixels from each quadrant. If the there are fewer than three noisy pixels in the level2.evt file, extra rows are filled as -1
| Pixel properties | Quadrant properties | ||||||
|---|---|---|---|---|---|---|---|
| Quadrant | DetID | PixID | Counts | Sigma | Mean | Median | Sigma |
| A | 8 | 5 | 3090576 | 6418.88 | 2361 | 2313 | 481.1 |
| A | 1 | 162 | 746957 | 1547.72 | 2361 | 2313 | 481.1 |
| A | 1 | 178 | 437407 | 904.33 | 2361 | 2313 | 481.1 |
| B | 4 | 239 | 2050026 | 4545.88 | 2362 | 2302 | 450.5 |
| B | 3 | 64 | 493396 | 1090.21 | 2362 | 2302 | 450.5 |
| B | 15 | 204 | 360298 | 794.74 | 2362 | 2302 | 450.5 |
| C | 13 | 61 | 17206 | 27.75 | 2331 | 2336 | 535.9 |
| C | 12 | 4 | 6023 | 6.88 | 2331 | 2336 | 535.9 |
| C | 3 | 202 | 5866 | 6.59 | 2331 | 2336 | 535.9 |
| D | 13 | 104 | 1720370 | 3121.57 | 2294 | 2230 | 550.4 |
| D | 8 | 195 | 511579 | 925.4 | 2294 | 2230 | 550.4 |
| D | 1 | 52 | 348576 | 629.25 | 2294 | 2230 | 550.4 |
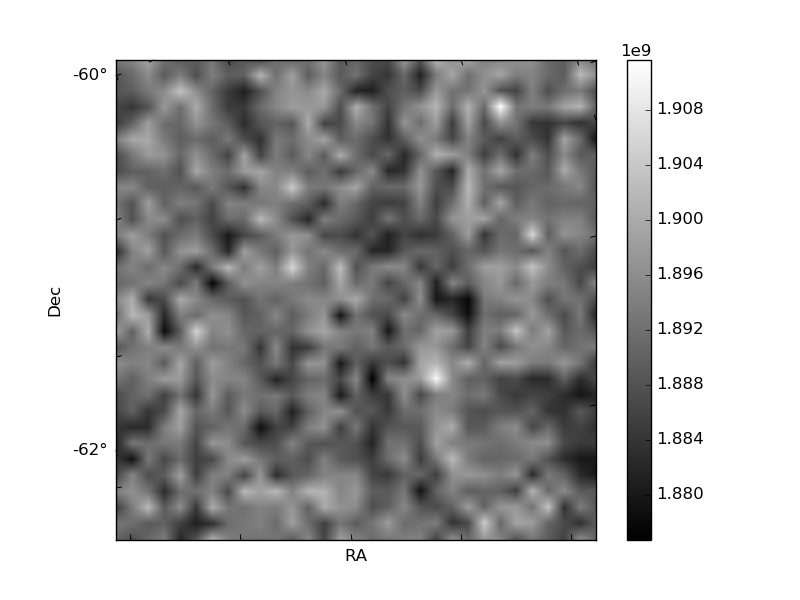
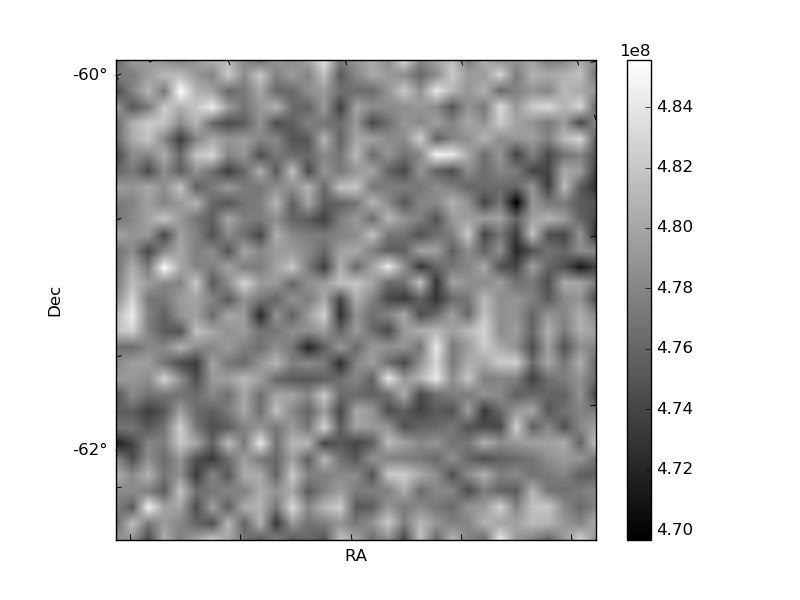
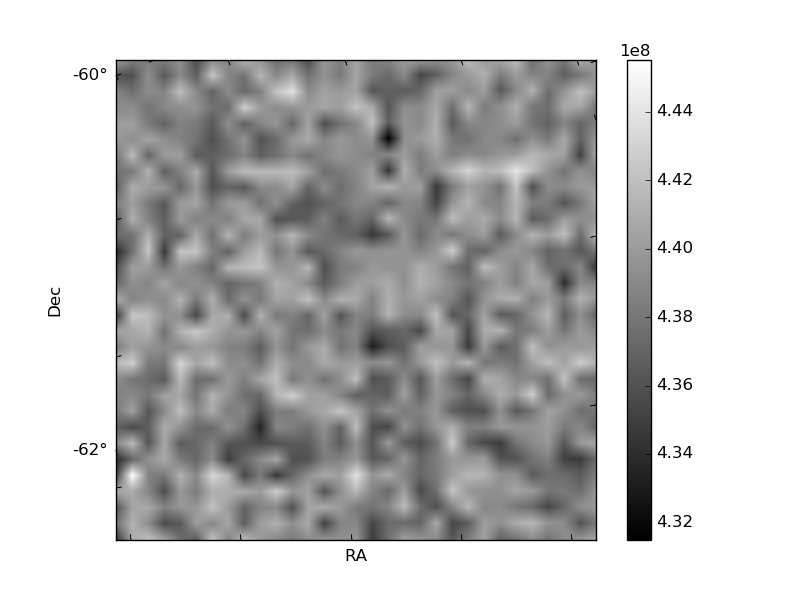
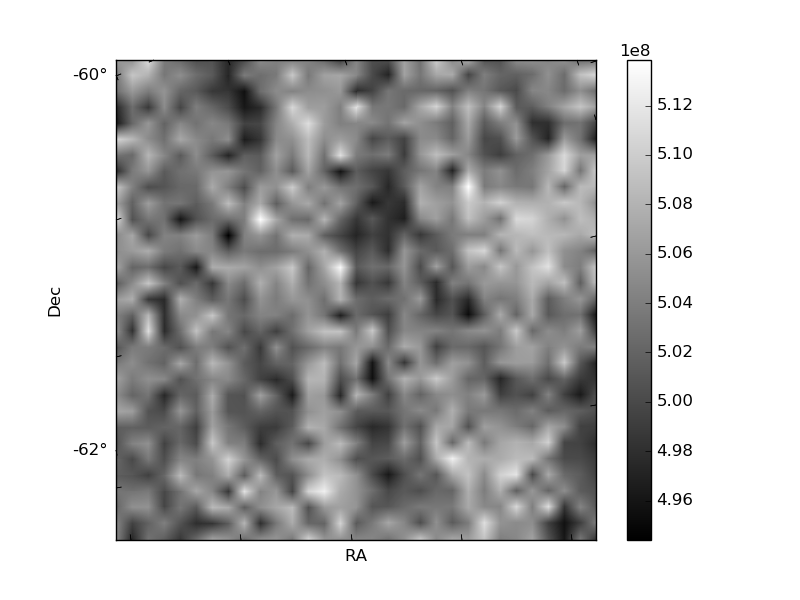
Histogram calculated using DETX and DETY for each event in the final _common_clean file
| Quadrant A | 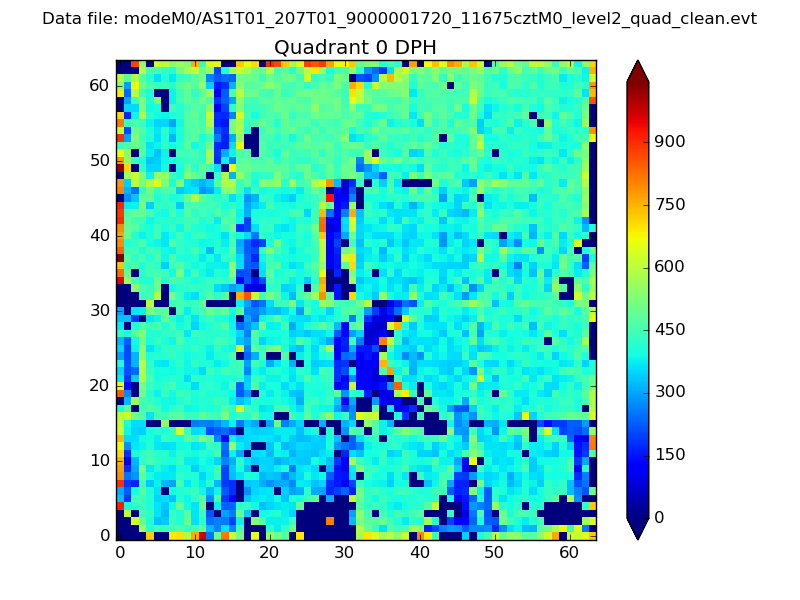 |
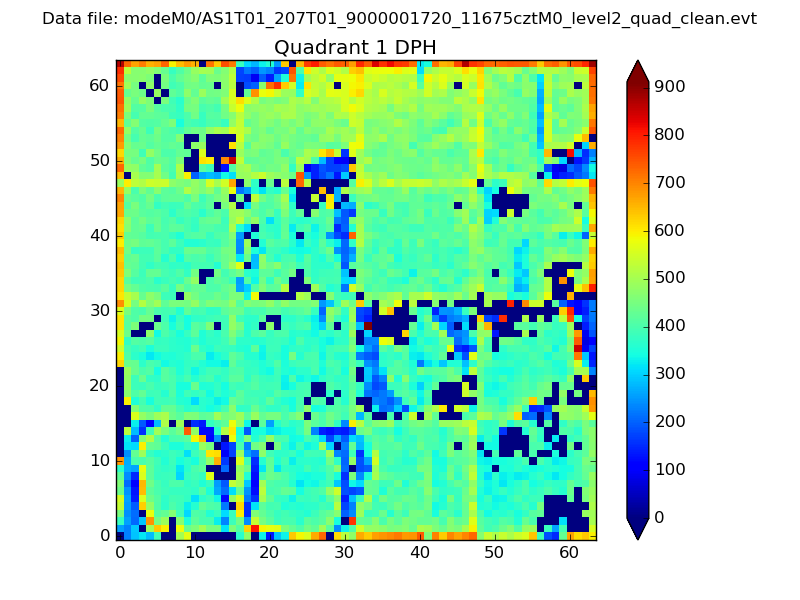 |
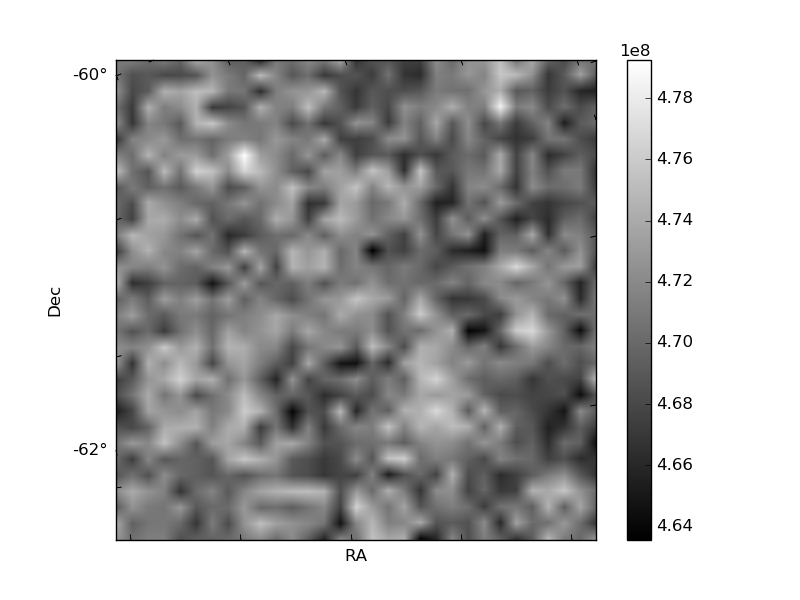
Quadrant B |
|---|---|---|---|
| Quadrant D | 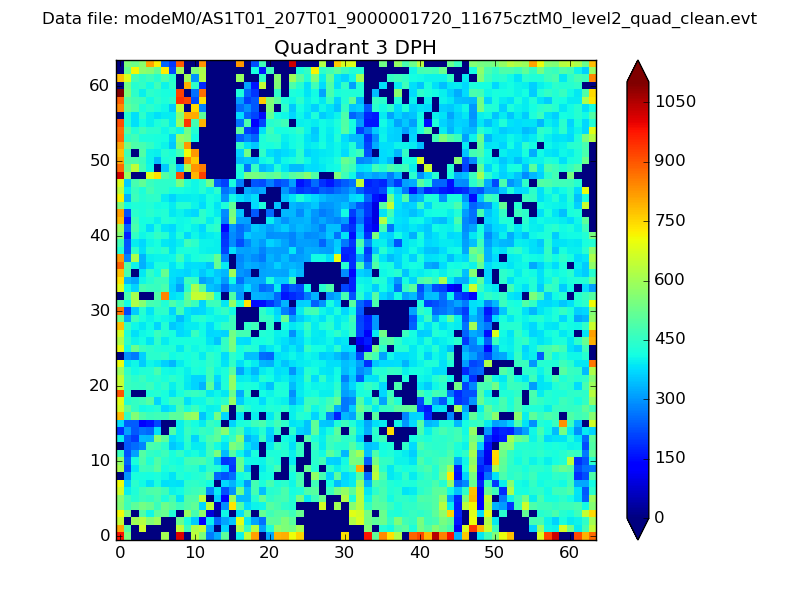 |
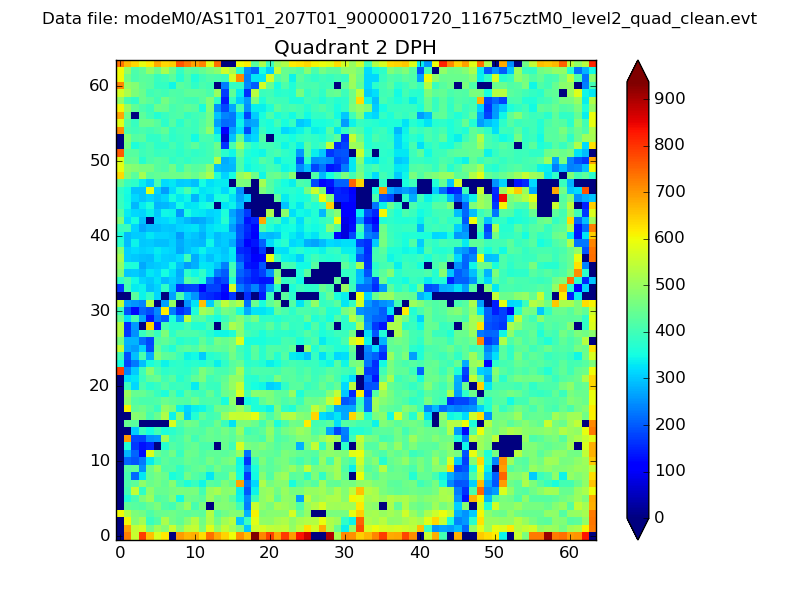 |
Quadrant C |
| Plot type | Count rate plots | Images |
|---|---|---|
| Comparison with Poisson distribution Blue bars denote a histogram of data divided into 1 sec bins. Red curve is a Poisson curve with rate = median count rate of data. |
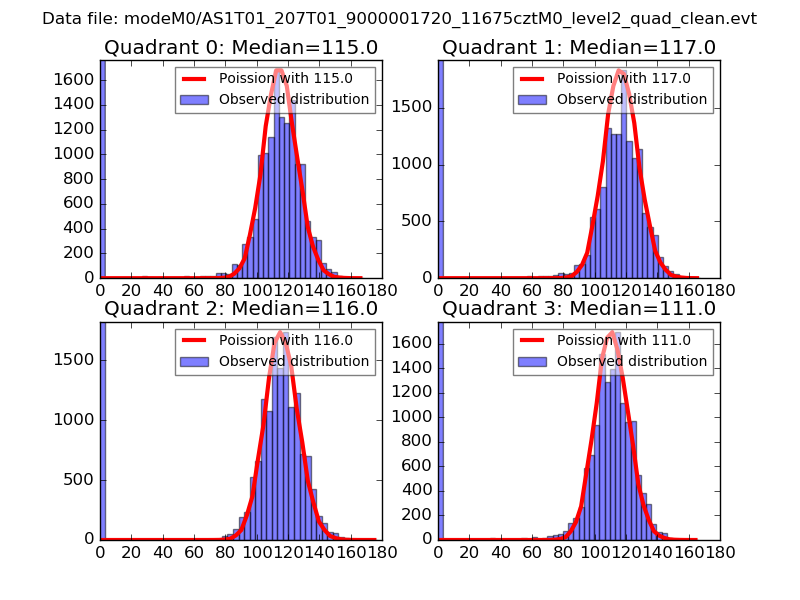 |
 |
| Quadrant-wise count rates Data is divided into 100 sec bins |
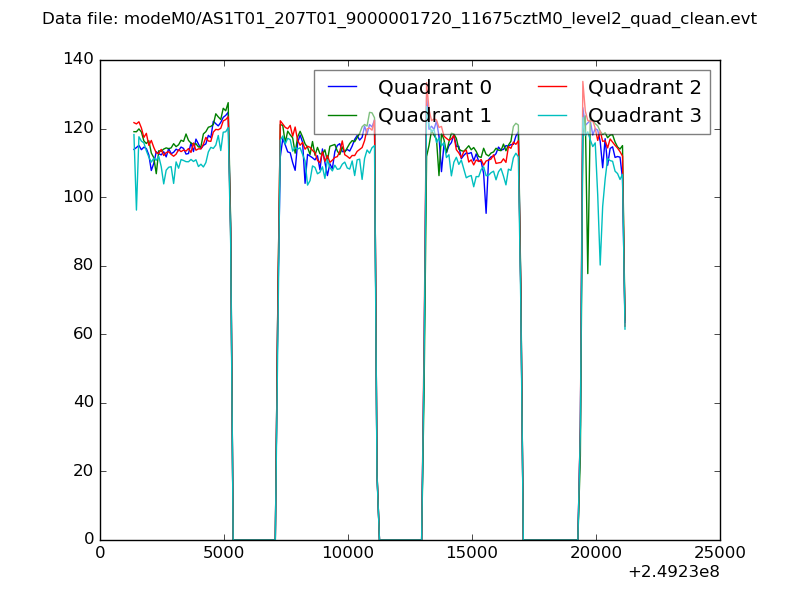 |
|
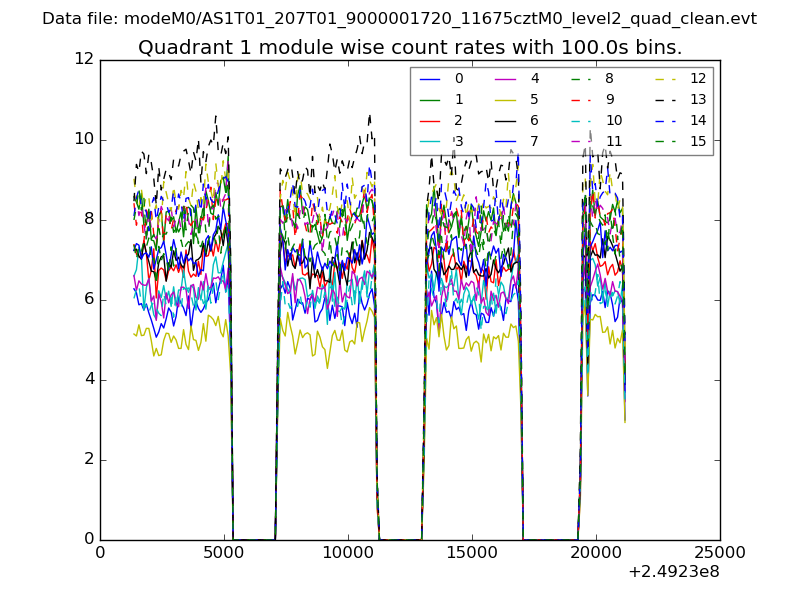
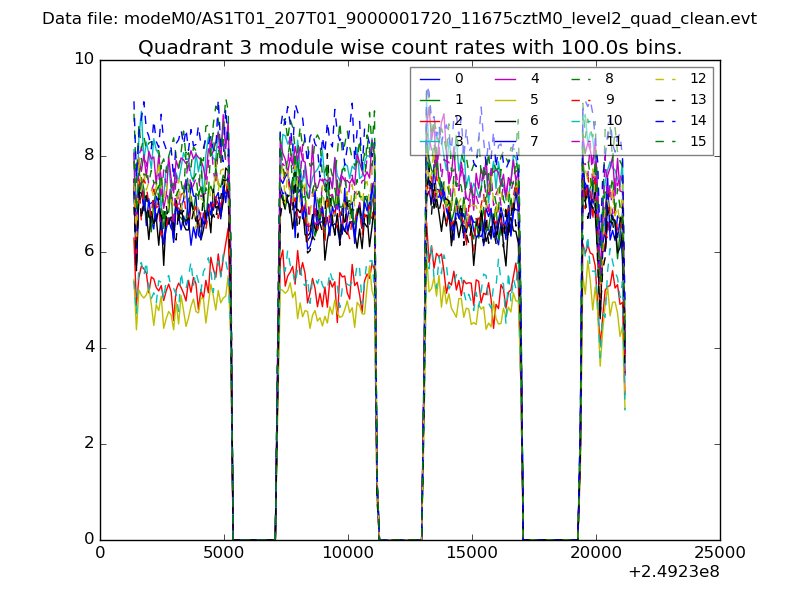
| Module-wise count rates for Quadrant A Data is divided into 100 sec bins |
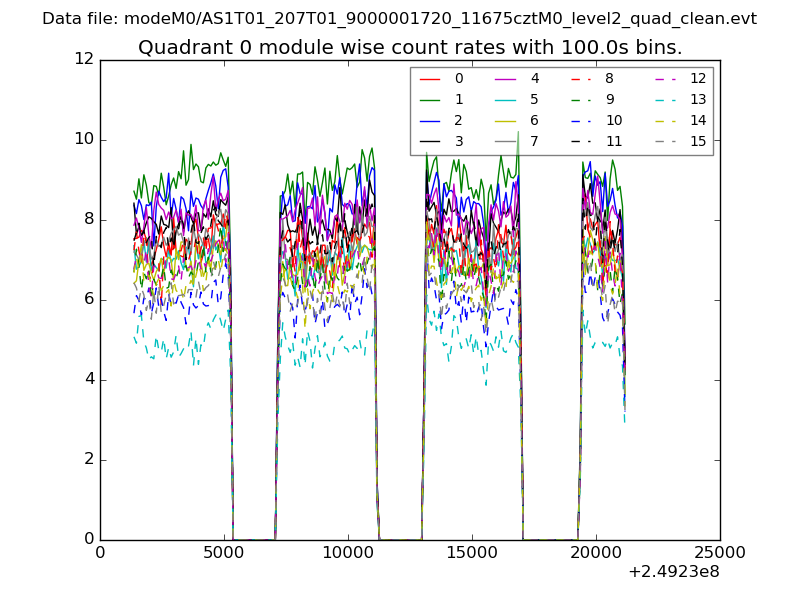 |
 |
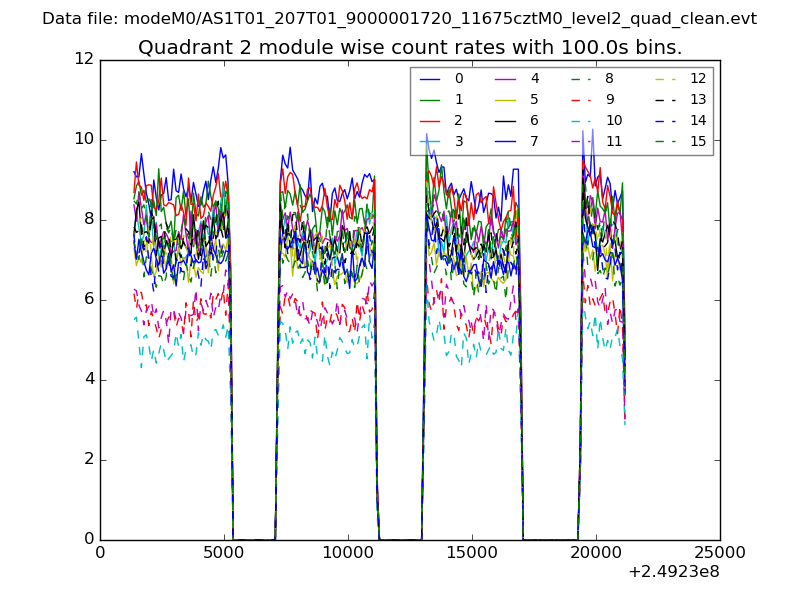
| Module-wise count rates for Quadrant B Data is divided into 100 sec bins |
 |
 |
| Module-wise count rates for Quadrant C Data is divided into 100 sec bins |
 |
 |
| Module-wise count rates for Quadrant D Data is divided into 100 sec bins |
 |
 |
| Parameter | Plot |
|---|---|
| CZT HV Monitor | 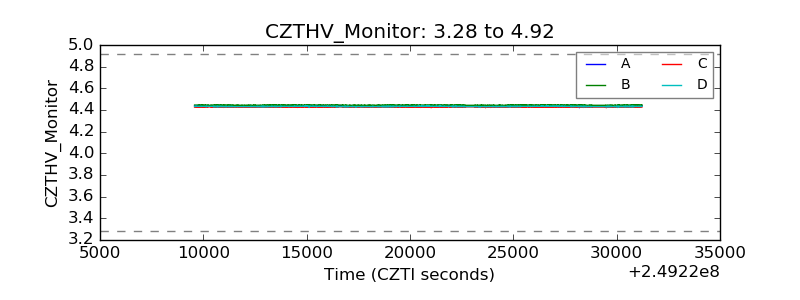 |
| D_VDD | 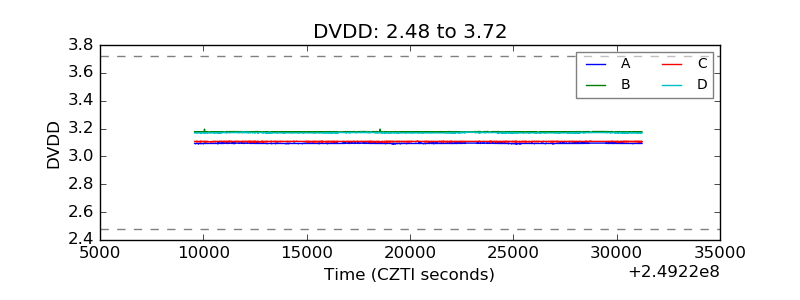 |
| Temperature 1 | 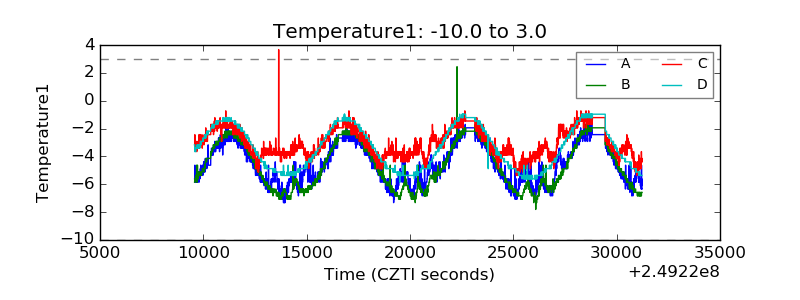 |
| Veto HV Monitor |  |
| Veto LLD | 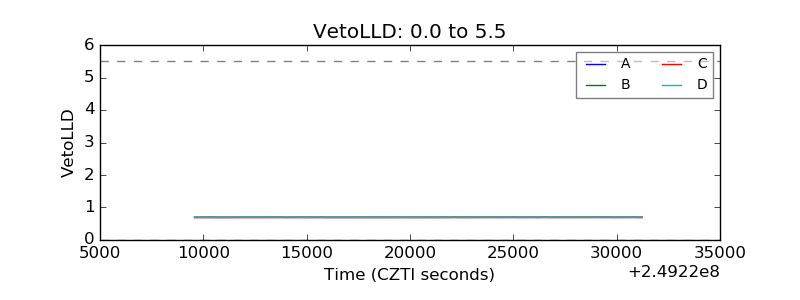 |
| Alpha Counter | 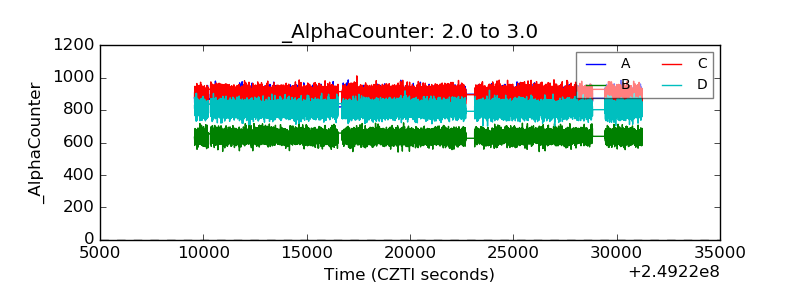 |
| _CPM_Rate | 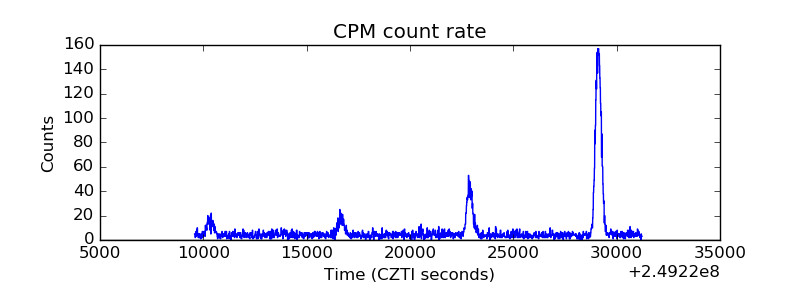 |
| CZT Counter | 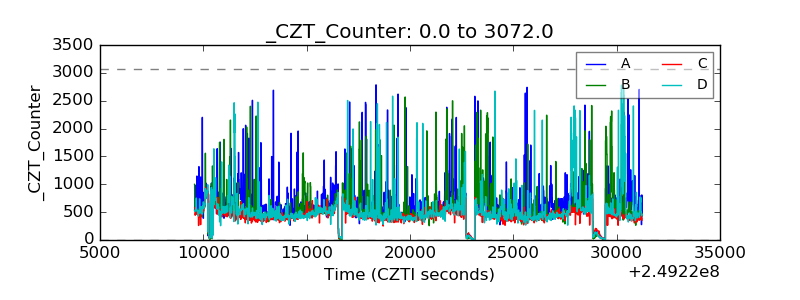 |
| +2.5 Volts monitor |  |
| +5 Volts monitor | 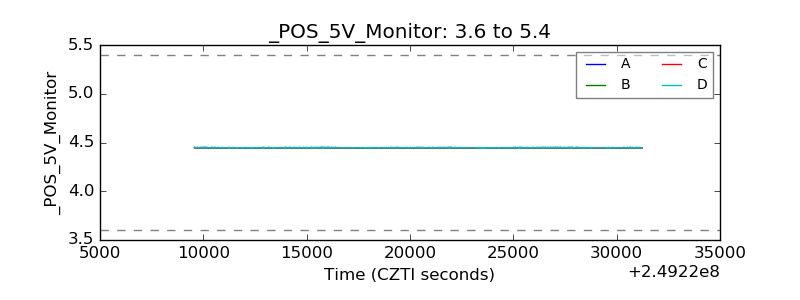 |
| _ROLL_ROT | 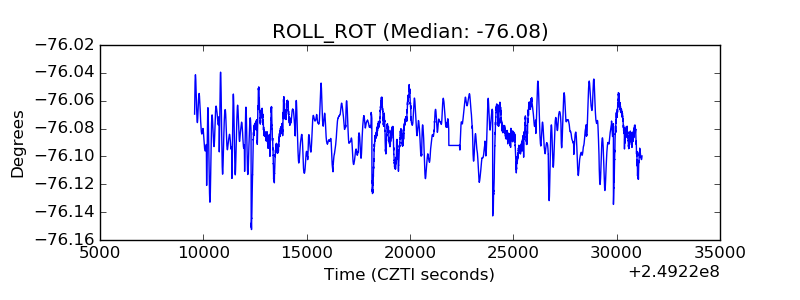 |
| _Roll_DEC | 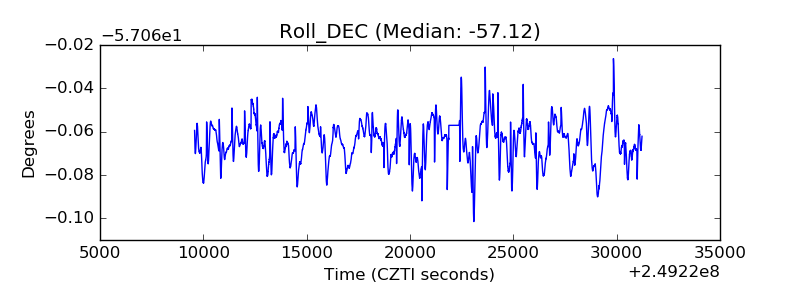 |
| _Roll_RA | 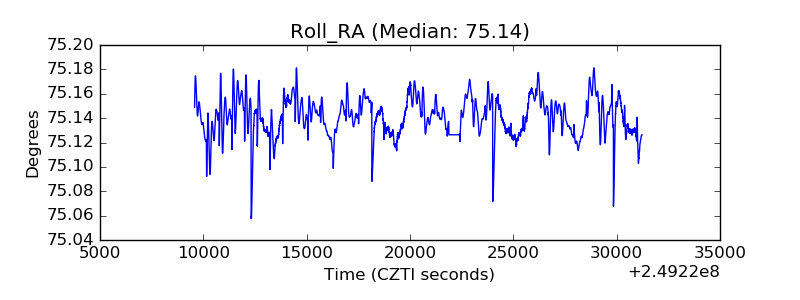 |
| Veto Counter | 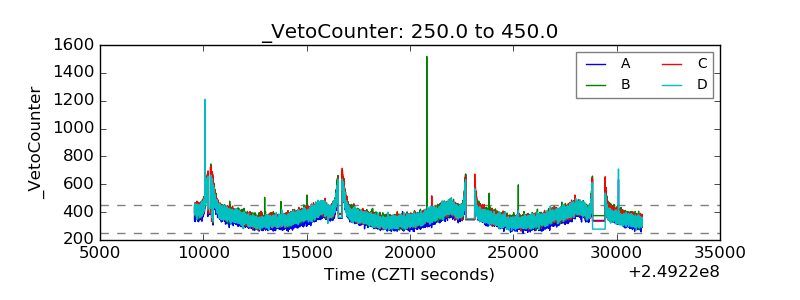 |