| Param | Original file | Final file |
|---|---|---|
| Filename | modeM0/AS1A04_227T01_9000001724_11685cztM0_level2.evt | modeM0/AS1A04_227T01_9000001724_11685cztM0_level2_quad_clean.evt |
| Size (bytes) | 357,163,200 | 34,672,320 |
| Size | 340.6 MB | 33.1 MB |
| Events in quadrant A | 2,964,061 | 190,150 |
| Events in quadrant B | 2,447,800 | 194,437 |
| Events in quadrant C | 2,007,562 | 202,485 |
| Events in quadrant D | 3,131,340 | 186,514 |
| Mode M0 | |||
|---|---|---|---|
| Quadrant | BADHDUFLAG | Total packets | Discarded packets |
| A | 0 | 11520 | 2 |
| B | 0 | 9676 | 1 |
| C | 0 | 8435 | 1 |
| D | 0 | 11886 | 1 |
| Mode SS | |||
|---|---|---|---|
| Quadrant | BADHDUFLAG | Total packets | Discarded packets |
| A | 0 | 78 | 0 |
| B | 0 | 78 | 0 |
| C | 0 | 78 | 0 |
| D | 0 | 78 | 0 |
| Mode M9 | |||
|---|---|---|---|
| Quadrant | BADHDUFLAG | Total packets | Discarded packets |
| A | 0 | 1 | 0 |
| B | 0 | 1 | 0 |
| C | 0 | 1 | 0 |
| D | 0 | 1 | 0 |
| Quadrant | Total seconds | Saturated seconds | Saturation percentage |
|---|---|---|---|
| A | 3911 | 366 | 9.358220% |
| B | 3911 | 345 | 8.821273% |
| C | 3911 | 91 | 2.326771% |
| D | 3911 | 219 | 5.599591% |
Noise dominated data is calculated using 1-second bins in cleaned event files. If a bin has >2000 counts, and if more than 50% of those come from <1% of pixels, then it is considered to be noise-dominated and hence unusable.
| Quadrant | # 1 sec bins | Bins with >0 counts | Bins with >2000 counts | High rate bins dominated by noise | Noise dominated (total time) | Noise dominated (detector-on time) | Marked lightcurve |
|---|---|---|---|---|---|---|---|
| A | 3952 | 3913 | 44 | 44 | 1.11% | 1.12% | 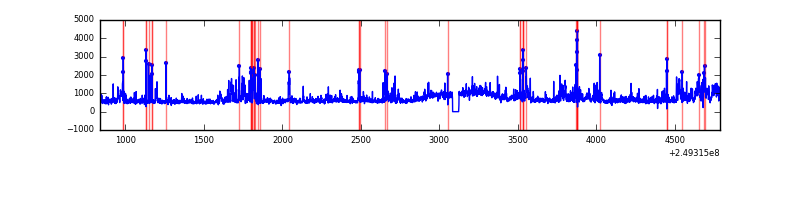 |
| B | 3952 | 3913 | 34 | 34 | 0.86% | 0.87% | 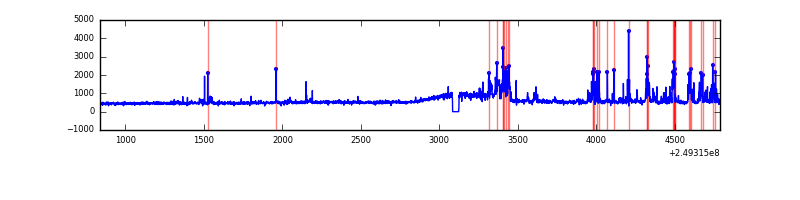 |
| C | 3952 | 3913 | 0 | 0 | 0.00% | 0.00% | 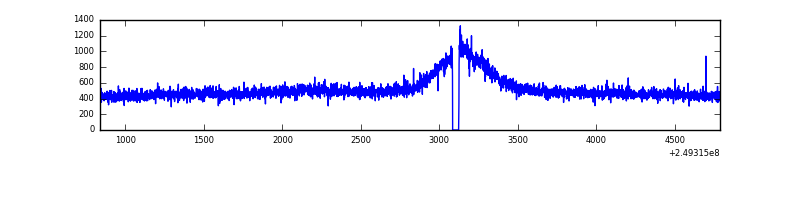 |
| D | 3952 | 3913 | 82 | 82 | 2.07% | 2.10% | 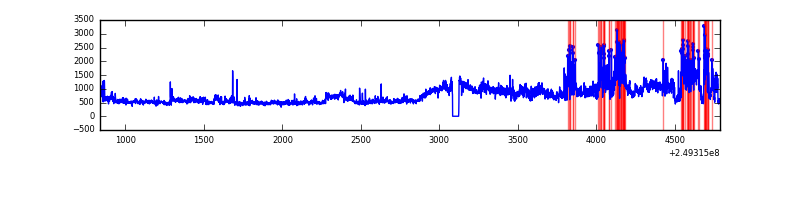 |
Top three noisy pixels from each quadrant. If the there are fewer than three noisy pixels in the level2.evt file, extra rows are filled as -1
| Pixel properties | Quadrant properties | ||||||
|---|---|---|---|---|---|---|---|
| Quadrant | DetID | PixID | Counts | Sigma | Mean | Median | Sigma |
| A | 8 | 5 | 699744 | 6516.97 | 510 | 497 | 107.3 |
| A | 1 | 162 | 116138 | 1077.77 | 510 | 497 | 107.3 |
| A | 1 | 178 | 62698 | 579.71 | 510 | 497 | 107.3 |
| B | 4 | 239 | 333237 | 3241.42 | 511 | 498 | 102.7 |
| B | 15 | 204 | 54973 | 530.68 | 511 | 498 | 102.7 |
| B | 3 | 64 | 15089 | 142.14 | 511 | 498 | 102.7 |
| C | 8 | 112 | 18845 | 151.49 | 509 | 511 | 121.0 |
| C | 13 | 61 | 3855 | 27.63 | 509 | 511 | 121.0 |
| C | 8 | 128 | 3693 | 26.29 | 509 | 511 | 121.0 |
| D | 13 | 152 | 684310 | 5563.36 | 501 | 486 | 122.9 |
| D | 7 | 80 | 316609 | 2571.87 | 501 | 486 | 122.9 |
| D | 1 | 52 | 102639 | 831.08 | 501 | 486 | 122.9 |
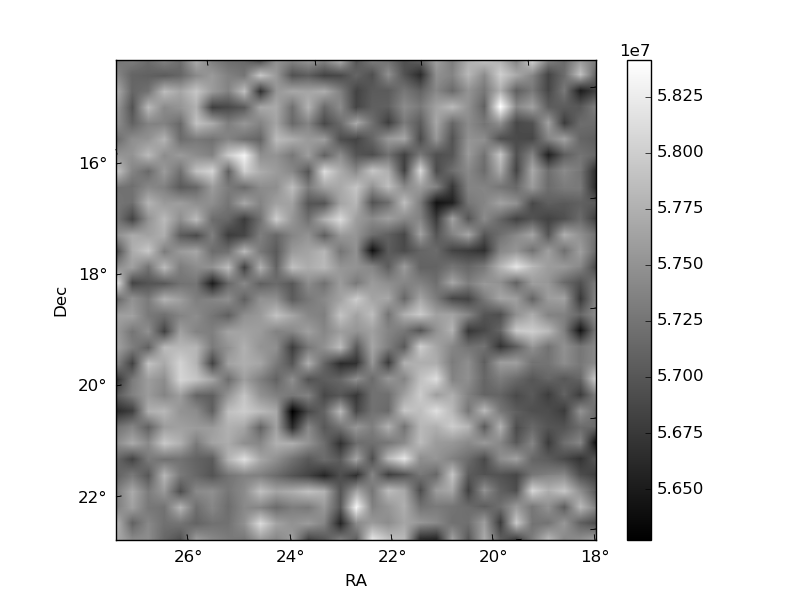
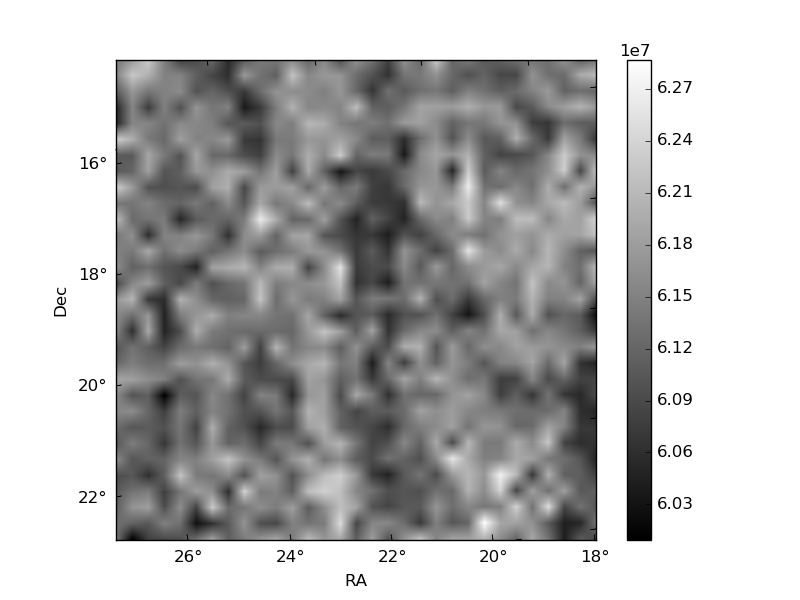
Histogram calculated using DETX and DETY for each event in the final _common_clean file
| Quadrant A | 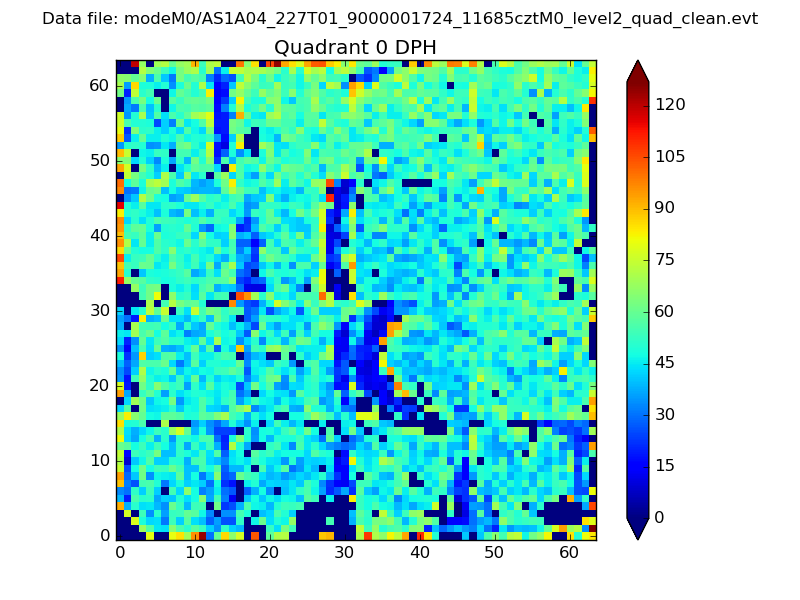 |
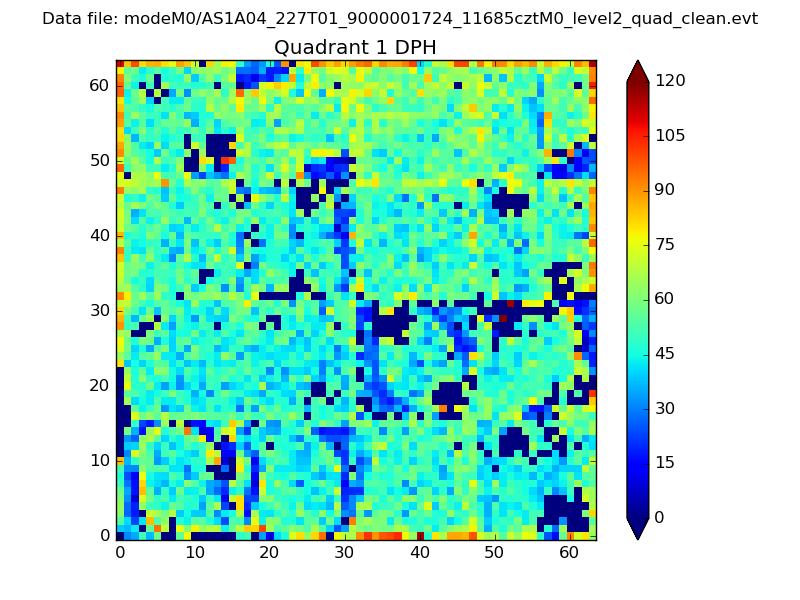 |
Quadrant B |
|---|---|---|---|
| Quadrant D | 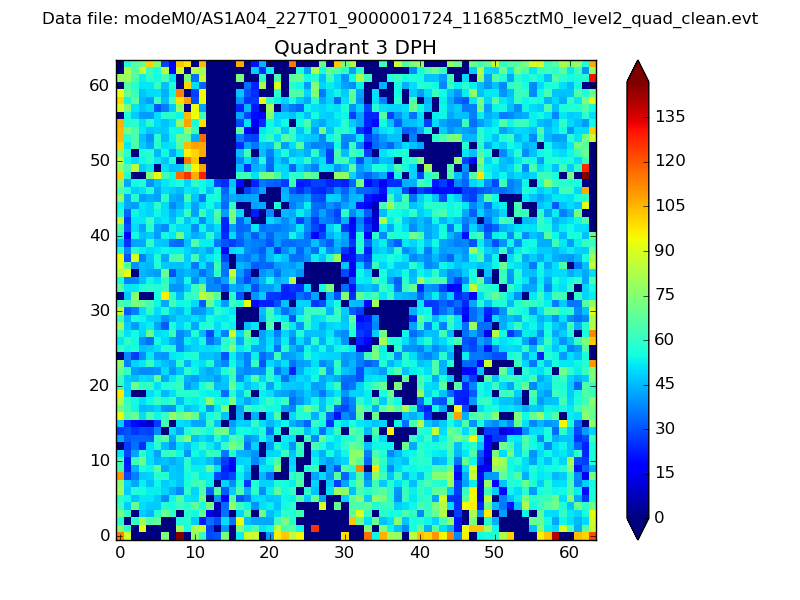 |
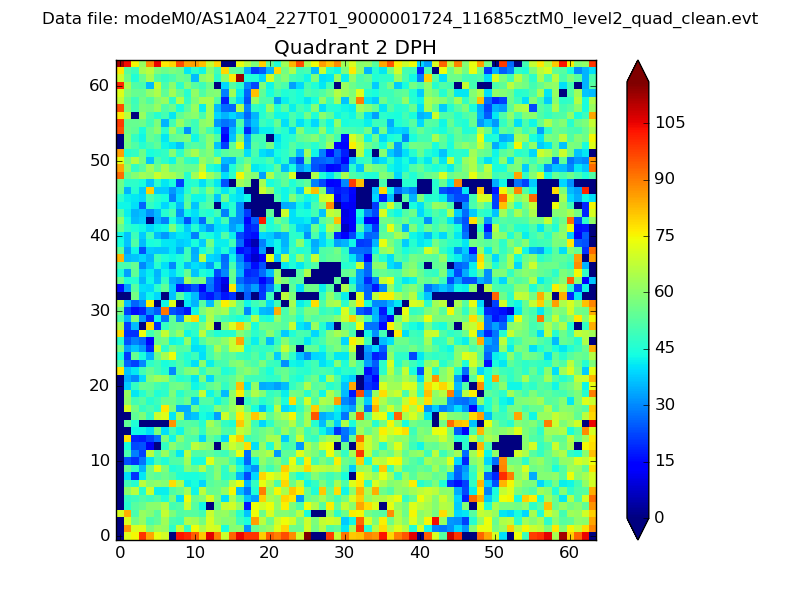 |
Quadrant C |
| Plot type | Count rate plots | Images |
|---|---|---|
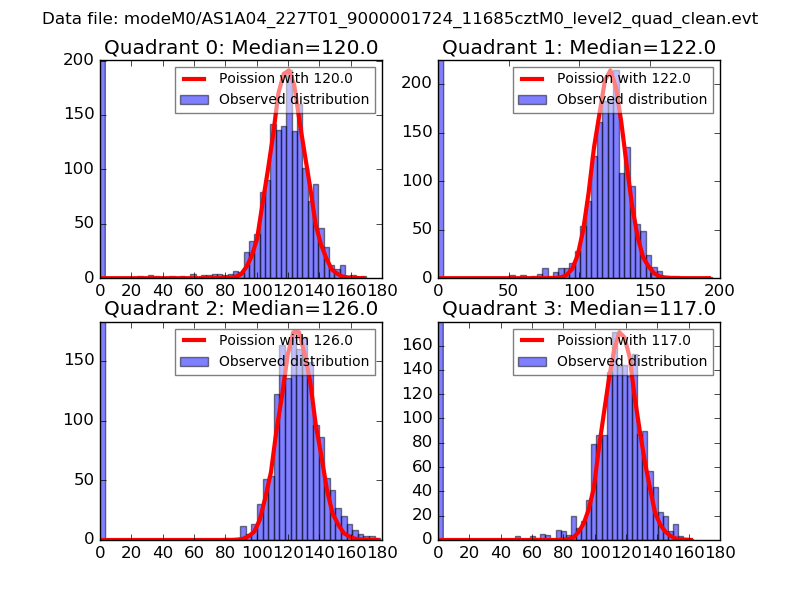
| Comparison with Poisson distribution Blue bars denote a histogram of data divided into 1 sec bins. Red curve is a Poisson curve with rate = median count rate of data. |
 |
 |
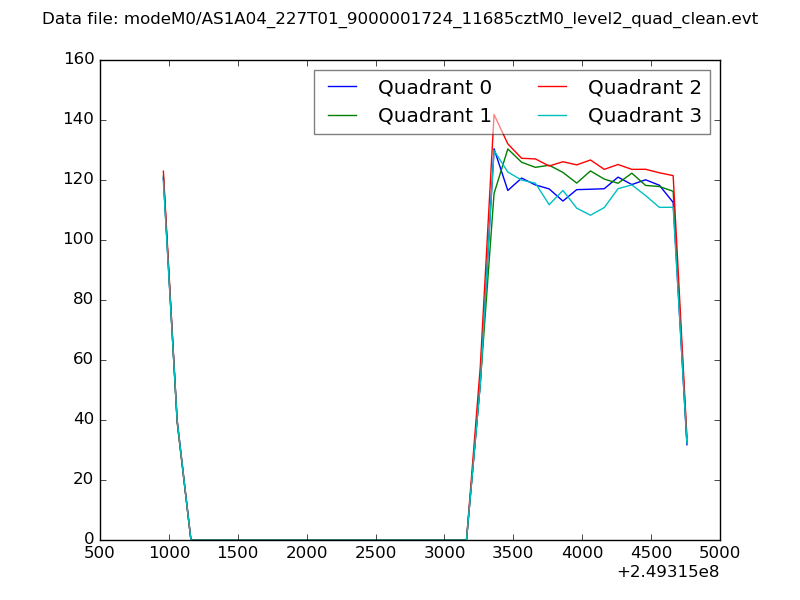
| Quadrant-wise count rates Data is divided into 100 sec bins |
 |
|
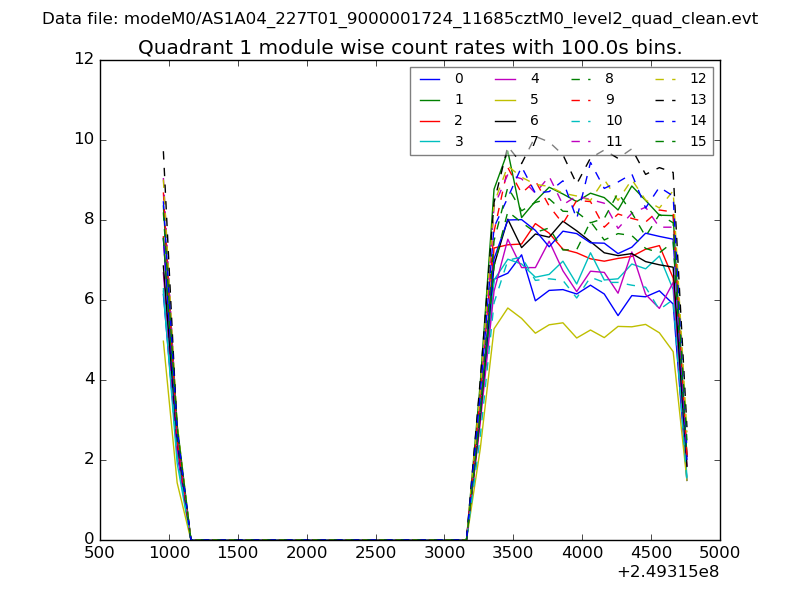
| Module-wise count rates for Quadrant A Data is divided into 100 sec bins |
 |
 |
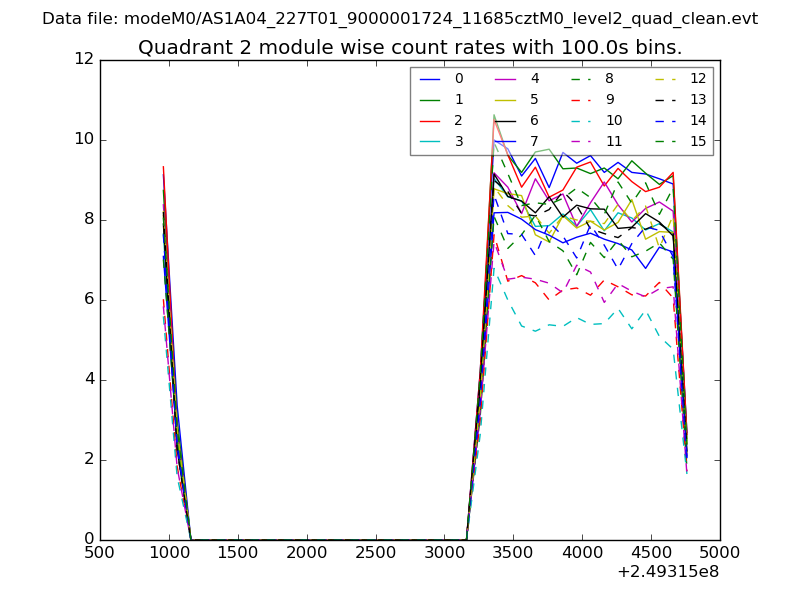
| Module-wise count rates for Quadrant B Data is divided into 100 sec bins |
 |
 |
| Module-wise count rates for Quadrant C Data is divided into 100 sec bins |
 |
 |
| Module-wise count rates for Quadrant D Data is divided into 100 sec bins |
 |
 |
| Parameter | Plot |
|---|---|
| CZT HV Monitor | 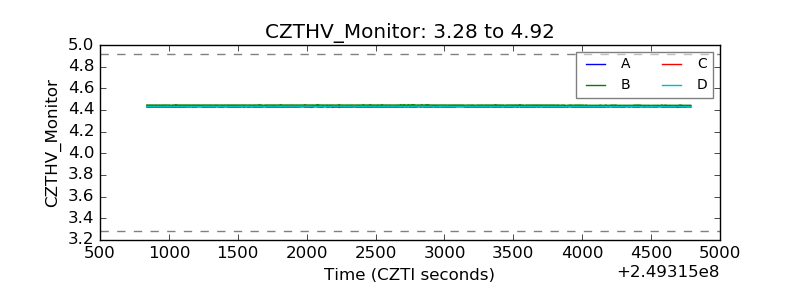 |
| D_VDD | 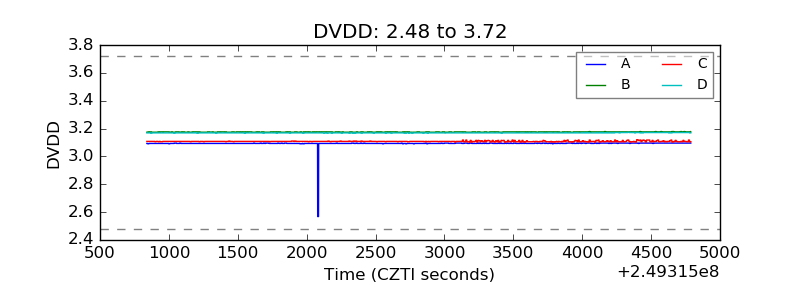 |
| Temperature 1 |  |
| Veto HV Monitor | 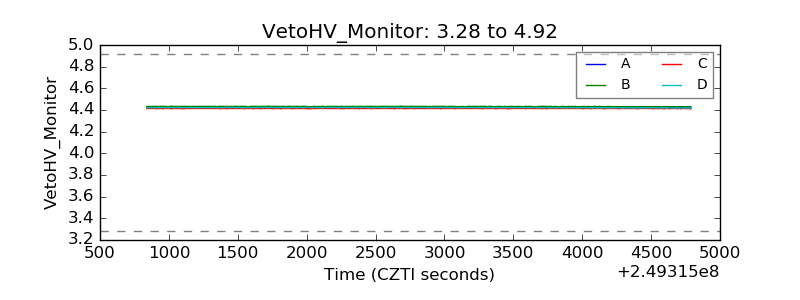 |
| Veto LLD | 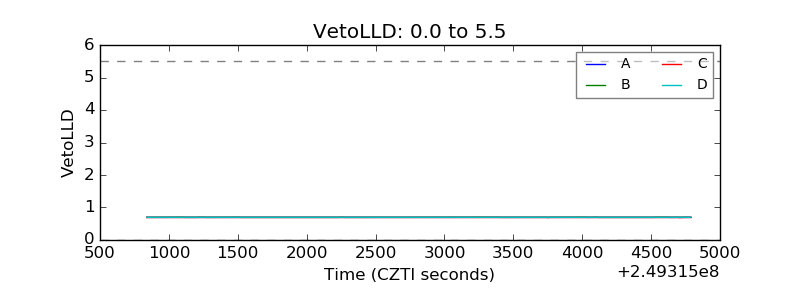 |
| Alpha Counter | 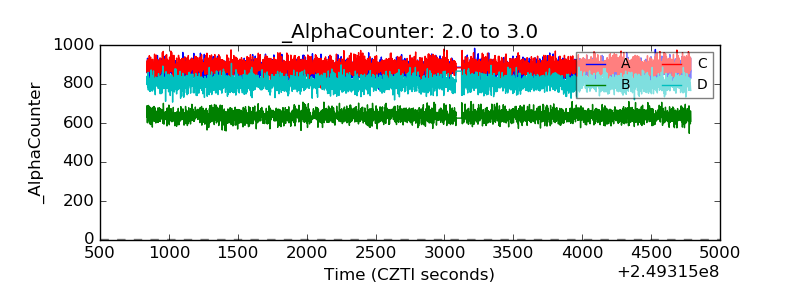 |
| _CPM_Rate | 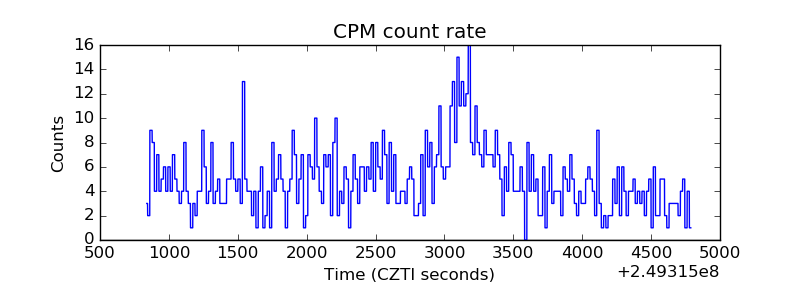 |
| CZT Counter | 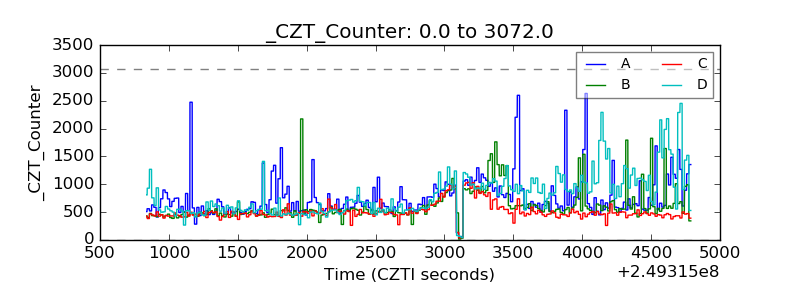 |
| +2.5 Volts monitor |  |
| +5 Volts monitor |  |
| _ROLL_ROT | 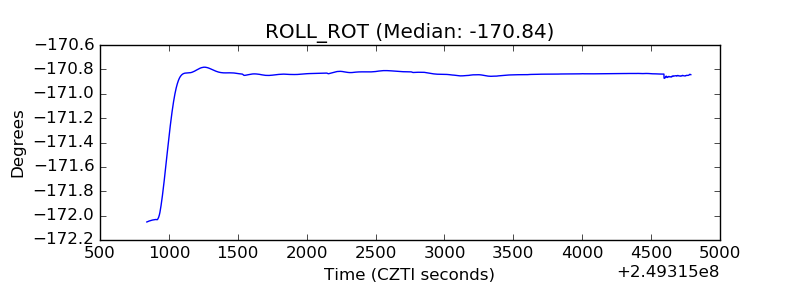 |
| _Roll_DEC | 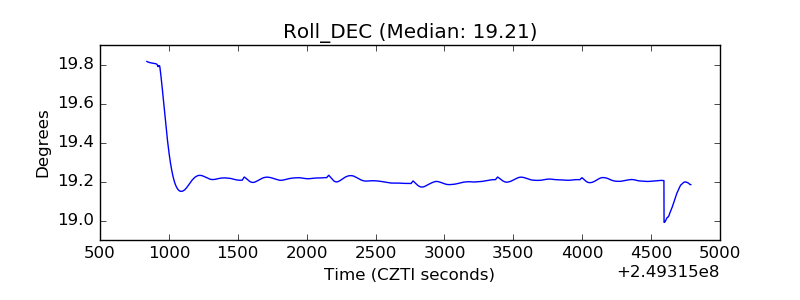 |
| _Roll_RA | 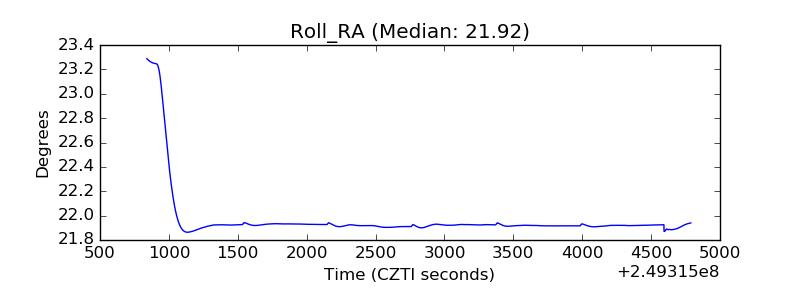 |
| Veto Counter | 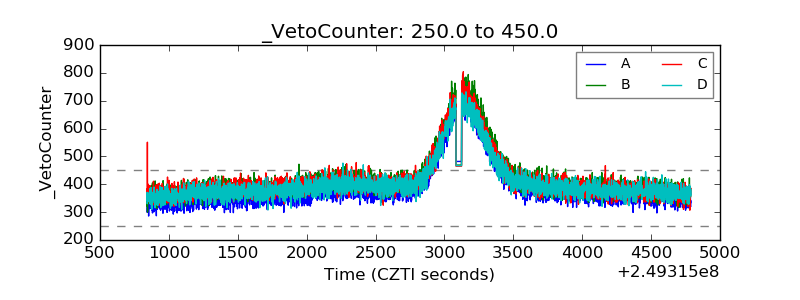 |