| Param | Original file | Final file |
|---|---|---|
| Filename | modeM0/AS1A04_227T01_9000001724_11689cztM0_level2.evt | modeM0/AS1A04_227T01_9000001724_11689cztM0_level2_quad_clean.evt |
| Size (bytes) | 1,694,145,600 | 225,558,720 |
| Size | 1.6 GB | 215.1 MB |
| Events in quadrant A | 12,983,306 | 1,393,766 |
| Events in quadrant B | 11,990,485 | 1,386,069 |
| Events in quadrant C | 8,337,284 | 1,456,175 |
| Events in quadrant D | 16,762,552 | 1,331,757 |
| Mode M0 | |||
|---|---|---|---|
| Quadrant | BADHDUFLAG | Total packets | Discarded packets |
| A | 0 | 51246 | 5 |
| B | 0 | 47466 | 4 |
| C | 0 | 37492 | 4 |
| D | 0 | 62444 | 4 |
| Mode SS | |||
|---|---|---|---|
| Quadrant | BADHDUFLAG | Total packets | Discarded packets |
| A | 0 | 372 | 0 |
| B | 0 | 372 | 0 |
| C | 0 | 372 | 0 |
| D | 0 | 372 | 0 |
| Mode M9 | |||
|---|---|---|---|
| Quadrant | BADHDUFLAG | Total packets | Discarded packets |
| A | 0 | 21 | 0 |
| B | 0 | 21 | 0 |
| C | 0 | 21 | 0 |
| D | 0 | 21 | 0 |
| Quadrant | Total seconds | Saturated seconds | Saturation percentage |
|---|---|---|---|
| A | 18321 | 742 | 4.049997% |
| B | 18321 | 995 | 5.430926% |
| C | 18321 | 78 | 0.425741% |
| D | 18322 | 2131 | 11.630826% |
Noise dominated data is calculated using 1-second bins in cleaned event files. If a bin has >2000 counts, and if more than 50% of those come from <1% of pixels, then it is considered to be noise-dominated and hence unusable.
| Quadrant | # 1 sec bins | Bins with >0 counts | Bins with >2000 counts | High rate bins dominated by noise | Noise dominated (total time) | Noise dominated (detector-on time) | Marked lightcurve |
|---|---|---|---|---|---|---|---|
| A | 20347 | 18325 | 296 | 296 | 1.45% | 1.62% | 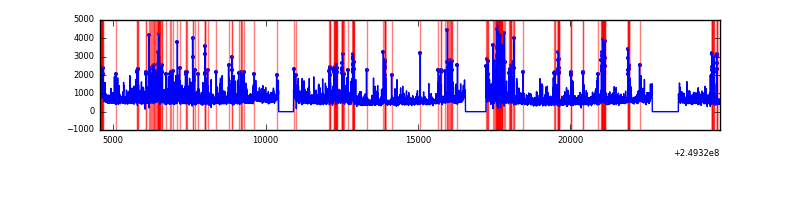 |
| B | 20347 | 18325 | 496 | 496 | 2.44% | 2.71% | 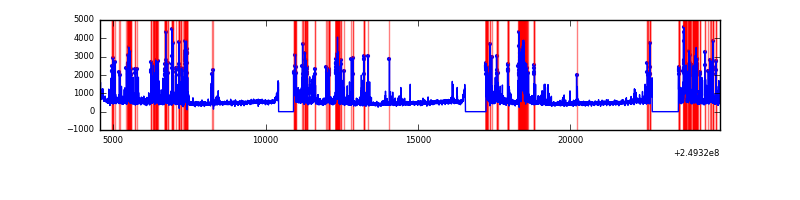 |
| C | 20347 | 18325 | 1 | 1 | 0.00% | 0.01% | 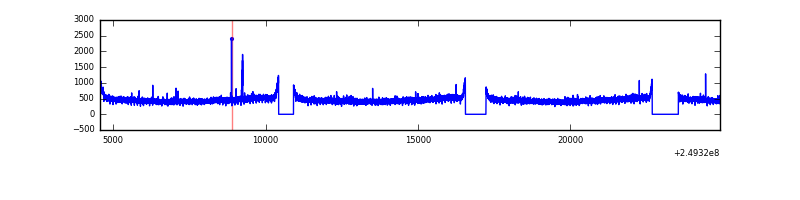 |
| D | 20348 | 18326 | 1784 | 1784 | 8.77% | 9.73% | 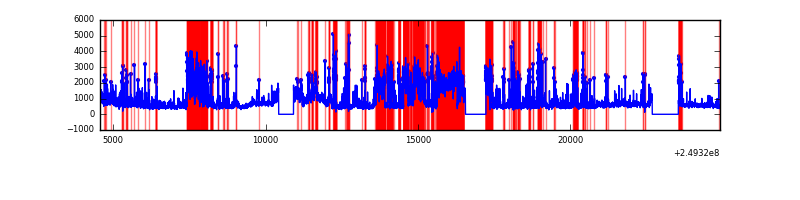 |
Top three noisy pixels from each quadrant. If the there are fewer than three noisy pixels in the level2.evt file, extra rows are filled as -1
| Pixel properties | Quadrant properties | ||||||
|---|---|---|---|---|---|---|---|
| Quadrant | DetID | PixID | Counts | Sigma | Mean | Median | Sigma |
| A | 8 | 5 | 2884916 | 6577.9 | 2147 | 2100 | 438.3 |
| A | 1 | 162 | 649805 | 1477.91 | 2147 | 2100 | 438.3 |
| A | 1 | 178 | 370182 | 839.88 | 2147 | 2100 | 438.3 |
| B | 4 | 239 | 2105058 | 5143.38 | 2142 | 2087 | 408.9 |
| B | 3 | 64 | 651316 | 1587.86 | 2142 | 2087 | 408.9 |
| B | 15 | 204 | 346571 | 842.53 | 2142 | 2087 | 408.9 |
| C | 14 | 234 | 19109 | 34.29 | 2132 | 2146 | 494.7 |
| C | 13 | 61 | 15365 | 26.72 | 2132 | 2146 | 494.7 |
| C | 12 | 4 | 11192 | 18.29 | 2132 | 2146 | 494.7 |
| D | 13 | 152 | 5091626 | 10331.64 | 2042 | 1988 | 492.6 |
| D | 1 | 52 | 1064952 | 2157.75 | 2042 | 1988 | 492.6 |
| D | 1 | 239 | 925833 | 1875.35 | 2042 | 1988 | 492.6 |
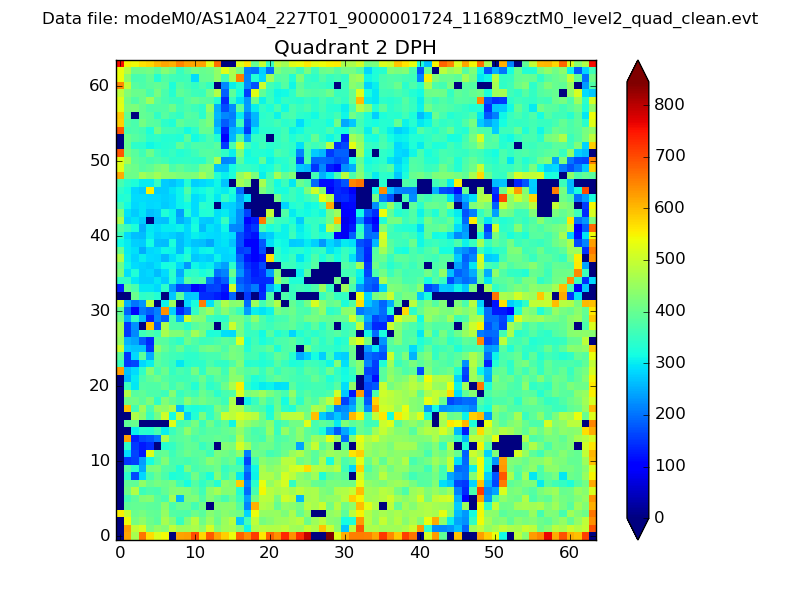
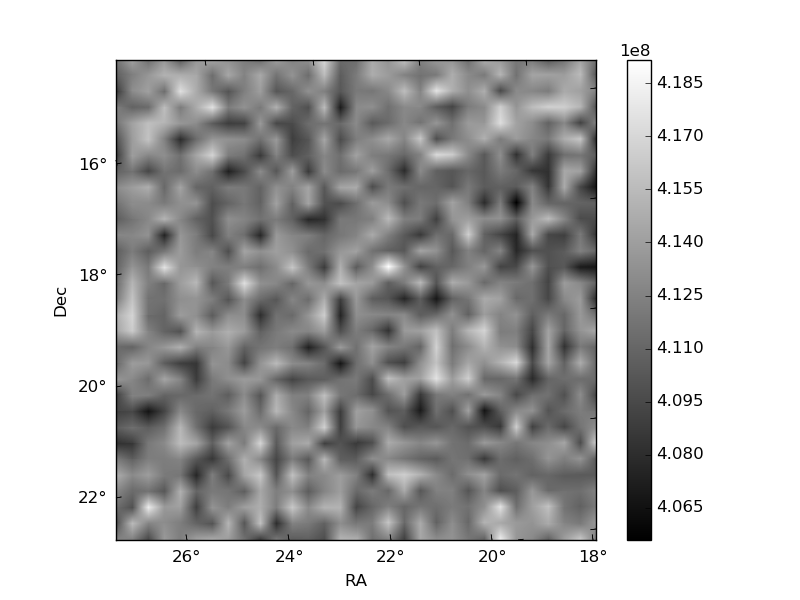
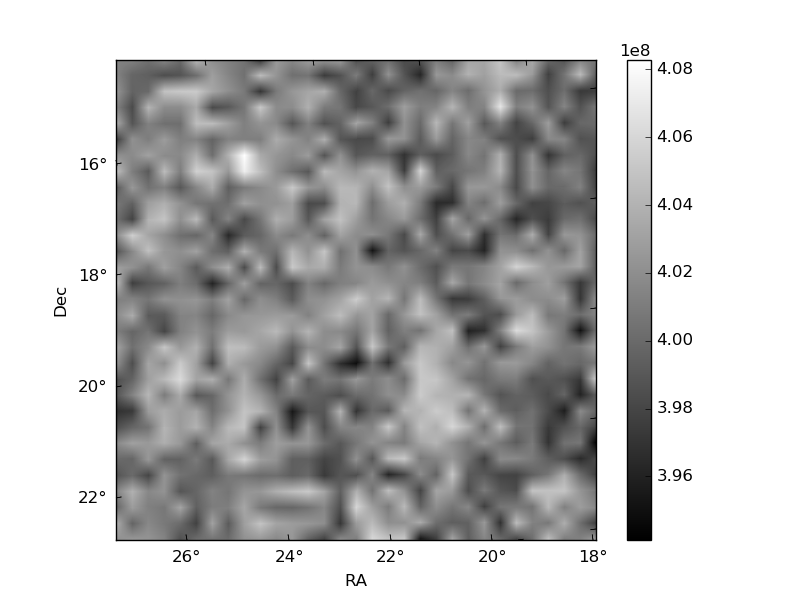
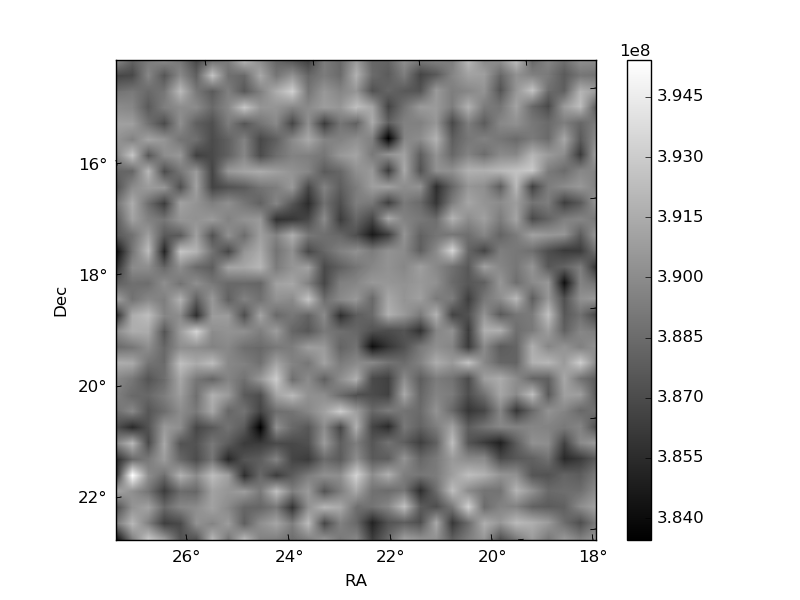
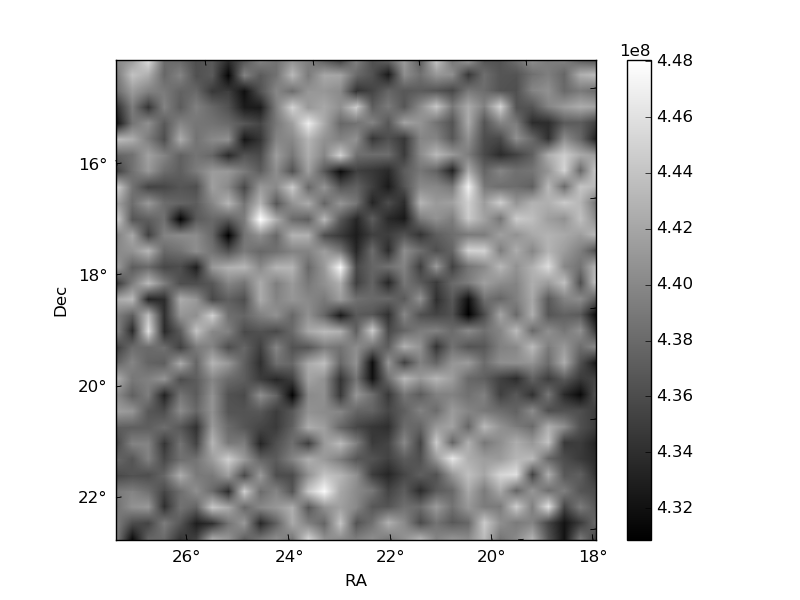
Histogram calculated using DETX and DETY for each event in the final _common_clean file
| Quadrant A | 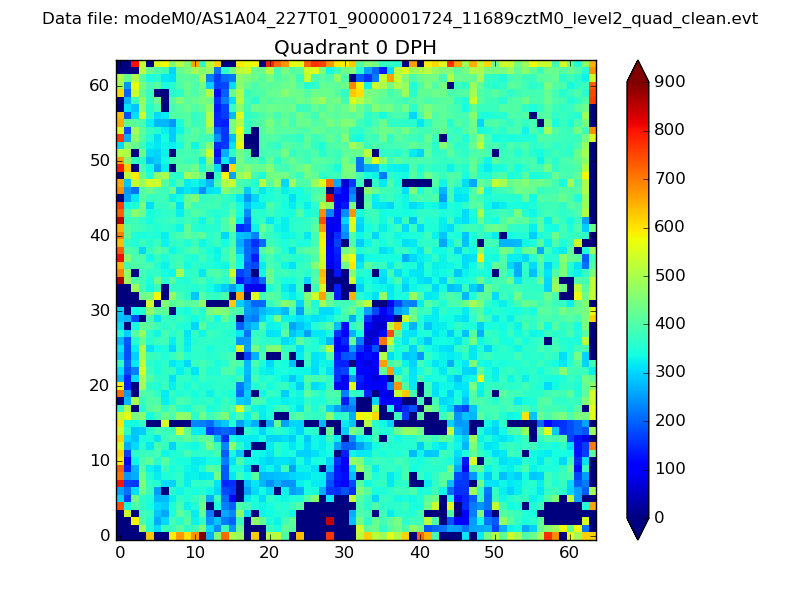 |
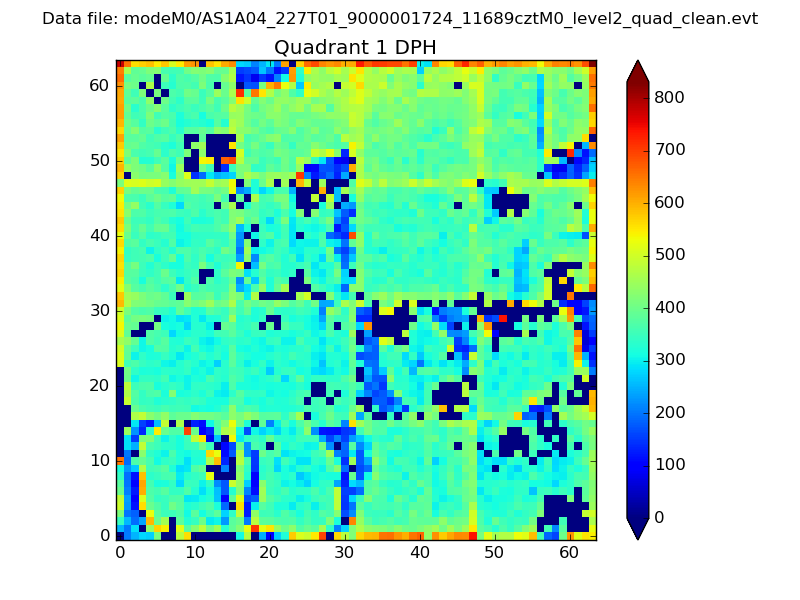 |
Quadrant B |
|---|---|---|---|
| Quadrant D | 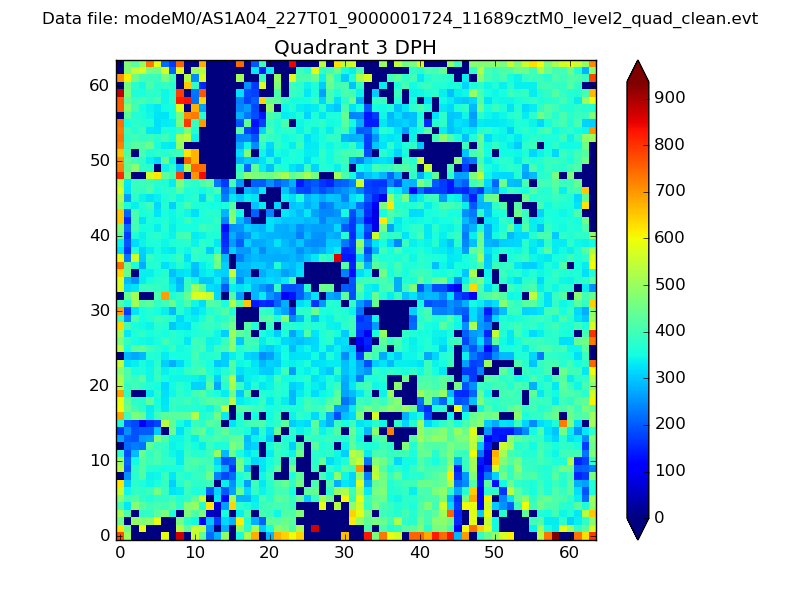 |
 |
Quadrant C |
| Plot type | Count rate plots | Images |
|---|---|---|
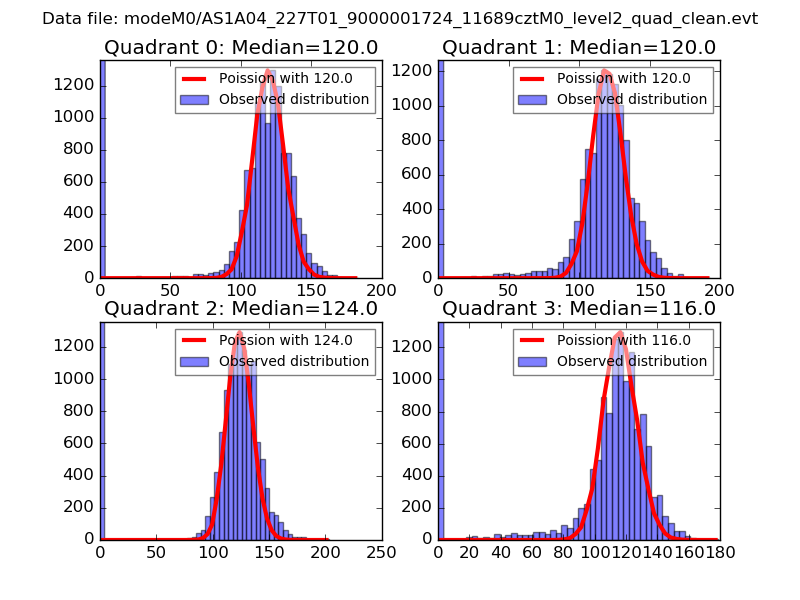
| Comparison with Poisson distribution Blue bars denote a histogram of data divided into 1 sec bins. Red curve is a Poisson curve with rate = median count rate of data. |
 |
 |
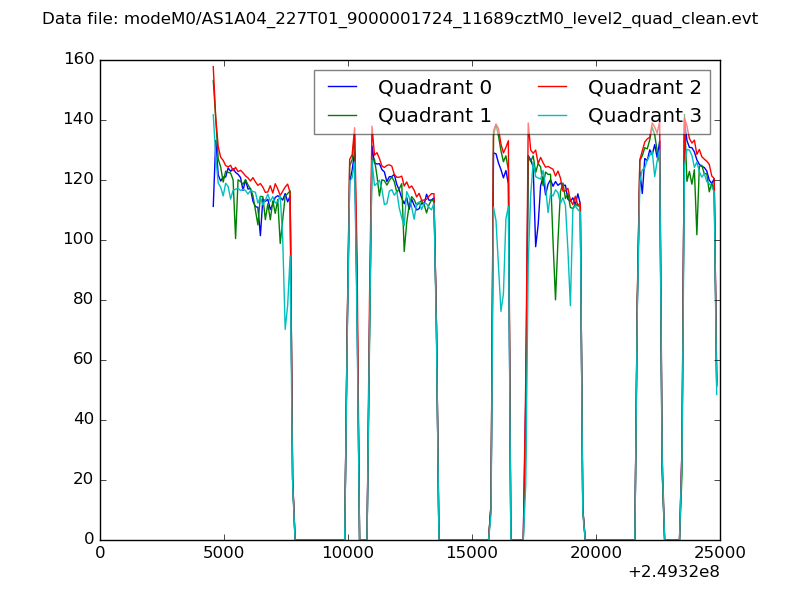
| Quadrant-wise count rates Data is divided into 100 sec bins |
 |
|
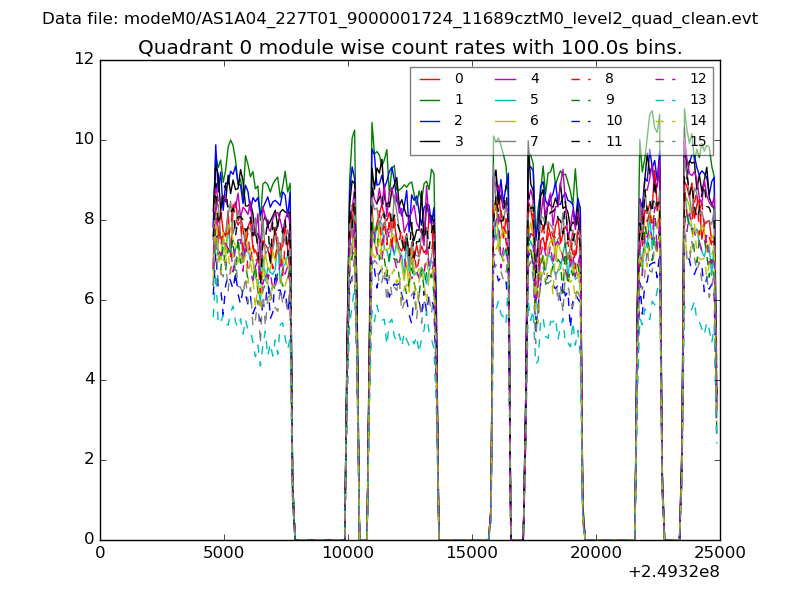
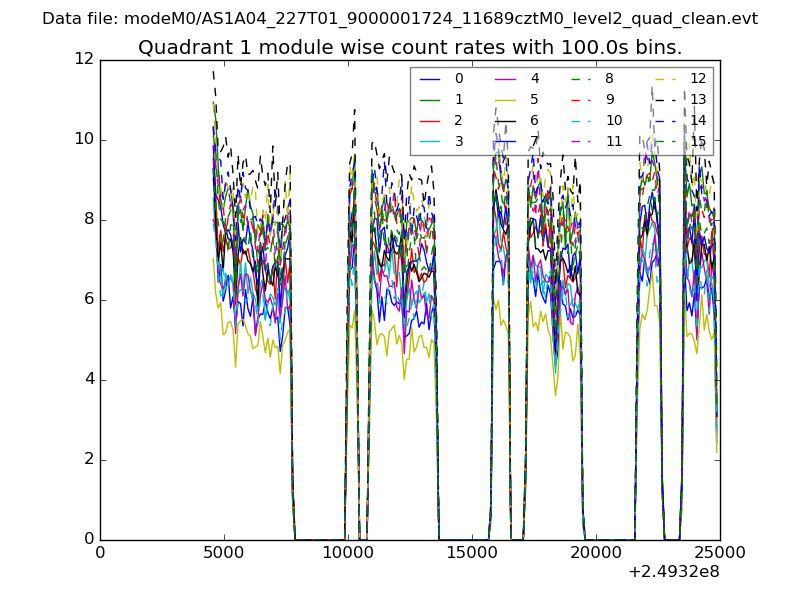
| Module-wise count rates for Quadrant A Data is divided into 100 sec bins |
 |
 |
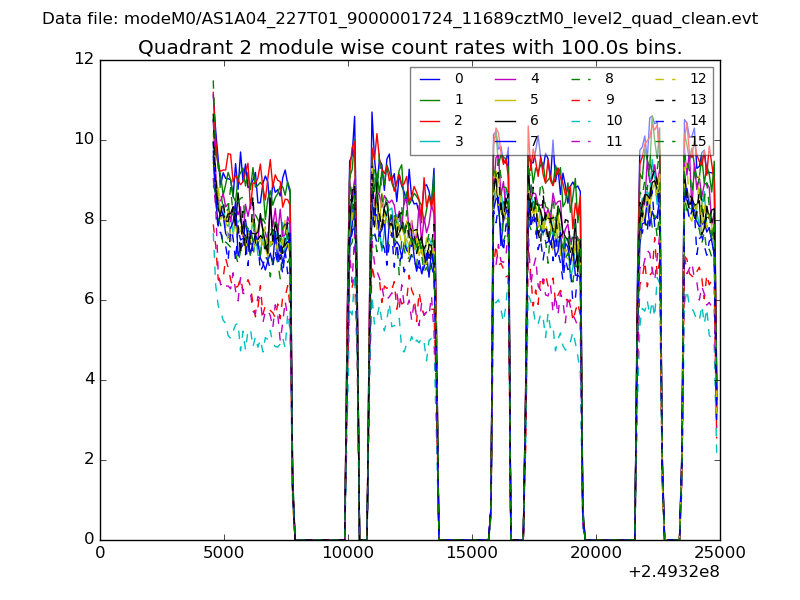
| Module-wise count rates for Quadrant B Data is divided into 100 sec bins |
 |
 |
| Module-wise count rates for Quadrant C Data is divided into 100 sec bins |
 |
 |
| Module-wise count rates for Quadrant D Data is divided into 100 sec bins |
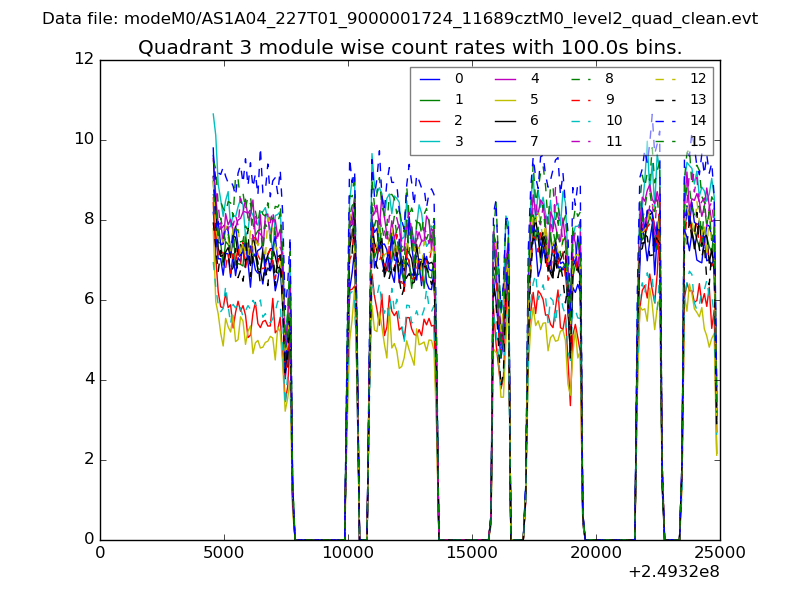 |
 |
| Parameter | Plot |
|---|---|
| CZT HV Monitor | 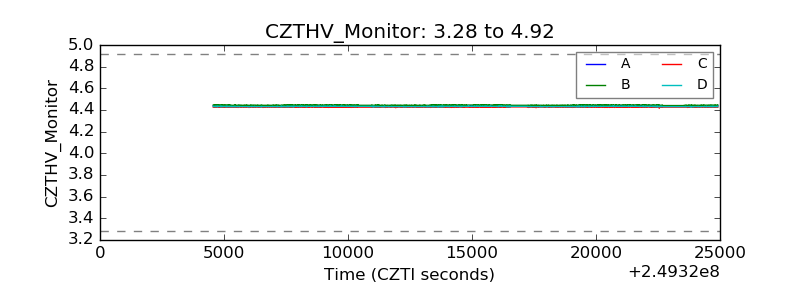 |
| D_VDD | 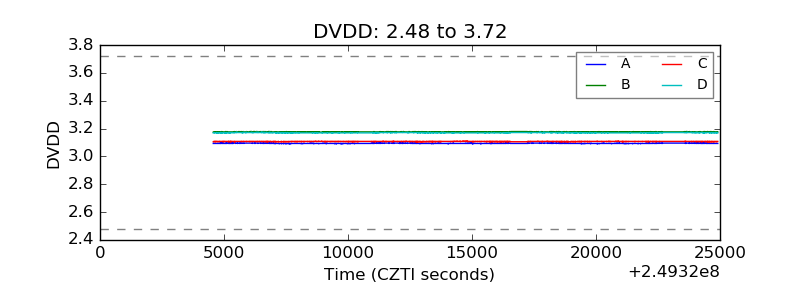 |
| Temperature 1 | 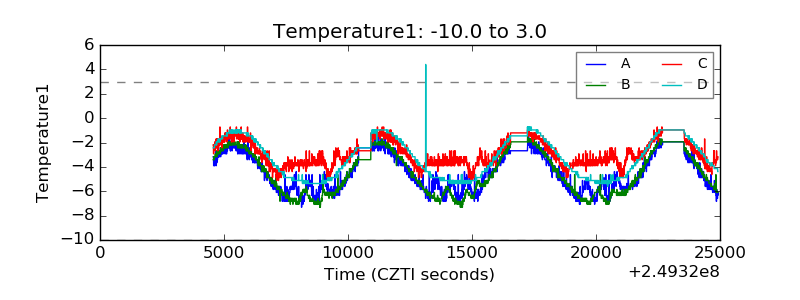 |
| Veto HV Monitor | 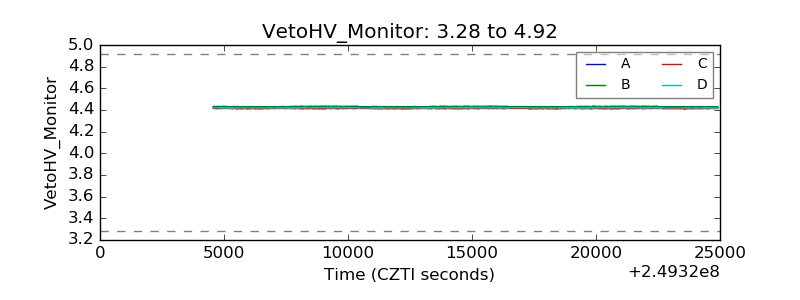 |
| Veto LLD | 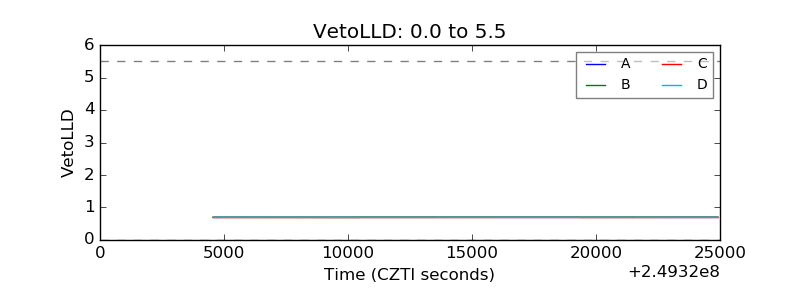 |
| Alpha Counter | 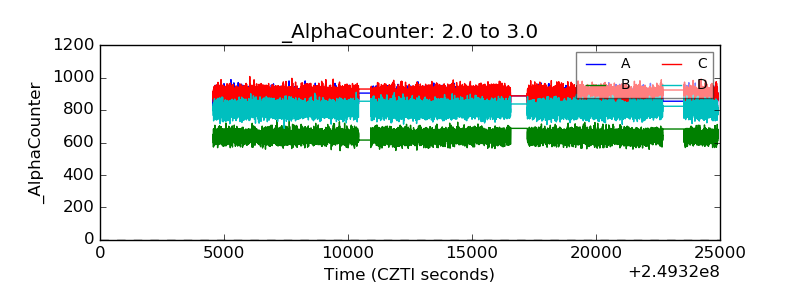 |
| _CPM_Rate | 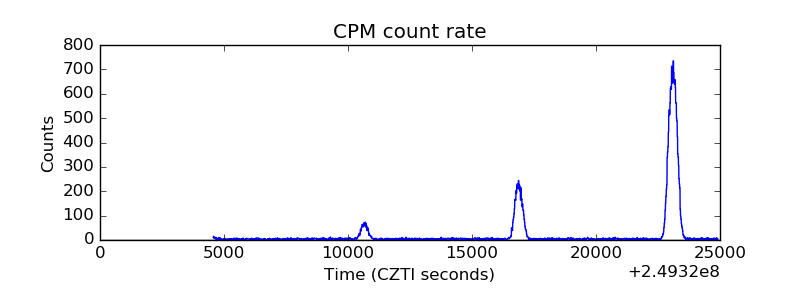 |
| CZT Counter | 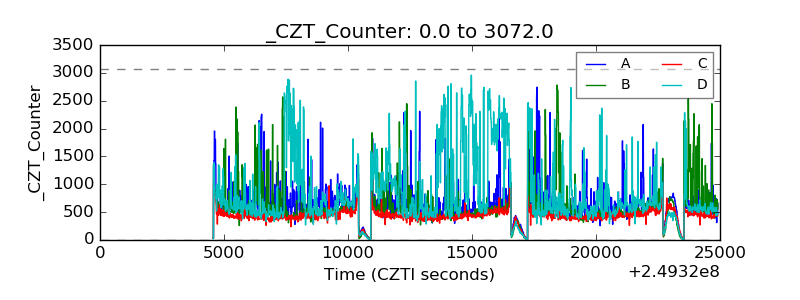 |
| +2.5 Volts monitor |  |
| +5 Volts monitor |  |
| _ROLL_ROT | 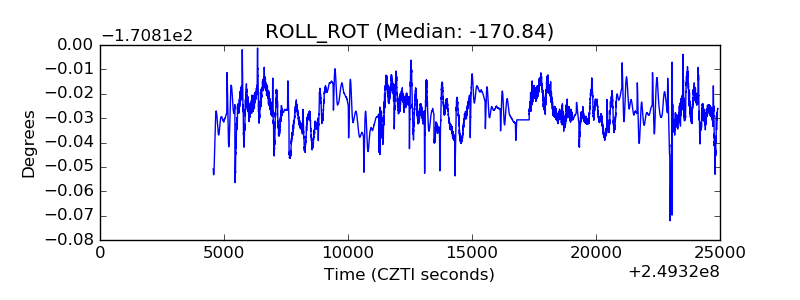 |
| _Roll_DEC | 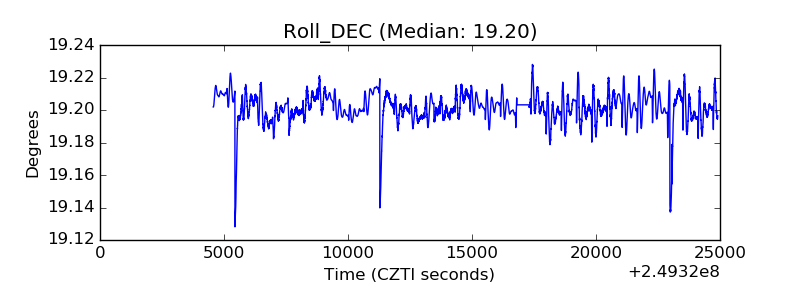 |
| _Roll_RA | 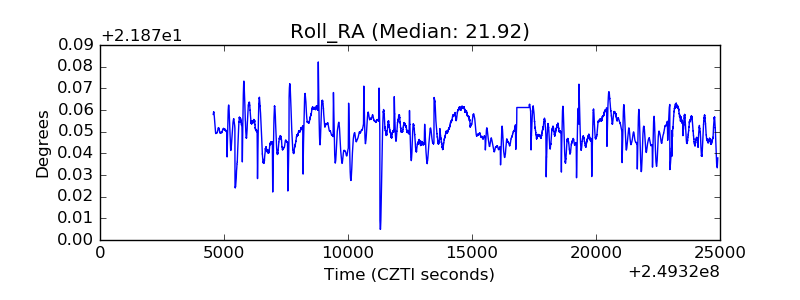 |
| Veto Counter | 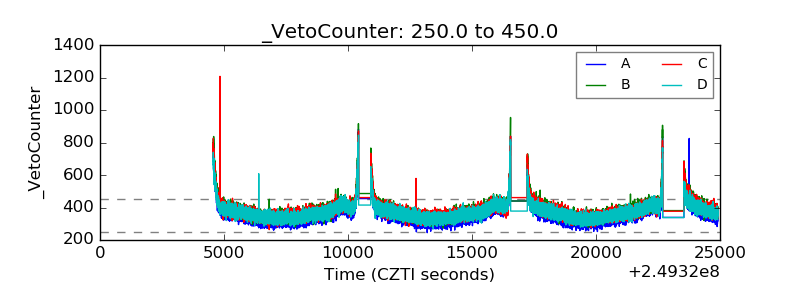 |