| Param | Original file | Final file |
|---|---|---|
| Filename | modeM0/AS1A04_227T01_9000001724_11690cztM0_level2.evt | modeM0/AS1A04_227T01_9000001724_11690cztM0_level2_quad_clean.evt |
| Size (bytes) | 599,336,640 | 92,692,800 |
| Size | 571.6 MB | 88.4 MB |
| Events in quadrant A | 4,776,160 | 580,150 |
| Events in quadrant B | 4,913,365 | 577,206 |
| Events in quadrant C | 3,135,672 | 604,566 |
| Events in quadrant D | 4,864,831 | 570,399 |
| Mode M0 | |||
|---|---|---|---|
| Quadrant | BADHDUFLAG | Total packets | Discarded packets |
| A | 0 | 18836 | 3 |
| B | 0 | 19163 | 2 |
| C | 0 | 13882 | 2 |
| D | 0 | 18883 | 2 |
| Mode SS | |||
|---|---|---|---|
| Quadrant | BADHDUFLAG | Total packets | Discarded packets |
| A | 0 | 140 | 0 |
| B | 0 | 140 | 0 |
| C | 0 | 140 | 0 |
| D | 0 | 140 | 0 |
| Mode M9 | |||
|---|---|---|---|
| Quadrant | BADHDUFLAG | Total packets | Discarded packets |
| A | 0 | 19 | 0 |
| B | 0 | 19 | 0 |
| C | 0 | 19 | 0 |
| D | 0 | 19 | 0 |
| Quadrant | Total seconds | Saturated seconds | Saturation percentage |
|---|---|---|---|
| A | 6810 | 305 | 4.478708% |
| B | 6810 | 475 | 6.975037% |
| C | 6810 | 30 | 0.440529% |
| D | 6810 | 246 | 3.612335% |
Noise dominated data is calculated using 1-second bins in cleaned event files. If a bin has >2000 counts, and if more than 50% of those come from <1% of pixels, then it is considered to be noise-dominated and hence unusable.
| Quadrant | # 1 sec bins | Bins with >0 counts | Bins with >2000 counts | High rate bins dominated by noise | Noise dominated (total time) | Noise dominated (detector-on time) | Marked lightcurve |
|---|---|---|---|---|---|---|---|
| A | 8695 | 6812 | 169 | 169 | 1.94% | 2.48% | 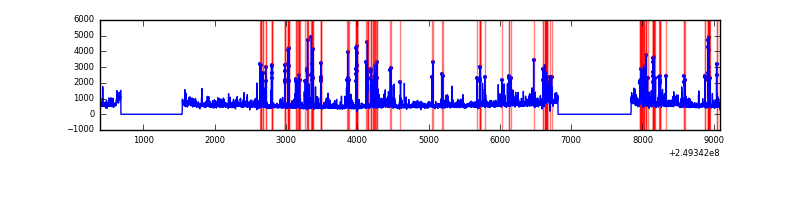 |
| B | 8696 | 6813 | 228 | 228 | 2.62% | 3.35% | 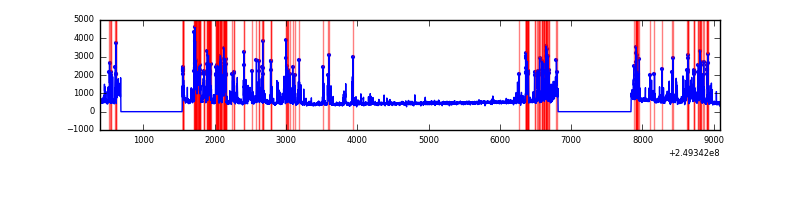 |
| C | 8696 | 6813 | 0 | 0 | 0.00% | 0.00% | 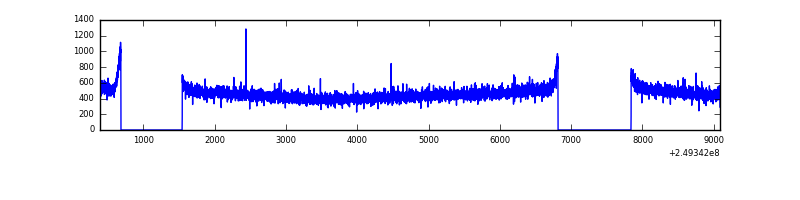 |
| D | 8696 | 6813 | 209 | 209 | 2.40% | 3.07% | 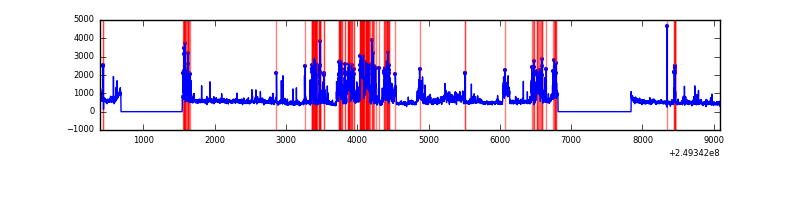 |
Top three noisy pixels from each quadrant. If the there are fewer than three noisy pixels in the level2.evt file, extra rows are filled as -1
| Pixel properties | Quadrant properties | ||||||
|---|---|---|---|---|---|---|---|
| Quadrant | DetID | PixID | Counts | Sigma | Mean | Median | Sigma |
| A | 8 | 5 | 1134906 | 6845.4 | 806 | 786 | 165.7 |
| A | 1 | 162 | 198555 | 1193.71 | 806 | 786 | 165.7 |
| A | 1 | 178 | 110359 | 661.37 | 806 | 786 | 165.7 |
| B | 4 | 239 | 972572 | 6243.26 | 804 | 783 | 155.7 |
| B | 3 | 64 | 452940 | 2904.88 | 804 | 783 | 155.7 |
| B | 3 | 189 | 163455 | 1045.09 | 804 | 783 | 155.7 |
| C | 13 | 61 | 5848 | 27.0 | 804 | 809 | 186.6 |
| C | 12 | 4 | 2447 | 8.78 | 804 | 809 | 186.6 |
| C | 3 | 202 | 1947 | 6.1 | 804 | 809 | 186.6 |
| D | 13 | 152 | 1003002 | 5244.67 | 791 | 770 | 191.1 |
| D | 13 | 104 | 348627 | 1820.33 | 791 | 770 | 191.1 |
| D | 8 | 195 | 323097 | 1686.73 | 791 | 770 | 191.1 |
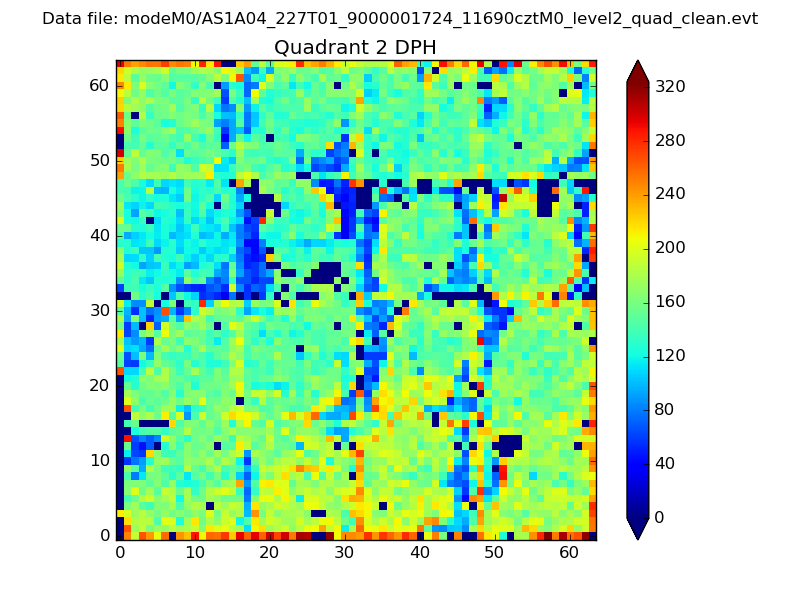
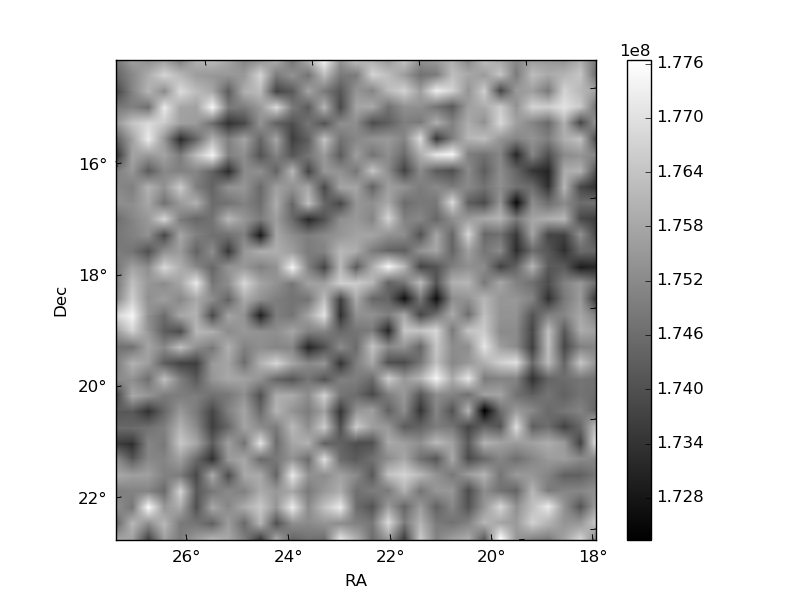
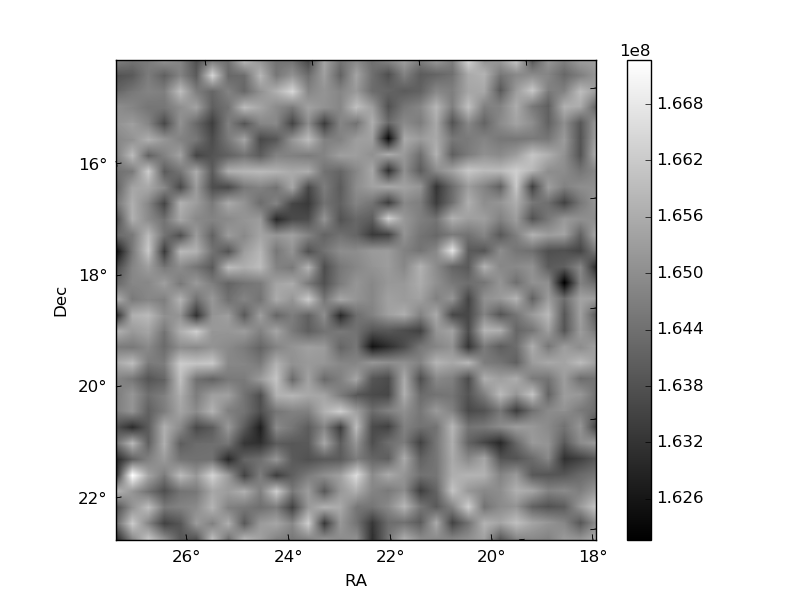
Histogram calculated using DETX and DETY for each event in the final _common_clean file
| Quadrant A | 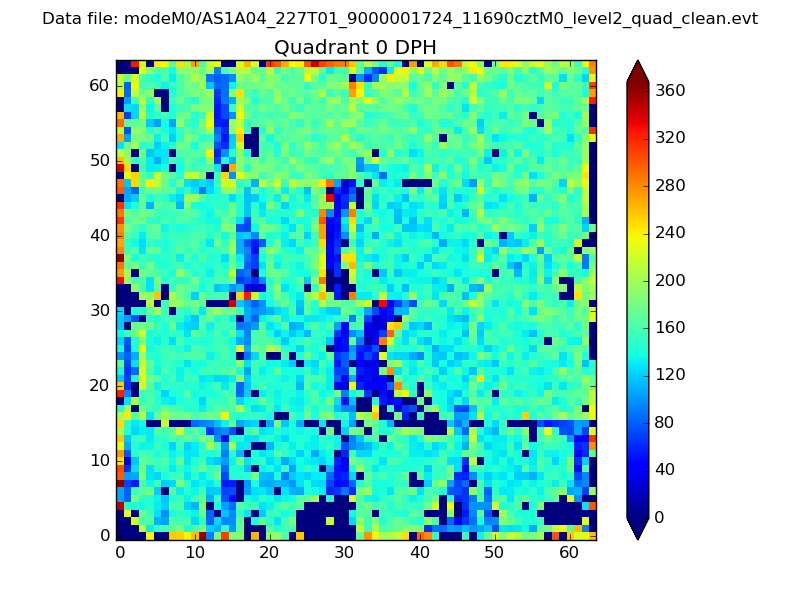 |
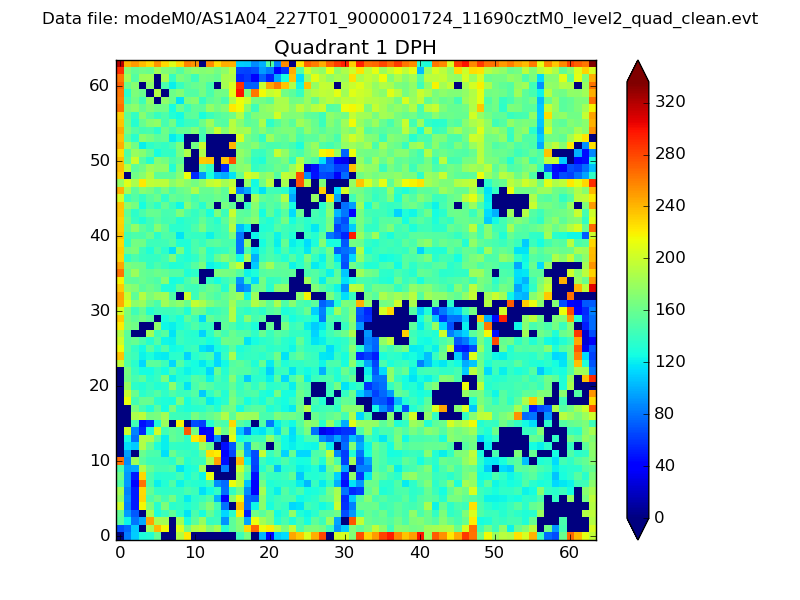 |
Quadrant B |
|---|---|---|---|
| Quadrant D | 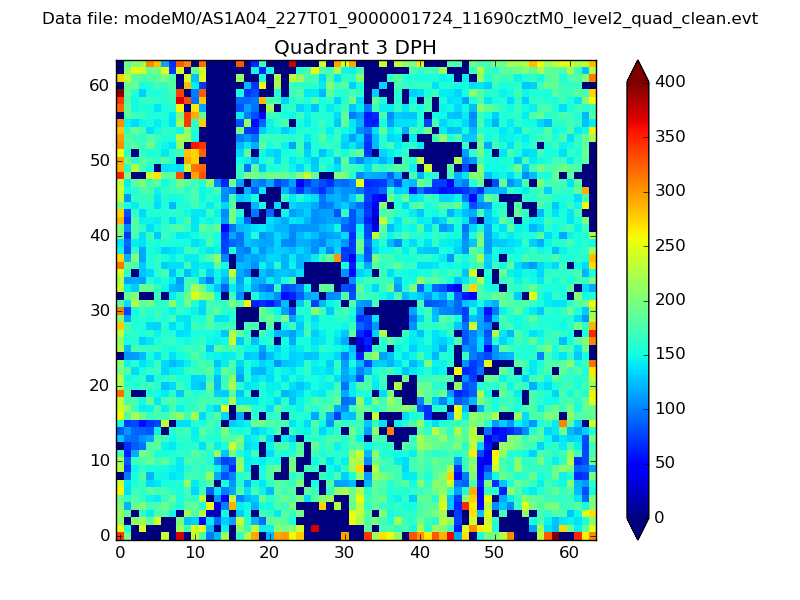 |
 |
Quadrant C |
| Plot type | Count rate plots | Images |
|---|---|---|
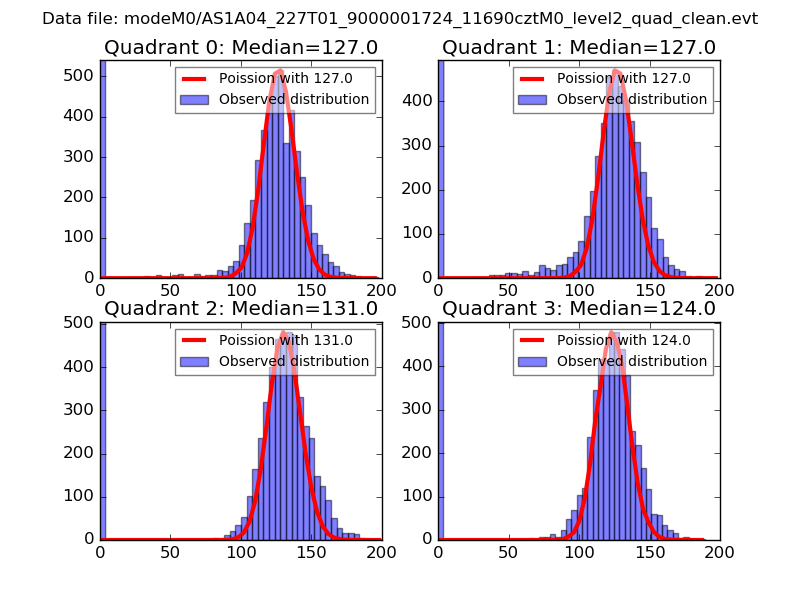
| Comparison with Poisson distribution Blue bars denote a histogram of data divided into 1 sec bins. Red curve is a Poisson curve with rate = median count rate of data. |
 |
 |
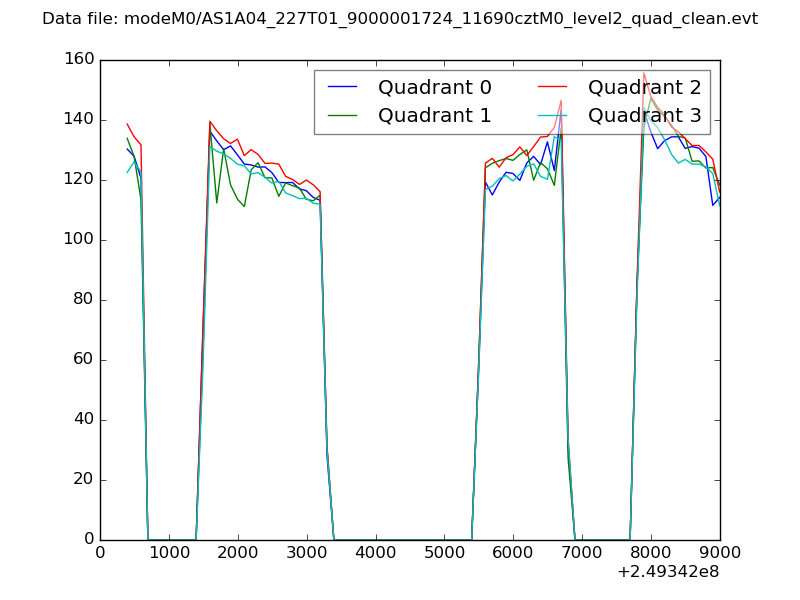
| Quadrant-wise count rates Data is divided into 100 sec bins |
 |
|
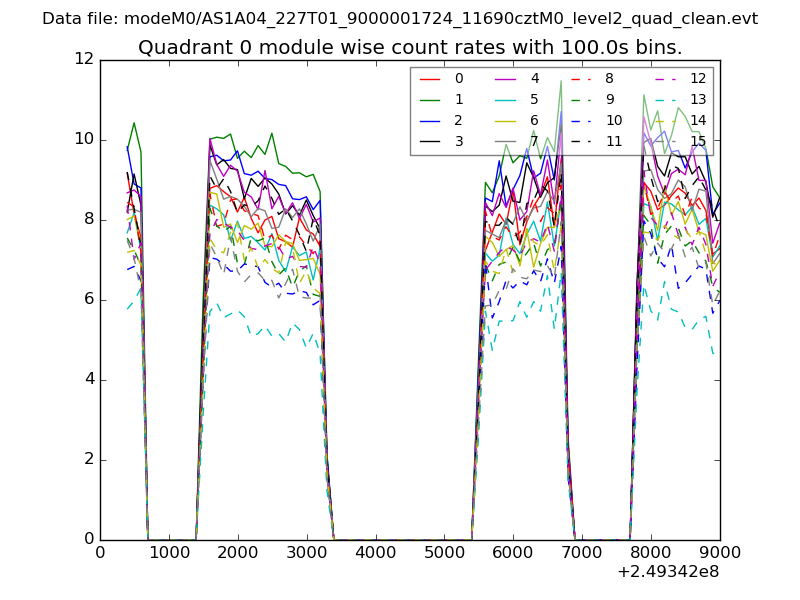
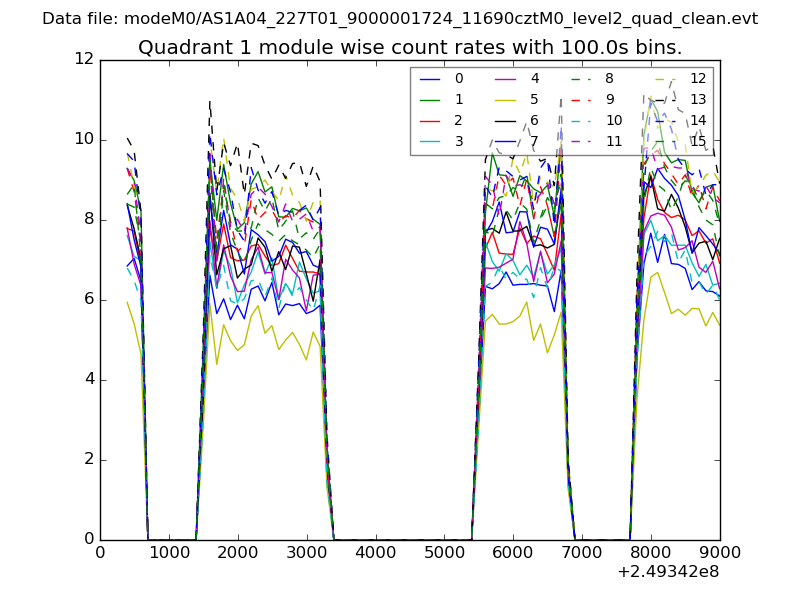
| Module-wise count rates for Quadrant A Data is divided into 100 sec bins |
 |
 |
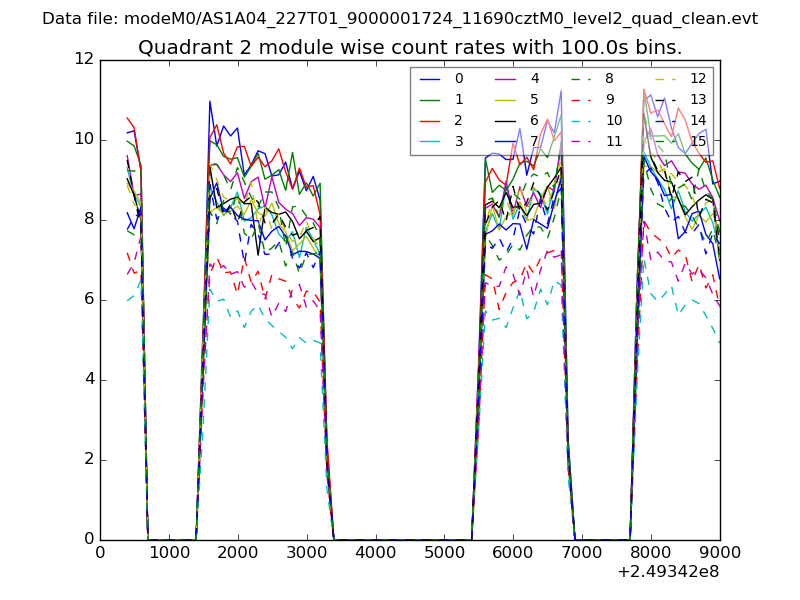
| Module-wise count rates for Quadrant B Data is divided into 100 sec bins |
 |
 |
| Module-wise count rates for Quadrant C Data is divided into 100 sec bins |
 |
 |
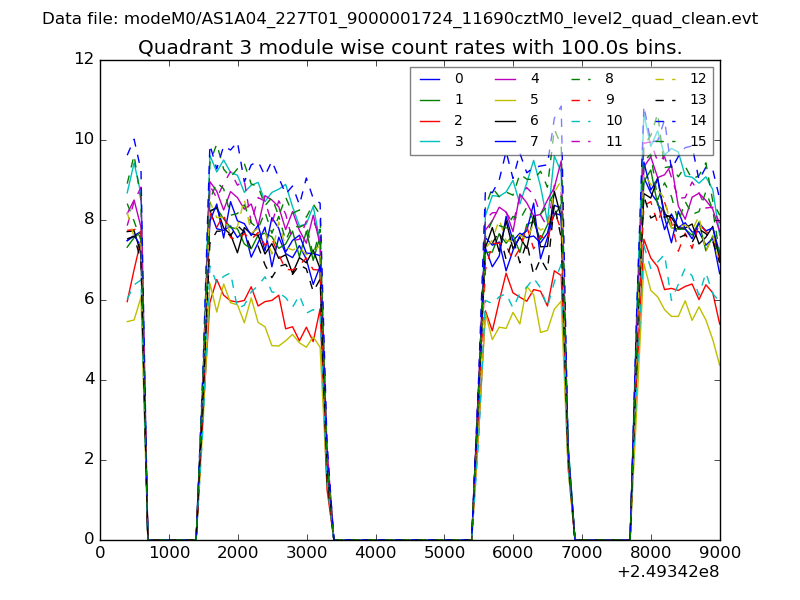
| Module-wise count rates for Quadrant D Data is divided into 100 sec bins |
 |
 |
| Parameter | Plot |
|---|---|
| CZT HV Monitor | 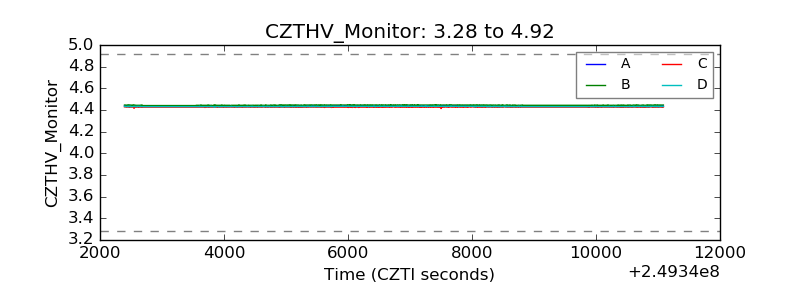 |
| D_VDD | 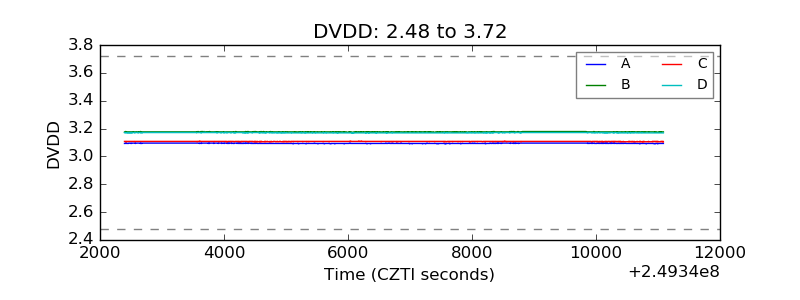 |
| Temperature 1 | 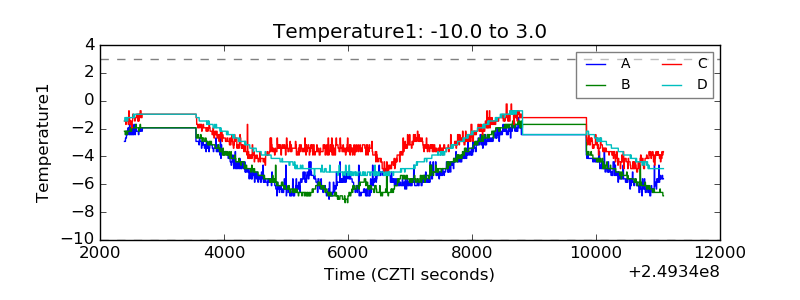 |
| Veto HV Monitor | 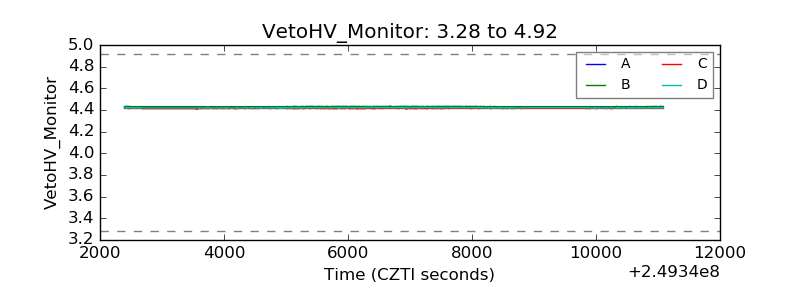 |
| Veto LLD | 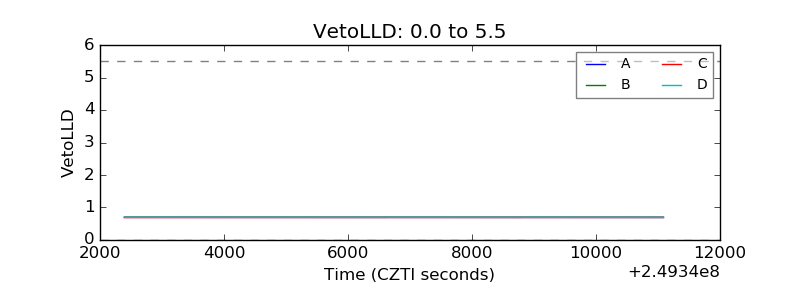 |
| Alpha Counter | 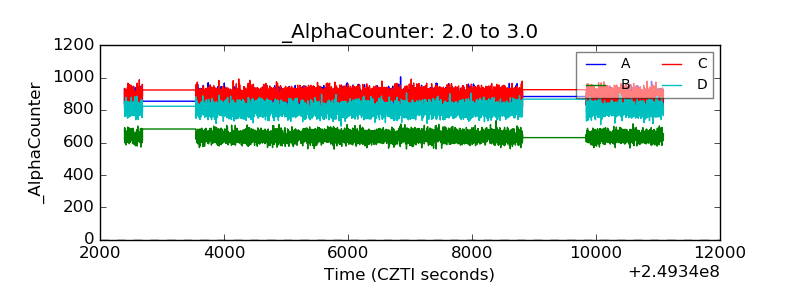 |
| _CPM_Rate | 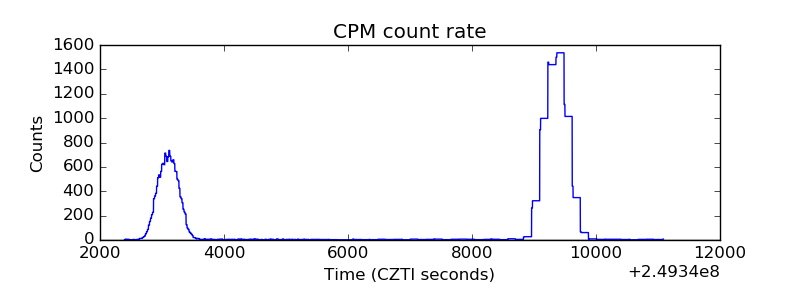 |
| CZT Counter | 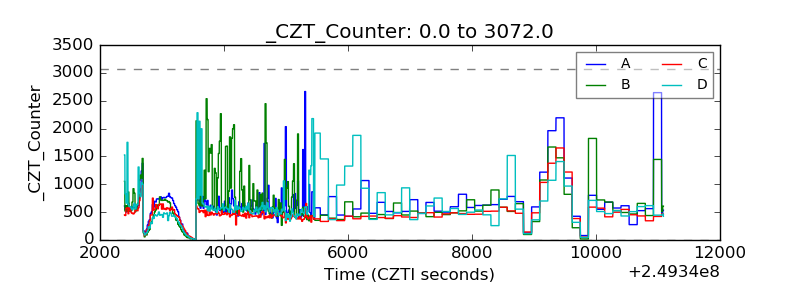 |
| +2.5 Volts monitor |  |
| +5 Volts monitor | 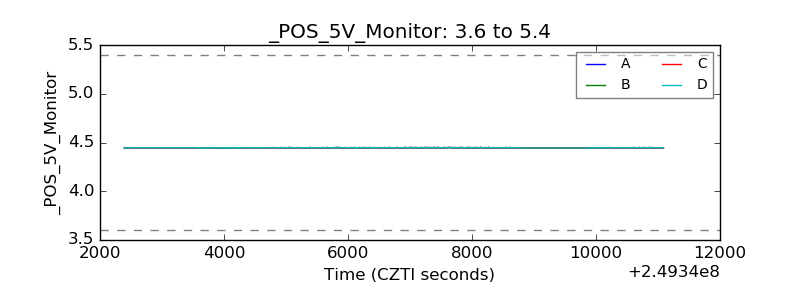 |
| _ROLL_ROT | 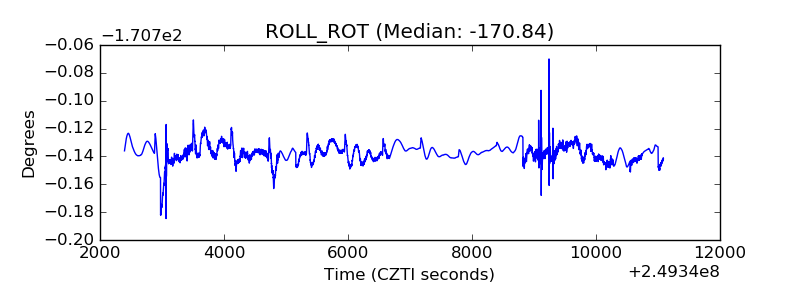 |
| _Roll_DEC |  |
| _Roll_RA | 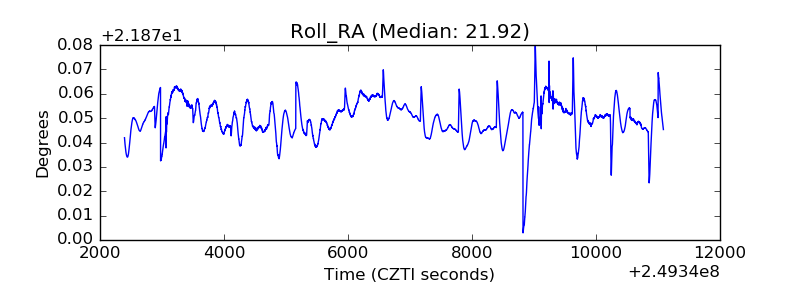 |
| Veto Counter | 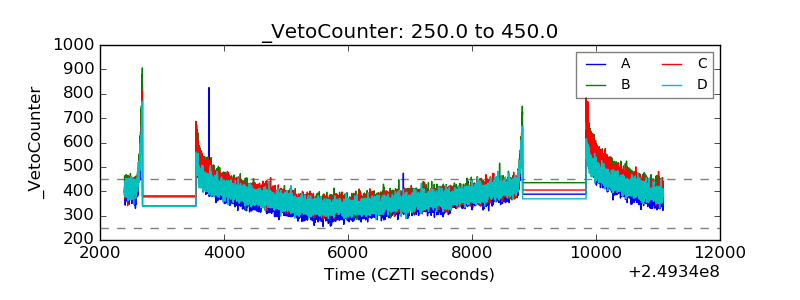 |