| Param | Original file | Final file |
|---|---|---|
| Filename | modeM0/AS1A04_227T01_9000001724_11693cztM0_level2.evt | modeM0/AS1A04_227T01_9000001724_11693cztM0_level2_quad_clean.evt |
| Size (bytes) | 496,077,120 | 74,848,320 |
| Size | 473.1 MB | 71.4 MB |
| Events in quadrant A | 3,772,278 | 460,567 |
| Events in quadrant B | 4,154,244 | 450,819 |
| Events in quadrant C | 3,097,320 | 466,788 |
| Events in quadrant D | 3,564,243 | 440,289 |
| Mode M0 | |||
|---|---|---|---|
| Quadrant | BADHDUFLAG | Total packets | Discarded packets |
| A | 0 | 15205 | 3 |
| B | 0 | 16450 | 2 |
| C | 0 | 13199 | 2 |
| D | 0 | 14600 | 2 |
| Mode SS | |||
|---|---|---|---|
| Quadrant | BADHDUFLAG | Total packets | Discarded packets |
| A | 0 | 132 | 0 |
| B | 0 | 132 | 0 |
| C | 0 | 132 | 0 |
| D | 0 | 132 | 0 |
| Mode M9 | |||
|---|---|---|---|
| Quadrant | BADHDUFLAG | Total packets | Discarded packets |
| A | 0 | 16 | 0 |
| B | 0 | 16 | 0 |
| C | 0 | 16 | 0 |
| D | 0 | 17 | 0 |
| Quadrant | Total seconds | Saturated seconds | Saturation percentage |
|---|---|---|---|
| A | 6413 | 68 | 1.060346% |
| B | 6413 | 358 | 5.582411% |
| C | 6413 | 10 | 0.155933% |
| D | 6413 | 54 | 0.842040% |
Noise dominated data is calculated using 1-second bins in cleaned event files. If a bin has >2000 counts, and if more than 50% of those come from <1% of pixels, then it is considered to be noise-dominated and hence unusable.
| Quadrant | # 1 sec bins | Bins with >0 counts | Bins with >2000 counts | High rate bins dominated by noise | Noise dominated (total time) | Noise dominated (detector-on time) | Marked lightcurve |
|---|---|---|---|---|---|---|---|
| A | 7664 | 6415 | 15 | 15 | 0.20% | 0.23% | 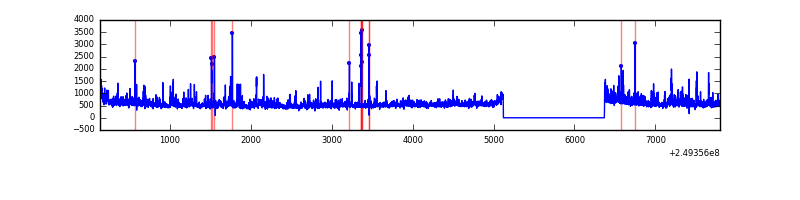 |
| B | 7664 | 6414 | 185 | 185 | 2.41% | 2.88% | 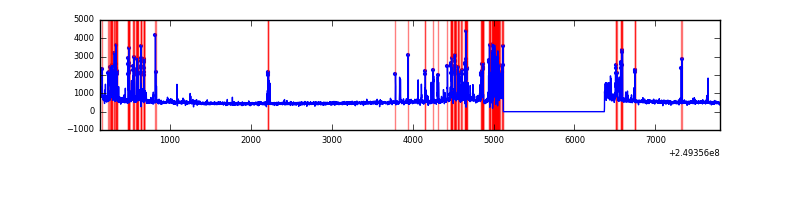 |
| C | 7664 | 6415 | 0 | 0 | 0.00% | 0.00% | 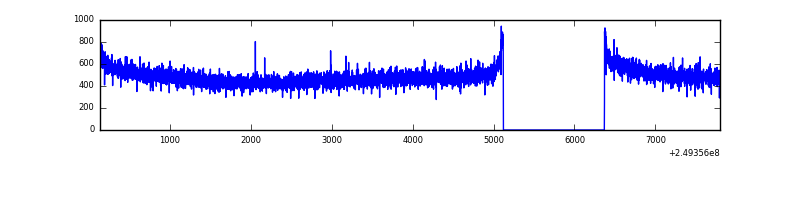 |
| D | 7664 | 6415 | 34 | 34 | 0.44% | 0.53% | 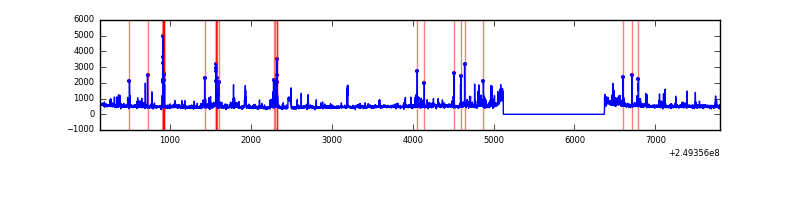 |
Top three noisy pixels from each quadrant. If the there are fewer than three noisy pixels in the level2.evt file, extra rows are filled as -1
| Pixel properties | Quadrant properties | ||||||
|---|---|---|---|---|---|---|---|
| Quadrant | DetID | PixID | Counts | Sigma | Mean | Median | Sigma |
| A | 8 | 5 | 401817 | 2482.23 | 803 | 788 | 161.6 |
| A | 1 | 162 | 107616 | 661.23 | 803 | 788 | 161.6 |
| A | 1 | 178 | 57463 | 350.8 | 803 | 788 | 161.6 |
| B | 4 | 239 | 463247 | 3087.22 | 795 | 778 | 149.8 |
| B | 3 | 64 | 402183 | 2679.59 | 795 | 778 | 149.8 |
| B | 0 | 219 | 84005 | 555.58 | 795 | 778 | 149.8 |
| C | 8 | 128 | 10579 | 53.9 | 789 | 796 | 181.5 |
| C | 8 | 112 | 5789 | 27.51 | 789 | 796 | 181.5 |
| C | 13 | 61 | 5728 | 27.17 | 789 | 796 | 181.5 |
| D | 7 | 80 | 175618 | 937.84 | 775 | 755 | 186.5 |
| D | 8 | 195 | 117290 | 625.01 | 775 | 755 | 186.5 |
| D | 13 | 104 | 93932 | 499.73 | 775 | 755 | 186.5 |
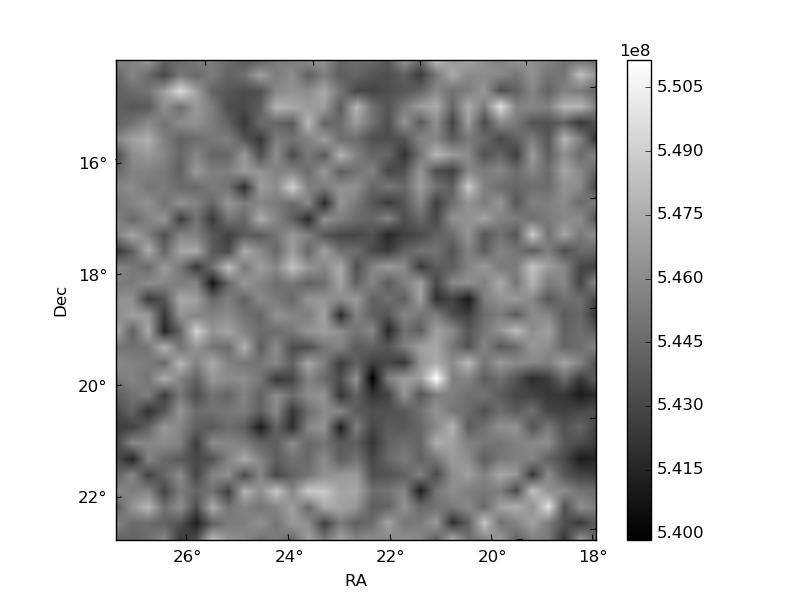
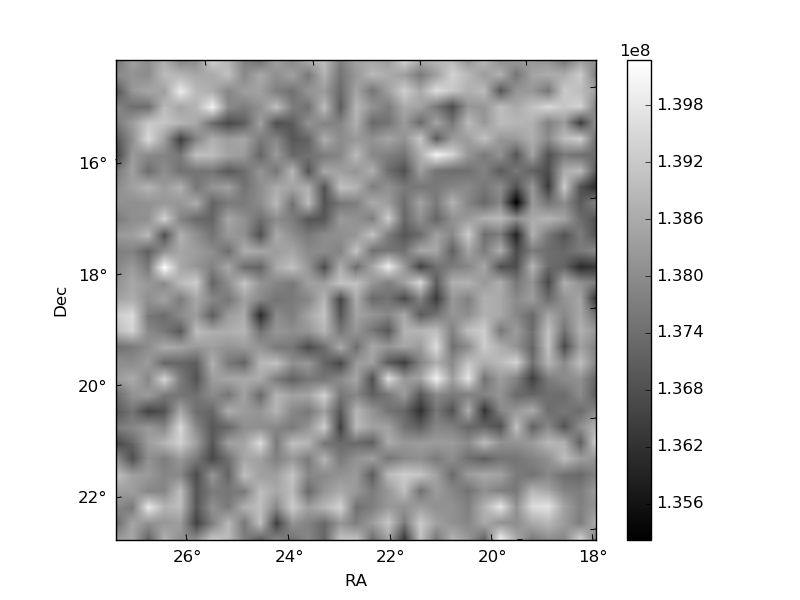
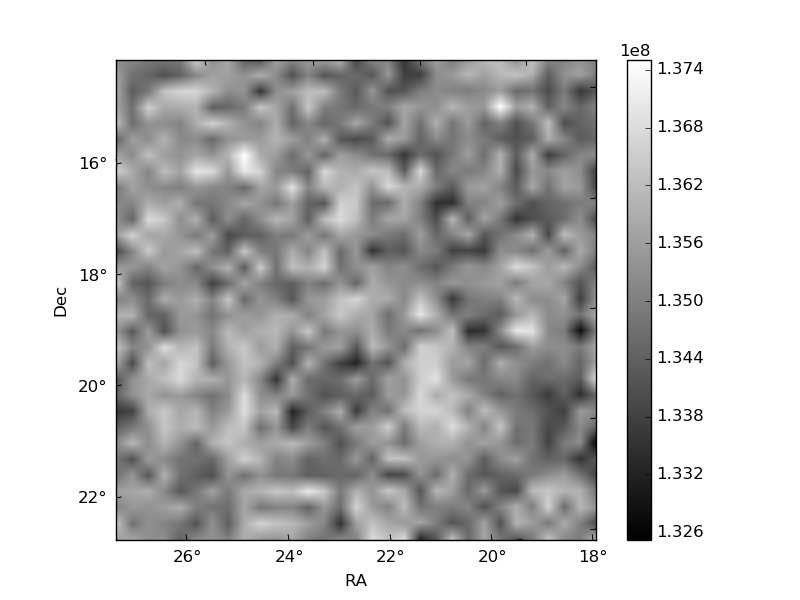
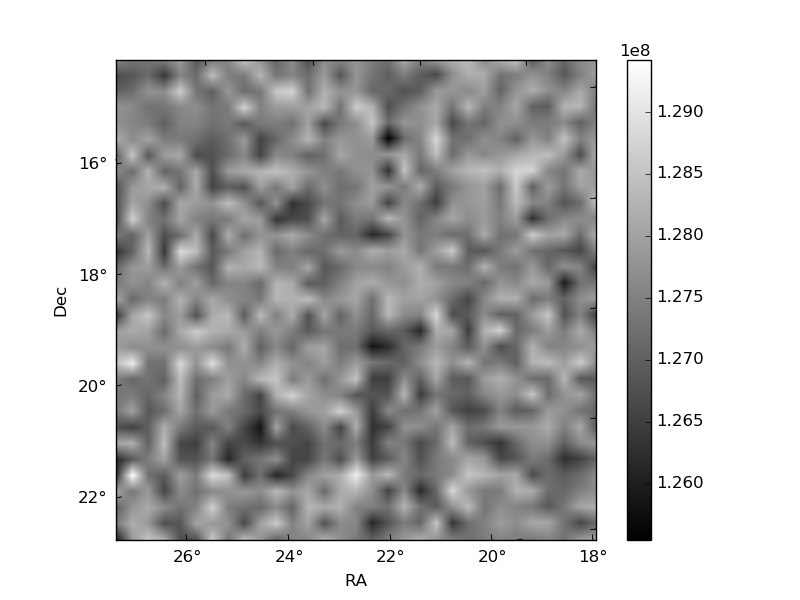
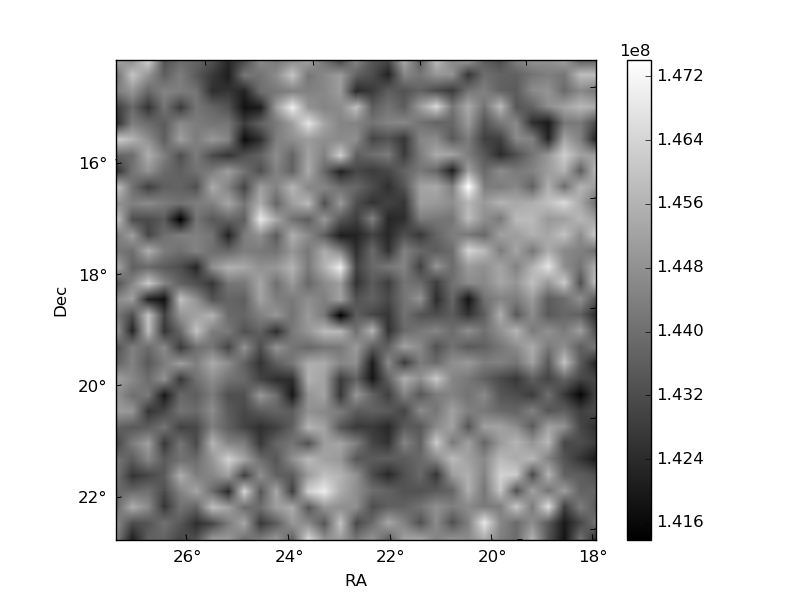
Histogram calculated using DETX and DETY for each event in the final _common_clean file
| Quadrant A | 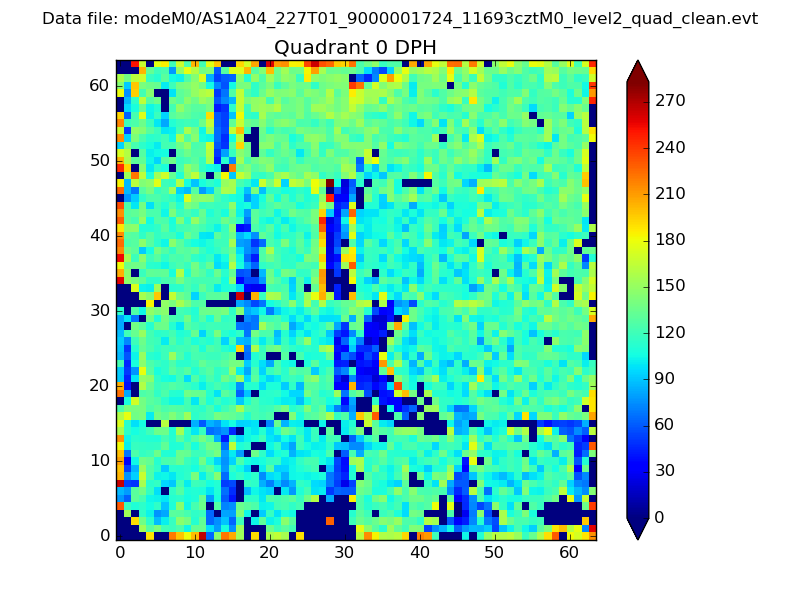 |
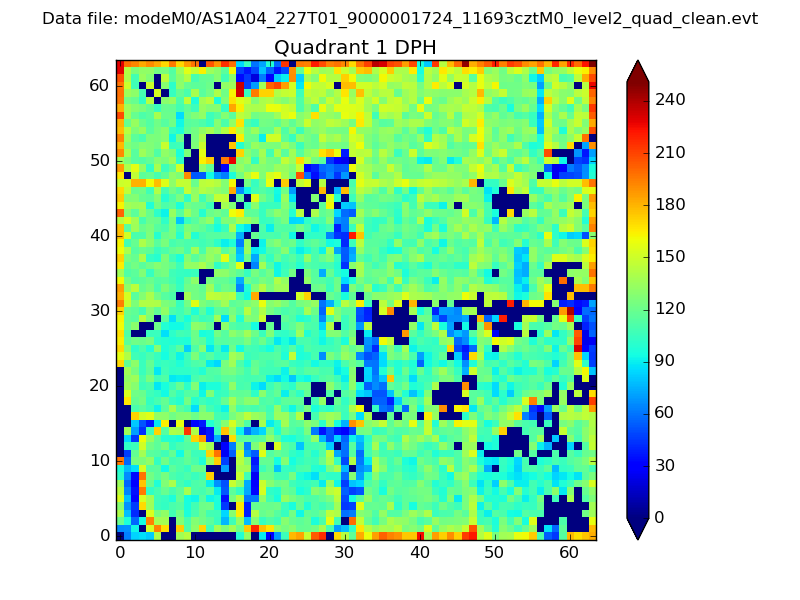 |
Quadrant B |
|---|---|---|---|
| Quadrant D | 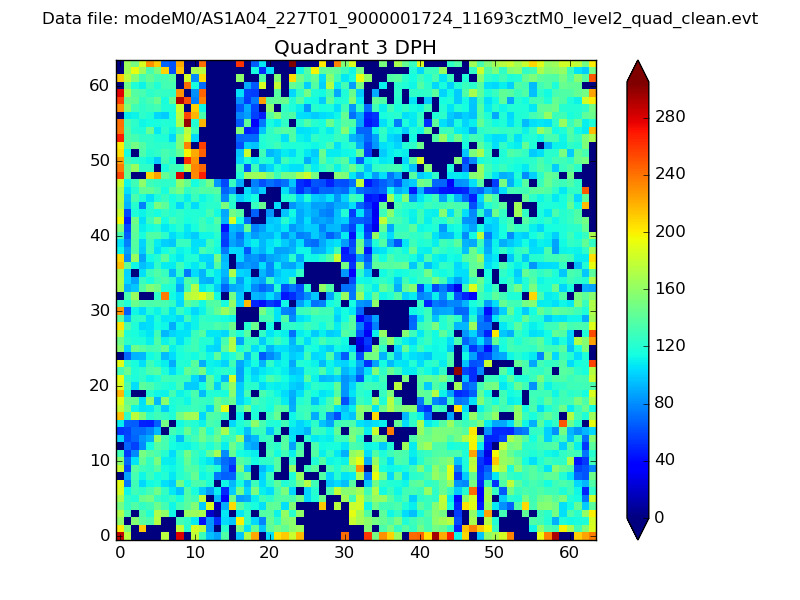 |
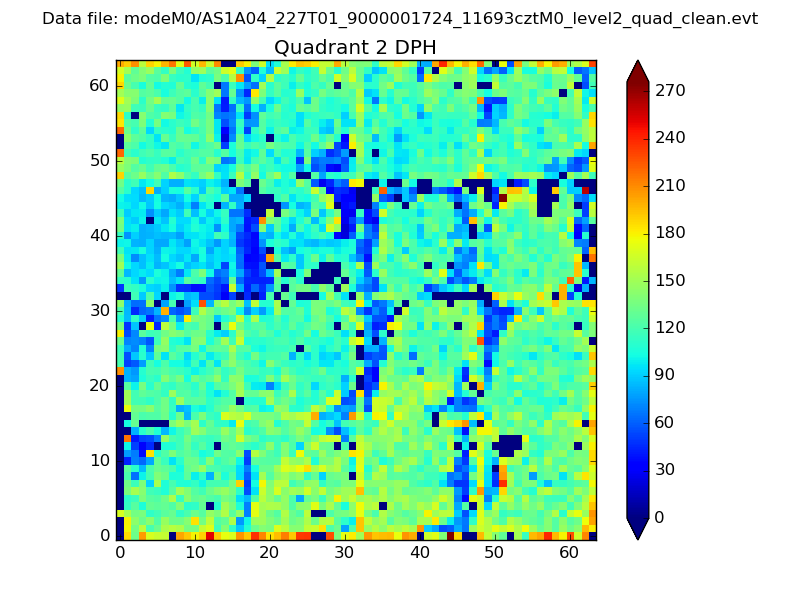 |
Quadrant C |
| Plot type | Count rate plots | Images |
|---|---|---|
| Comparison with Poisson distribution Blue bars denote a histogram of data divided into 1 sec bins. Red curve is a Poisson curve with rate = median count rate of data. |
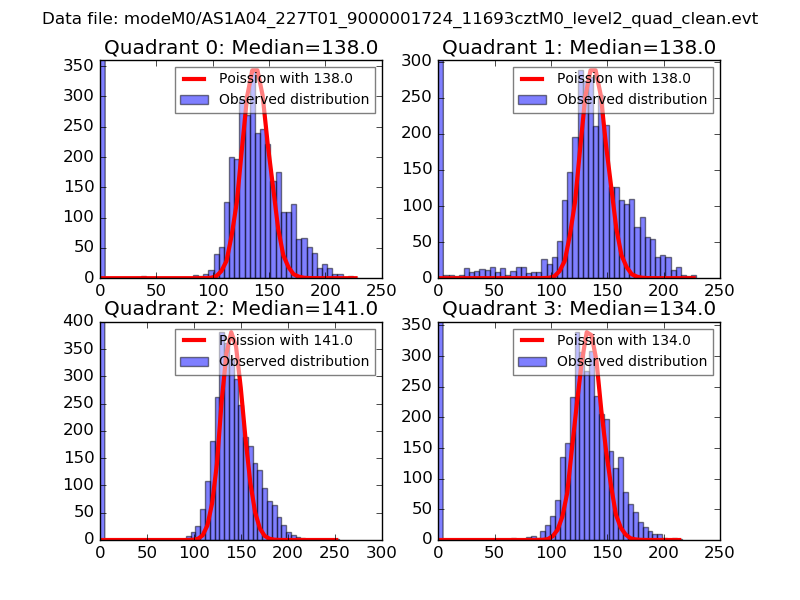 |
 |
| Quadrant-wise count rates Data is divided into 100 sec bins |
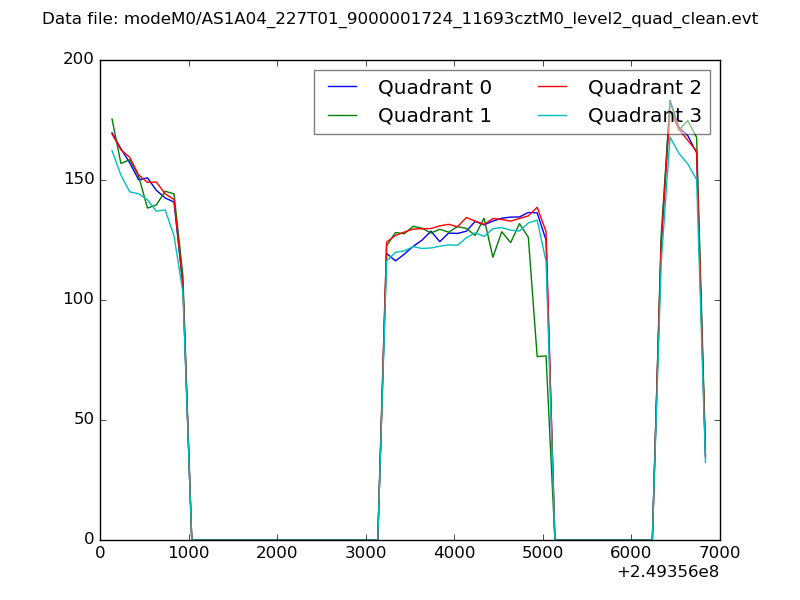 |
|
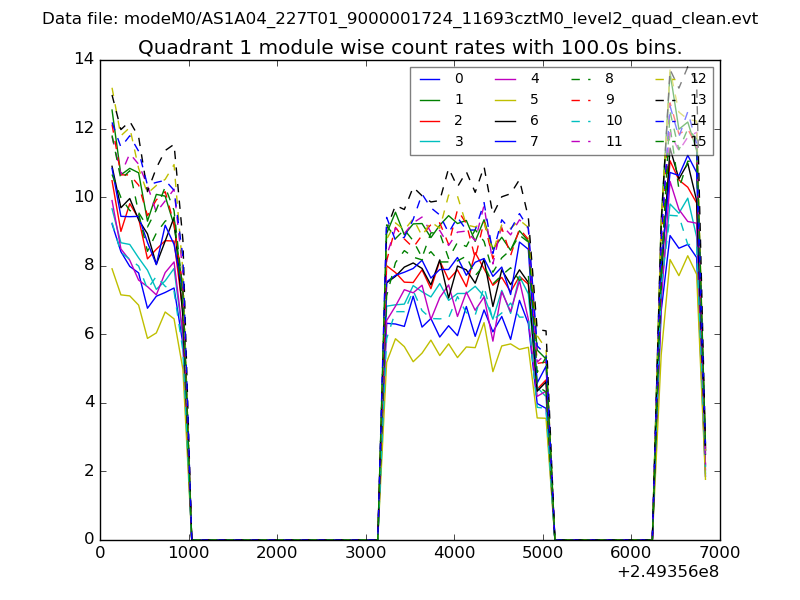
| Module-wise count rates for Quadrant A Data is divided into 100 sec bins |
 |
 |
| Module-wise count rates for Quadrant B Data is divided into 100 sec bins |
 |
 |
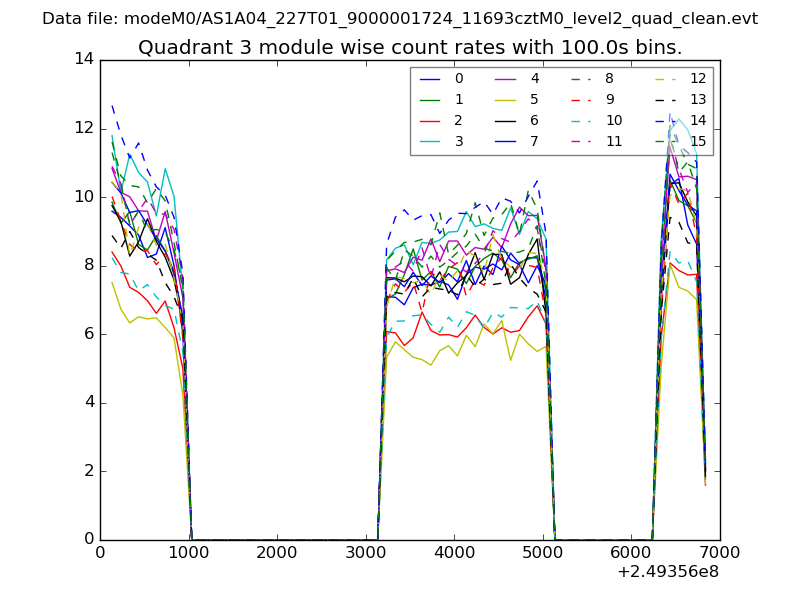
| Module-wise count rates for Quadrant C Data is divided into 100 sec bins |
 |
 |
| Module-wise count rates for Quadrant D Data is divided into 100 sec bins |
 |
 |
| Parameter | Plot |
|---|---|
| CZT HV Monitor |  |
| D_VDD | 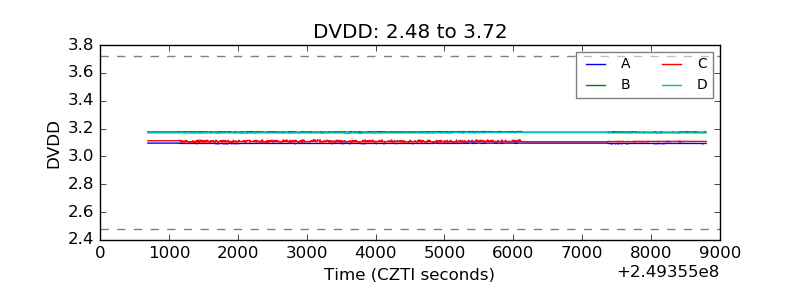 |
| Temperature 1 | 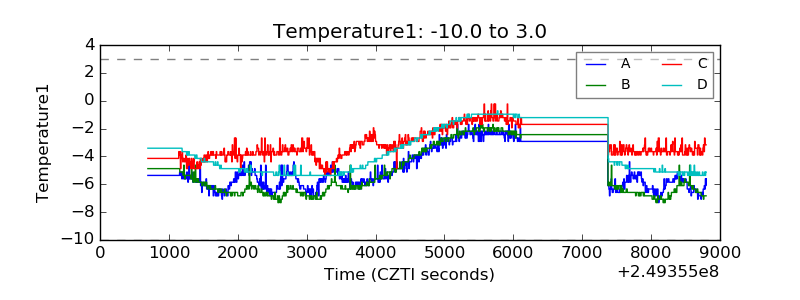 |
| Veto HV Monitor | 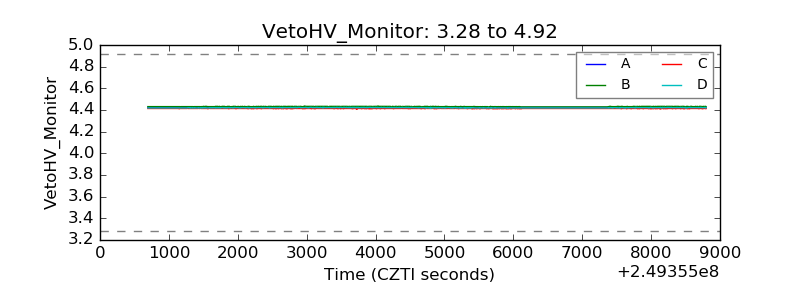 |
| Veto LLD | 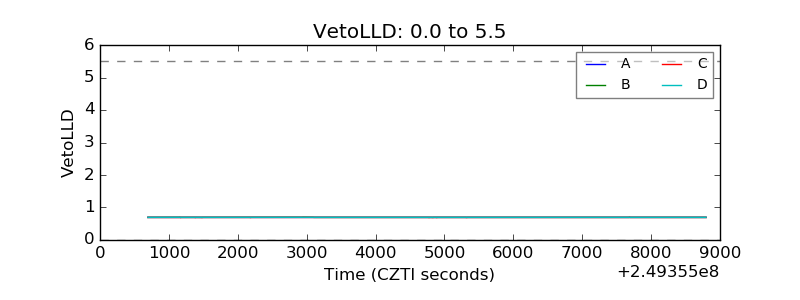 |
| Alpha Counter | 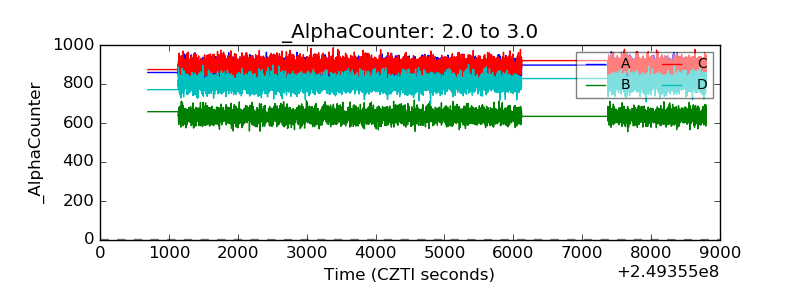 |
| _CPM_Rate | 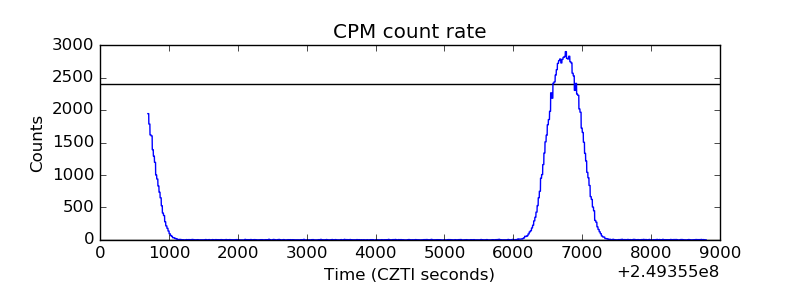 |
| CZT Counter | 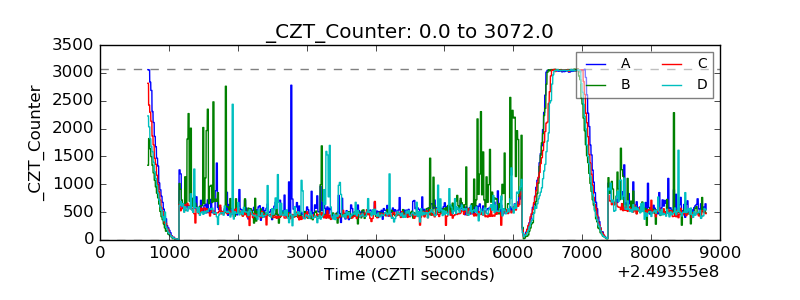 |
| +2.5 Volts monitor |  |
| +5 Volts monitor |  |
| _ROLL_ROT | 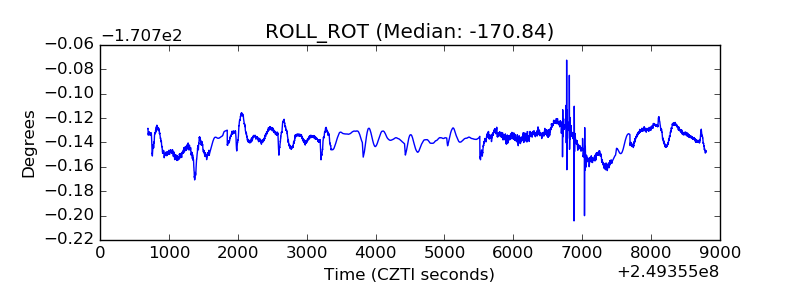 |
| _Roll_DEC | 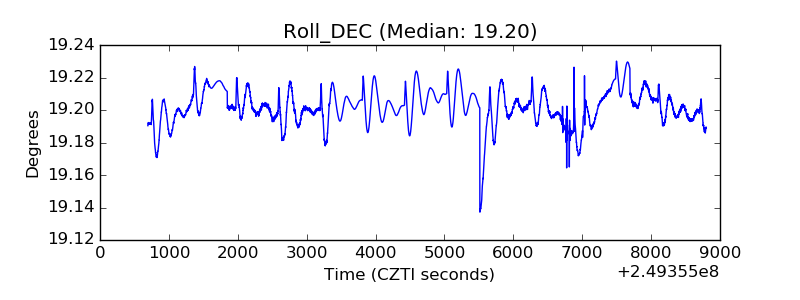 |
| _Roll_RA | 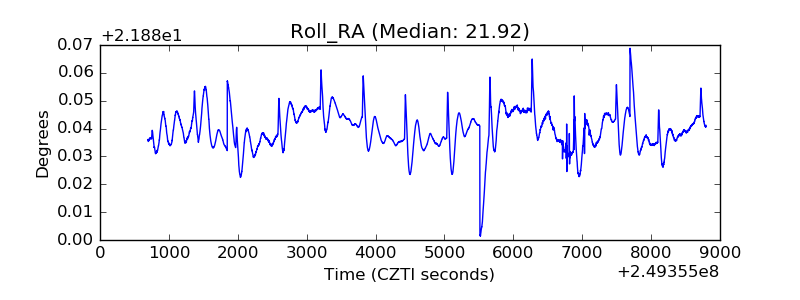 |
| Veto Counter | 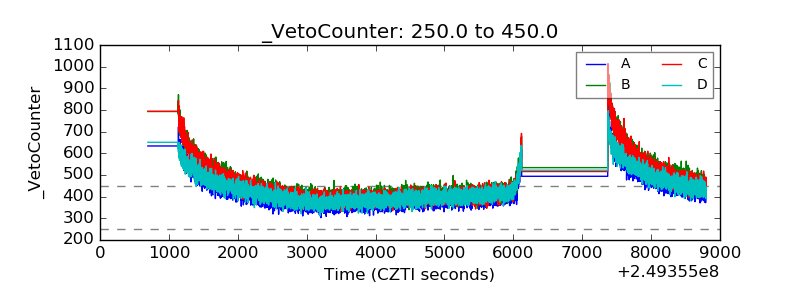 |