| Param | Original file | Final file |
|---|---|---|
| Filename | modeM0/AS1A04_227T01_9000001724_11694cztM0_level2.evt | modeM0/AS1A04_227T01_9000001724_11694cztM0_level2_quad_clean.evt |
| Size (bytes) | 498,571,200 | 66,683,520 |
| Size | 475.5 MB | 63.6 MB |
| Events in quadrant A | 4,231,894 | 394,789 |
| Events in quadrant B | 3,858,892 | 399,464 |
| Events in quadrant C | 3,122,687 | 403,180 |
| Events in quadrant D | 3,459,674 | 382,905 |
| Mode M0 | |||
|---|---|---|---|
| Quadrant | BADHDUFLAG | Total packets | Discarded packets |
| A | 0 | 16887 | 3 |
| B | 0 | 15316 | 2 |
| C | 0 | 13098 | 2 |
| D | 0 | 14269 | 2 |
| Mode SS | |||
|---|---|---|---|
| Quadrant | BADHDUFLAG | Total packets | Discarded packets |
| A | 0 | 126 | 0 |
| B | 0 | 126 | 0 |
| C | 0 | 126 | 0 |
| D | 0 | 126 | 0 |
| Mode M9 | |||
|---|---|---|---|
| Quadrant | BADHDUFLAG | Total packets | Discarded packets |
| A | 0 | 14 | 0 |
| B | 0 | 14 | 0 |
| C | 0 | 14 | 0 |
| D | 0 | 15 | 0 |
| Quadrant | Total seconds | Saturated seconds | Saturation percentage |
|---|---|---|---|
| A | 6290 | 95 | 1.510334% |
| B | 6290 | 183 | 2.909380% |
| C | 6290 | 11 | 0.174881% |
| D | 6290 | 28 | 0.445151% |
Noise dominated data is calculated using 1-second bins in cleaned event files. If a bin has >2000 counts, and if more than 50% of those come from <1% of pixels, then it is considered to be noise-dominated and hence unusable.
| Quadrant | # 1 sec bins | Bins with >0 counts | Bins with >2000 counts | High rate bins dominated by noise | Noise dominated (total time) | Noise dominated (detector-on time) | Marked lightcurve |
|---|---|---|---|---|---|---|---|
| A | 7606 | 6292 | 21 | 21 | 0.28% | 0.33% | 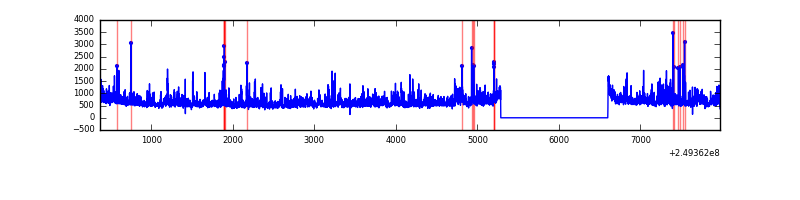 |
| B | 7606 | 6292 | 80 | 80 | 1.05% | 1.27% | 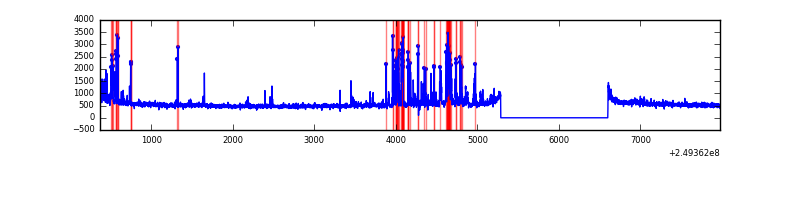 |
| C | 7606 | 6292 | 0 | 0 | 0.00% | 0.00% | 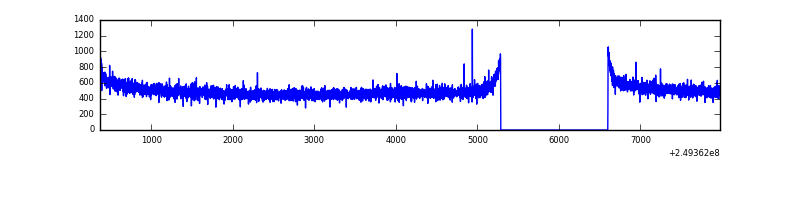 |
| D | 7606 | 6292 | 15 | 15 | 0.20% | 0.24% | 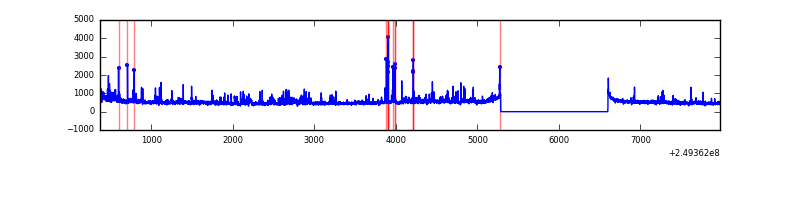 |
Top three noisy pixels from each quadrant. If the there are fewer than three noisy pixels in the level2.evt file, extra rows are filled as -1
| Pixel properties | Quadrant properties | ||||||
|---|---|---|---|---|---|---|---|
| Quadrant | DetID | PixID | Counts | Sigma | Mean | Median | Sigma |
| A | 8 | 5 | 568103 | 3511.46 | 817 | 804 | 161.6 |
| A | 1 | 162 | 157306 | 968.71 | 817 | 804 | 161.6 |
| A | 5 | 112 | 105426 | 647.59 | 817 | 804 | 161.6 |
| B | 4 | 239 | 460502 | 2974.09 | 823 | 807 | 154.6 |
| B | 3 | 64 | 73365 | 469.43 | 823 | 807 | 154.6 |
| B | 15 | 204 | 64542 | 412.35 | 823 | 807 | 154.6 |
| C | 13 | 61 | 5880 | 27.46 | 800 | 805 | 184.8 |
| C | 12 | 4 | 2025 | 6.6 | 800 | 805 | 184.8 |
| C | 3 | 202 | 1861 | 5.71 | 800 | 805 | 184.8 |
| D | 1 | 52 | 138709 | 734.6 | 787 | 769 | 187.8 |
| D | 13 | 104 | 86325 | 455.63 | 787 | 769 | 187.8 |
| D | 8 | 195 | 84761 | 447.3 | 787 | 769 | 187.8 |
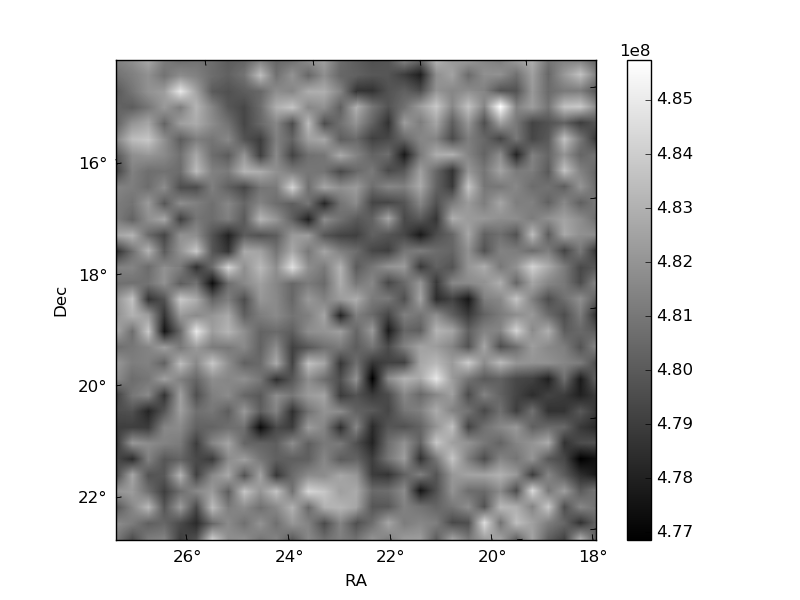
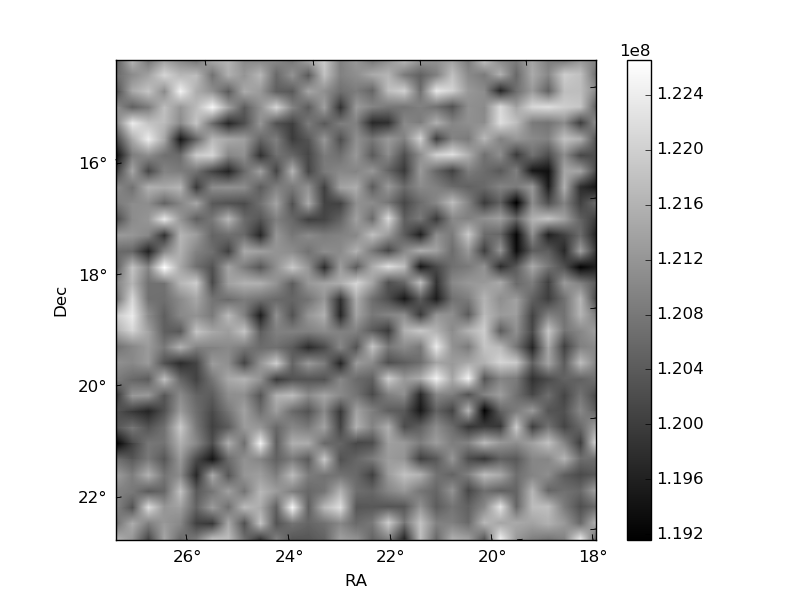
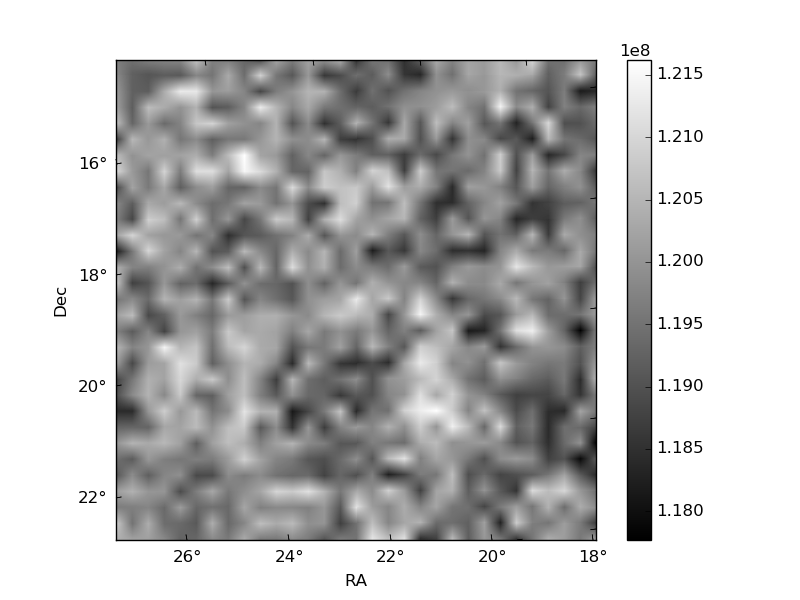
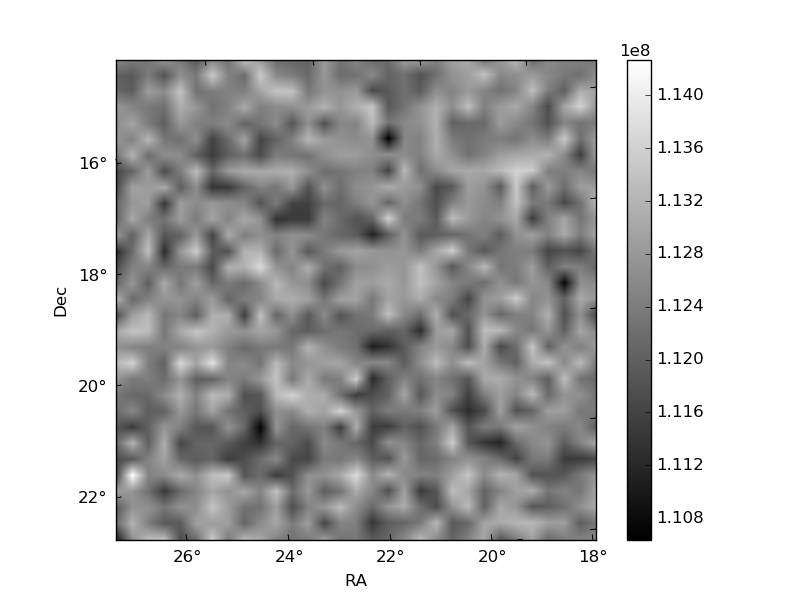
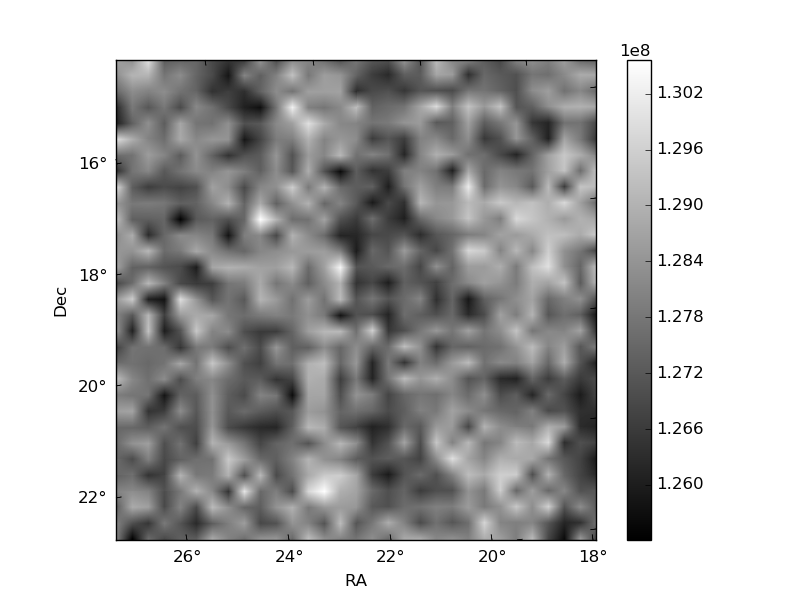
Histogram calculated using DETX and DETY for each event in the final _common_clean file
| Quadrant A | 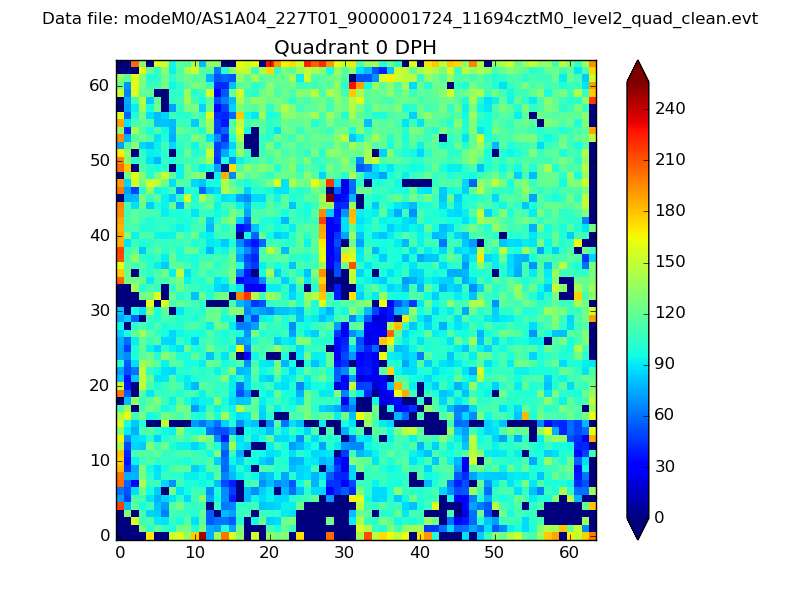 |
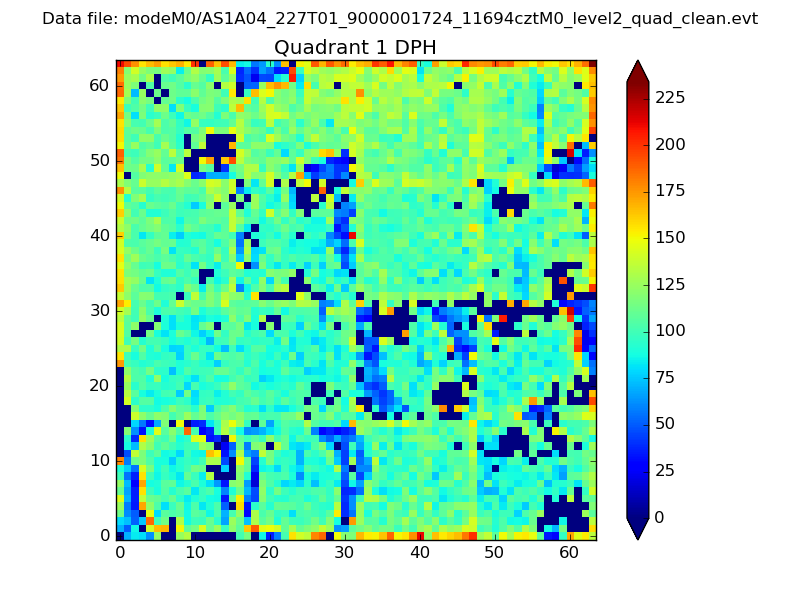 |
Quadrant B |
|---|---|---|---|
| Quadrant D |  |
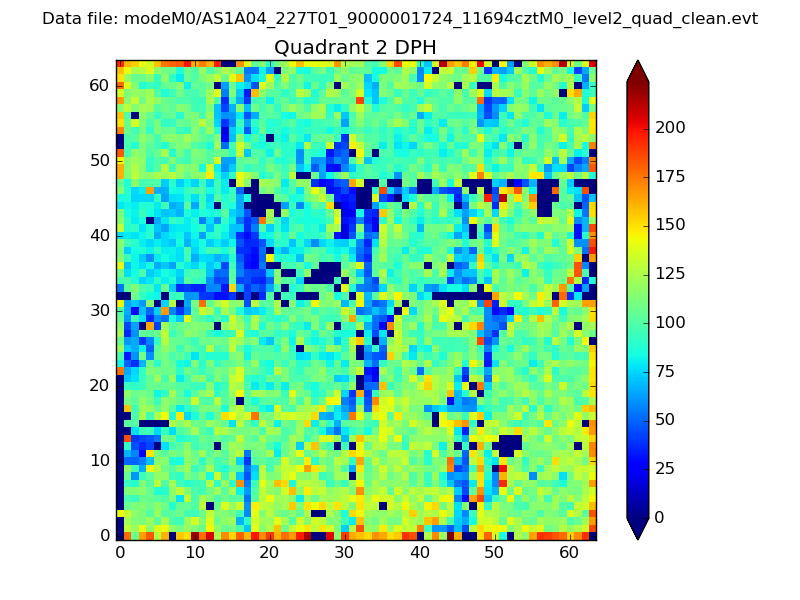 |
Quadrant C |
| Plot type | Count rate plots | Images |
|---|---|---|
| Comparison with Poisson distribution Blue bars denote a histogram of data divided into 1 sec bins. Red curve is a Poisson curve with rate = median count rate of data. |
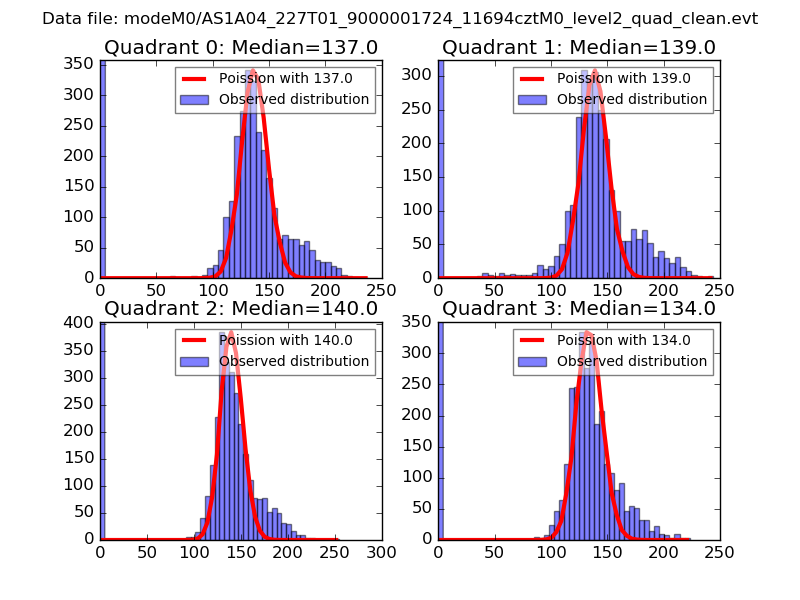 |
 |
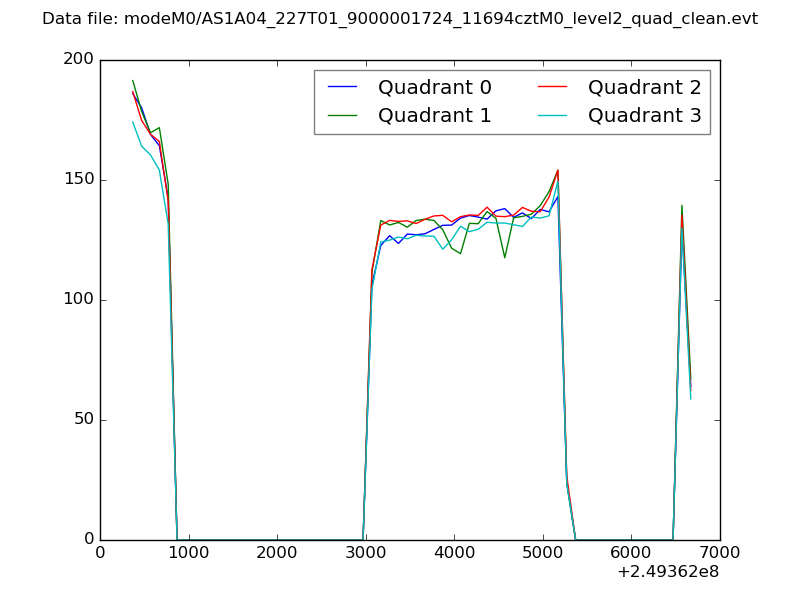
| Quadrant-wise count rates Data is divided into 100 sec bins |
 |
|
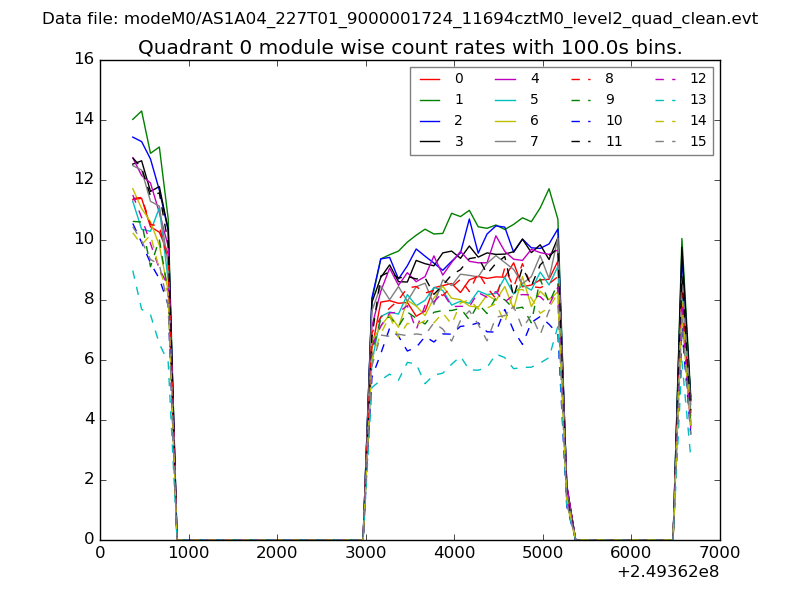
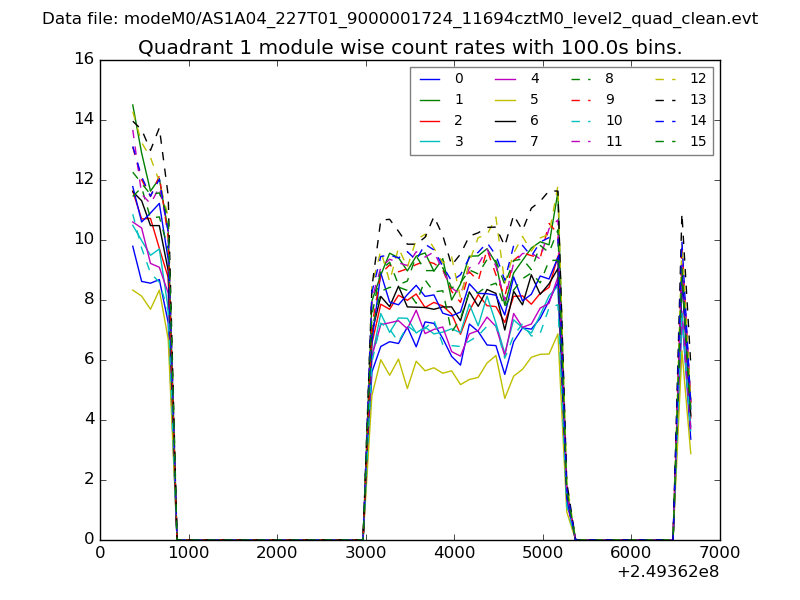
| Module-wise count rates for Quadrant A Data is divided into 100 sec bins |
 |
 |
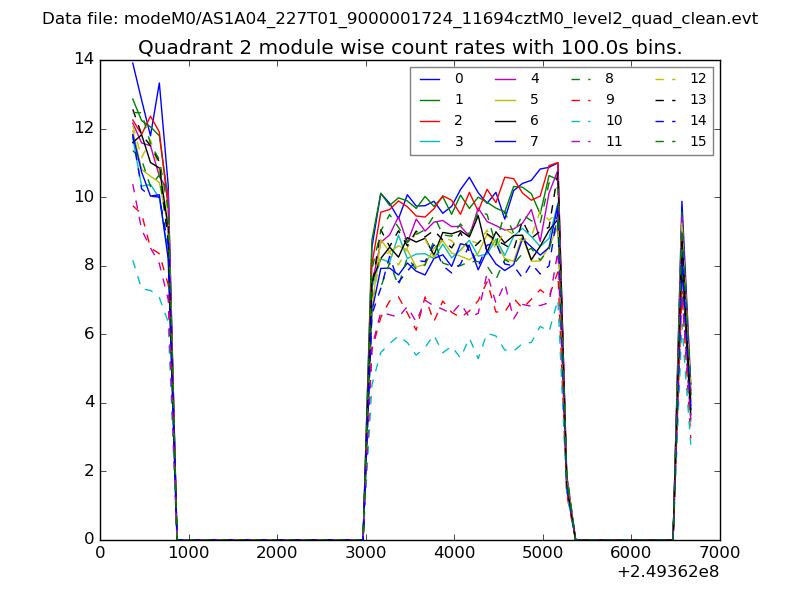
| Module-wise count rates for Quadrant B Data is divided into 100 sec bins |
 |
 |
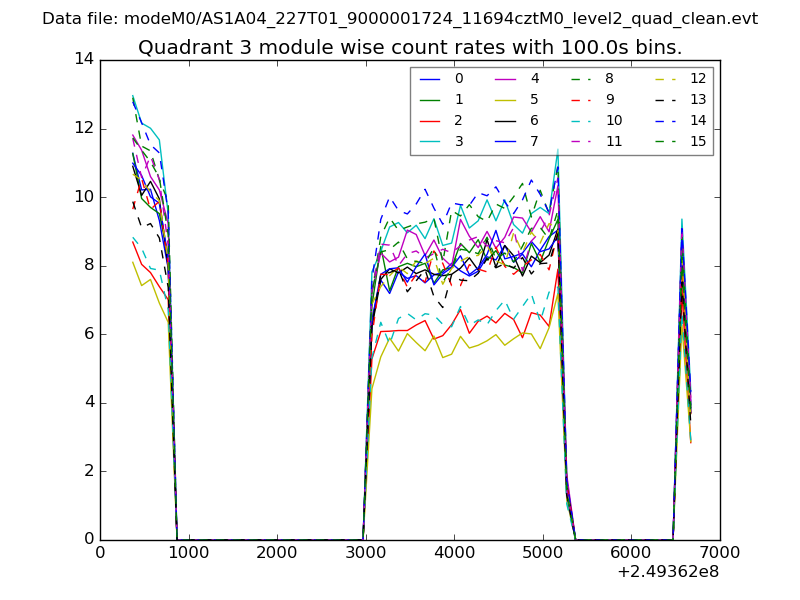
| Module-wise count rates for Quadrant C Data is divided into 100 sec bins |
 |
 |
| Module-wise count rates for Quadrant D Data is divided into 100 sec bins |
 |
 |
| Parameter | Plot |
|---|---|
| CZT HV Monitor | 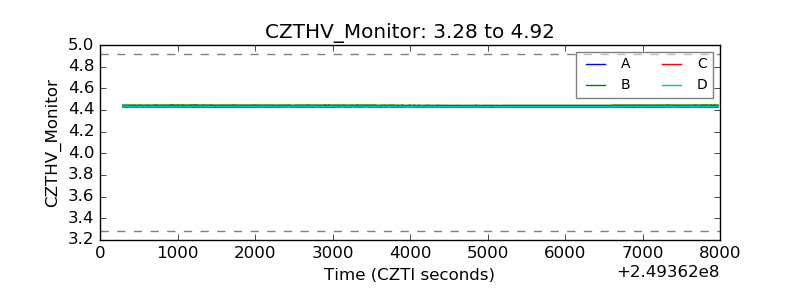 |
| D_VDD |  |
| Temperature 1 | 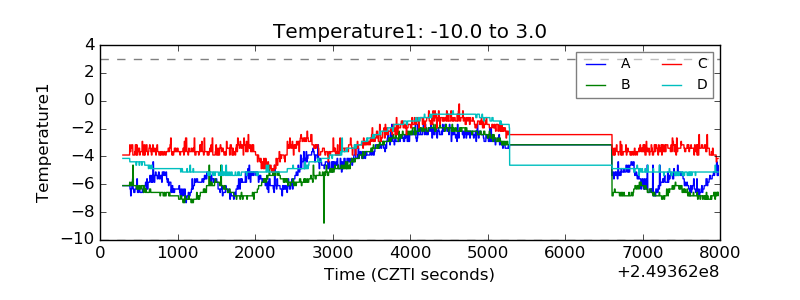 |
| Veto HV Monitor | 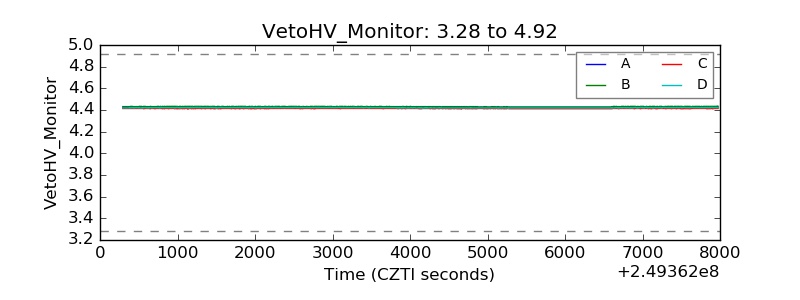 |
| Veto LLD |  |
| Alpha Counter | 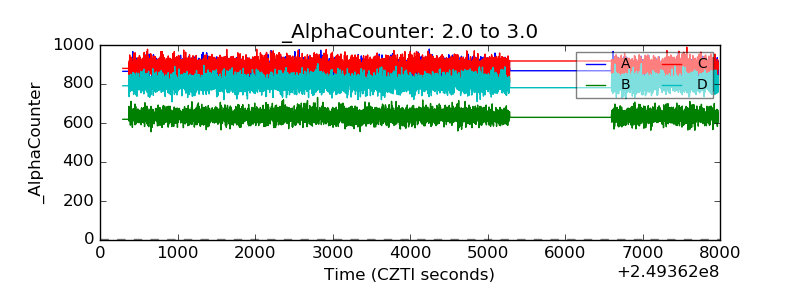 |
| _CPM_Rate | 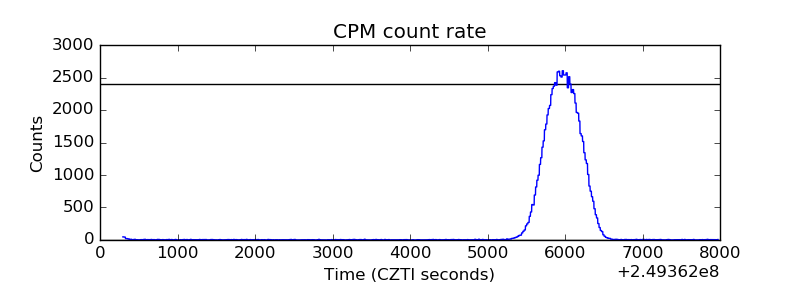 |
| CZT Counter | 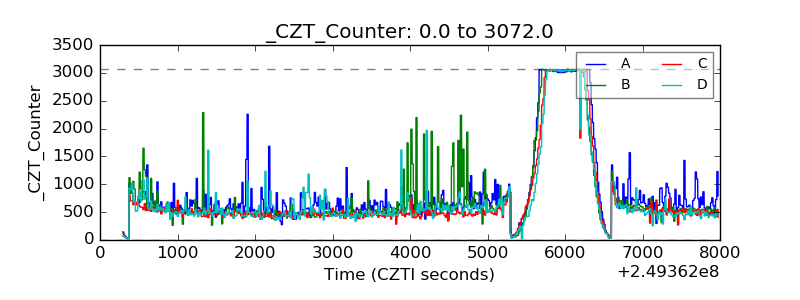 |
| +2.5 Volts monitor |  |
| +5 Volts monitor |  |
| _ROLL_ROT | 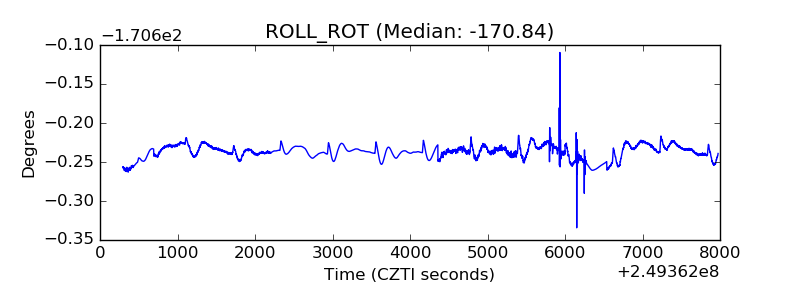 |
| _Roll_DEC | 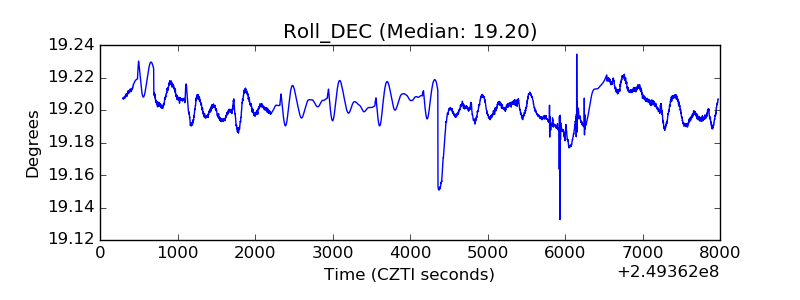 |
| _Roll_RA | 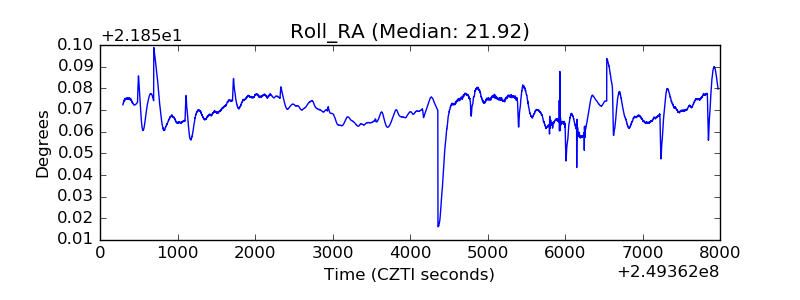 |
| Veto Counter | 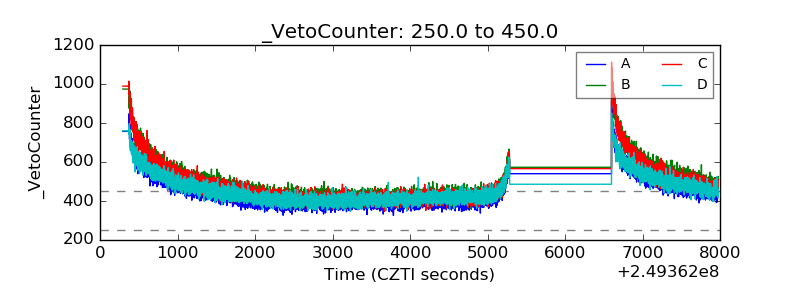 |