| Param | Original file | Final file |
|---|---|---|
| Filename | modeM0/AS1A04_227T01_9000001724_11696cztM0_level2.evt | modeM0/AS1A04_227T01_9000001724_11696cztM0_level2_quad_clean.evt |
| Size (bytes) | 555,698,880 | 68,307,840 |
| Size | 530.0 MB | 65.1 MB |
| Events in quadrant A | 4,282,613 | 406,742 |
| Events in quadrant B | 4,381,670 | 404,219 |
| Events in quadrant C | 3,144,107 | 416,825 |
| Events in quadrant D | 4,588,842 | 395,501 |
| Mode M0 | |||
|---|---|---|---|
| Quadrant | BADHDUFLAG | Total packets | Discarded packets |
| A | 0 | 16889 | 3 |
| B | 0 | 16898 | 2 |
| C | 0 | 13298 | 2 |
| D | 0 | 17674 | 2 |
| Mode SS | |||
|---|---|---|---|
| Quadrant | BADHDUFLAG | Total packets | Discarded packets |
| A | 0 | 130 | 0 |
| B | 0 | 130 | 0 |
| C | 0 | 130 | 0 |
| D | 0 | 130 | 0 |
| Mode M9 | |||
|---|---|---|---|
| Quadrant | BADHDUFLAG | Total packets | Discarded packets |
| A | 0 | 19 | 0 |
| B | 0 | 19 | 0 |
| C | 0 | 19 | 0 |
| D | 0 | 20 | 0 |
| Quadrant | Total seconds | Saturated seconds | Saturation percentage |
|---|---|---|---|
| A | 6373 | 235 | 3.687431% |
| B | 6373 | 348 | 5.460537% |
| C | 6373 | 50 | 0.784560% |
| D | 6373 | 498 | 7.814216% |
Noise dominated data is calculated using 1-second bins in cleaned event files. If a bin has >2000 counts, and if more than 50% of those come from <1% of pixels, then it is considered to be noise-dominated and hence unusable.
| Quadrant | # 1 sec bins | Bins with >0 counts | Bins with >2000 counts | High rate bins dominated by noise | Noise dominated (total time) | Noise dominated (detector-on time) | Marked lightcurve |
|---|---|---|---|---|---|---|---|
| A | 7609 | 6376 | 48 | 48 | 0.63% | 0.75% | 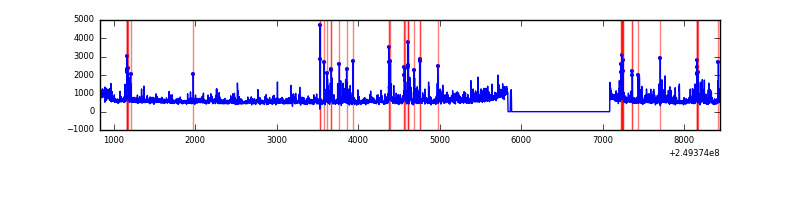 |
| B | 7609 | 6376 | 145 | 145 | 1.91% | 2.27% | 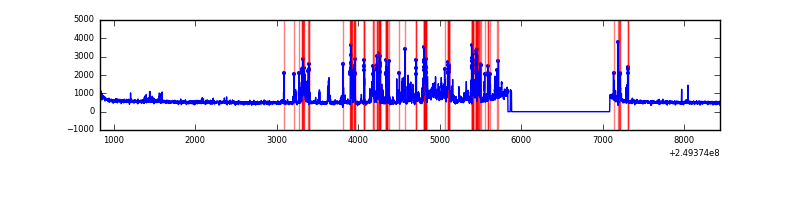 |
| C | 7609 | 6376 | 0 | 0 | 0.00% | 0.00% | 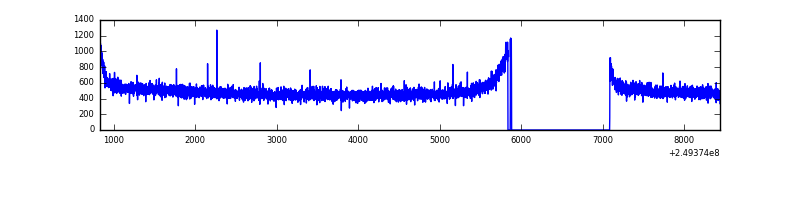 |
| D | 7609 | 6376 | 442 | 442 | 5.81% | 6.93% | 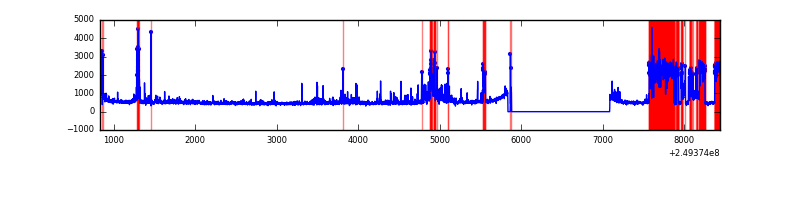 |
Top three noisy pixels from each quadrant. If the there are fewer than three noisy pixels in the level2.evt file, extra rows are filled as -1
| Pixel properties | Quadrant properties | ||||||
|---|---|---|---|---|---|---|---|
| Quadrant | DetID | PixID | Counts | Sigma | Mean | Median | Sigma |
| A | 8 | 5 | 609558 | 3647.78 | 826 | 812 | 166.9 |
| A | 1 | 162 | 178500 | 1064.76 | 826 | 812 | 166.9 |
| A | 1 | 178 | 94668 | 562.41 | 826 | 812 | 166.9 |
| B | 3 | 64 | 674586 | 4293.48 | 825 | 808 | 156.9 |
| B | 4 | 239 | 395679 | 2516.22 | 825 | 808 | 156.9 |
| B | 15 | 204 | 58879 | 370.04 | 825 | 808 | 156.9 |
| C | 13 | 61 | 5971 | 27.81 | 806 | 812 | 185.5 |
| C | 3 | 202 | 1947 | 6.12 | 806 | 812 | 185.5 |
| C | 8 | 222 | 1848 | 5.58 | 806 | 812 | 185.5 |
| D | 13 | 152 | 948664 | 5013.49 | 784 | 764 | 189.1 |
| D | 13 | 122 | 188041 | 990.52 | 784 | 764 | 189.1 |
| D | 1 | 52 | 165542 | 871.52 | 784 | 764 | 189.1 |
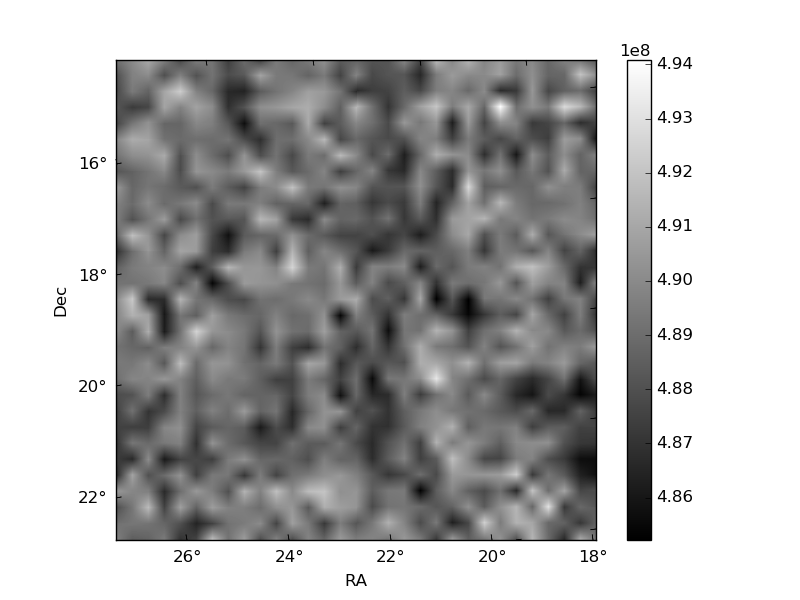
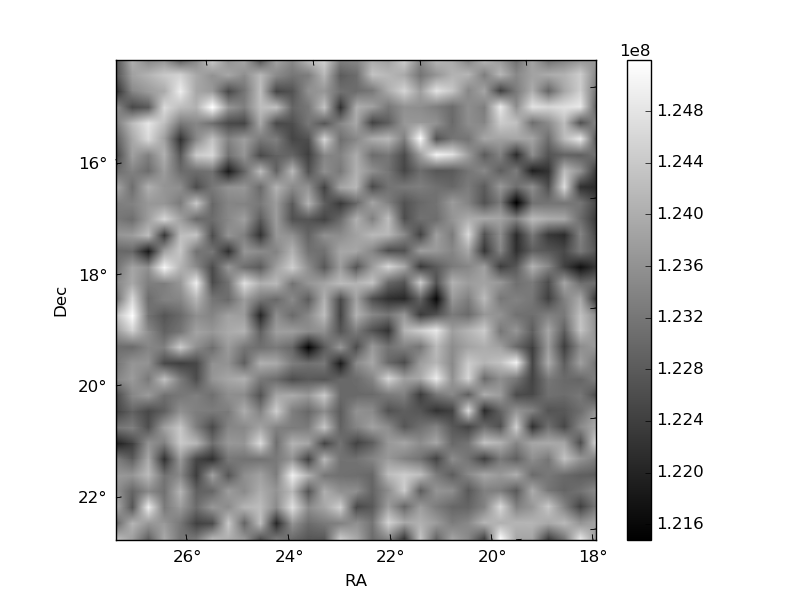
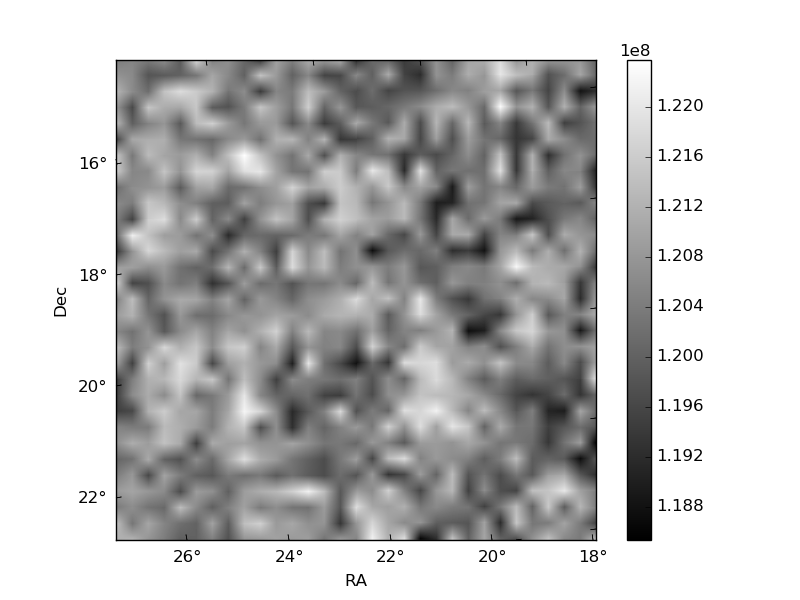
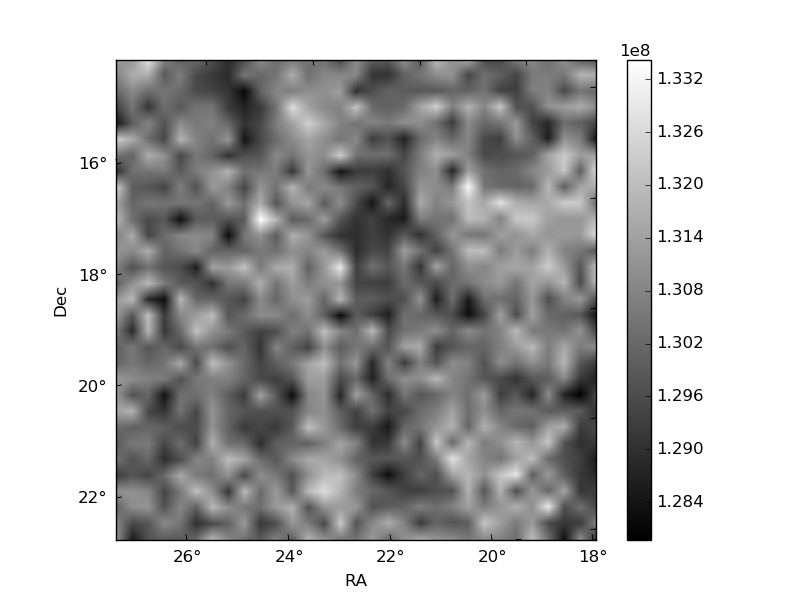
Histogram calculated using DETX and DETY for each event in the final _common_clean file
| Quadrant A | 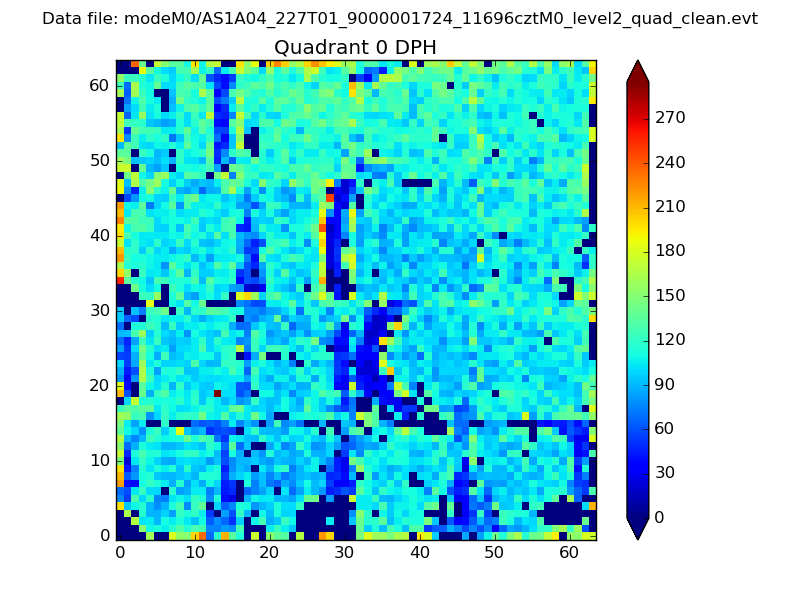 |
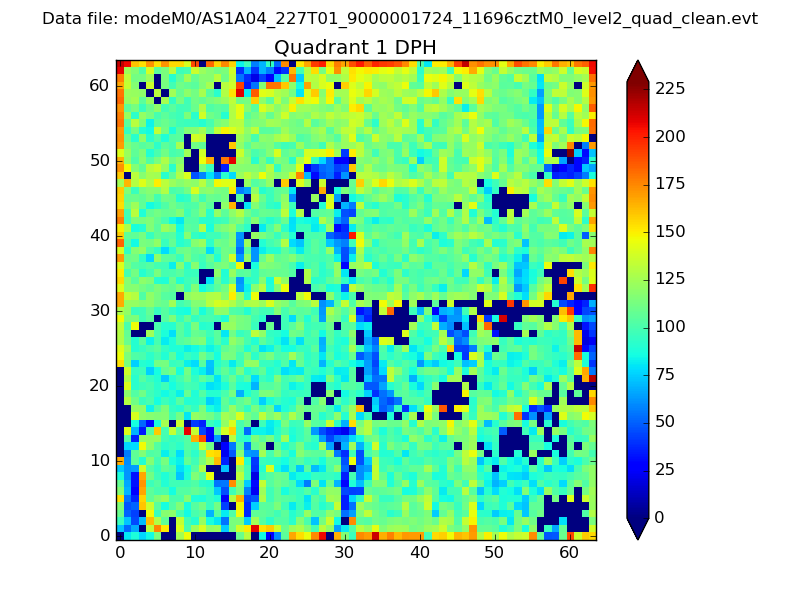 |
Quadrant B |
|---|---|---|---|
| Quadrant D | 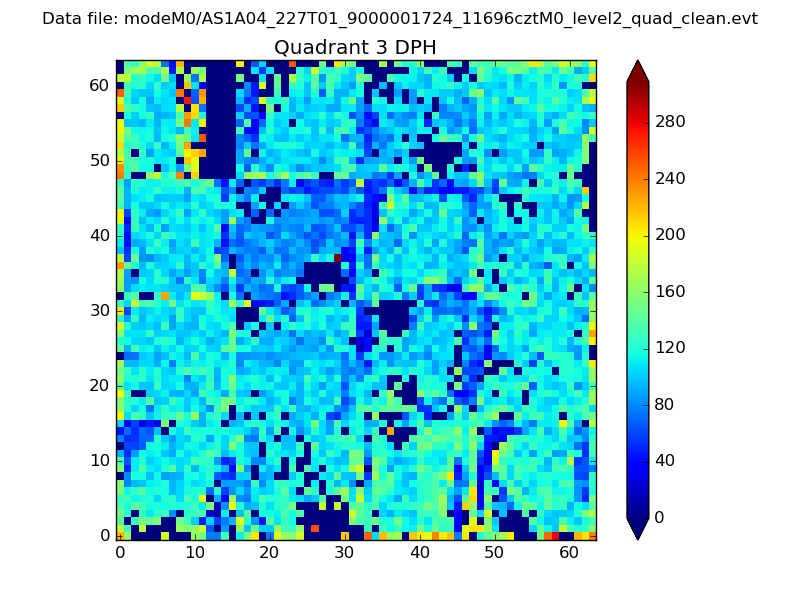 |
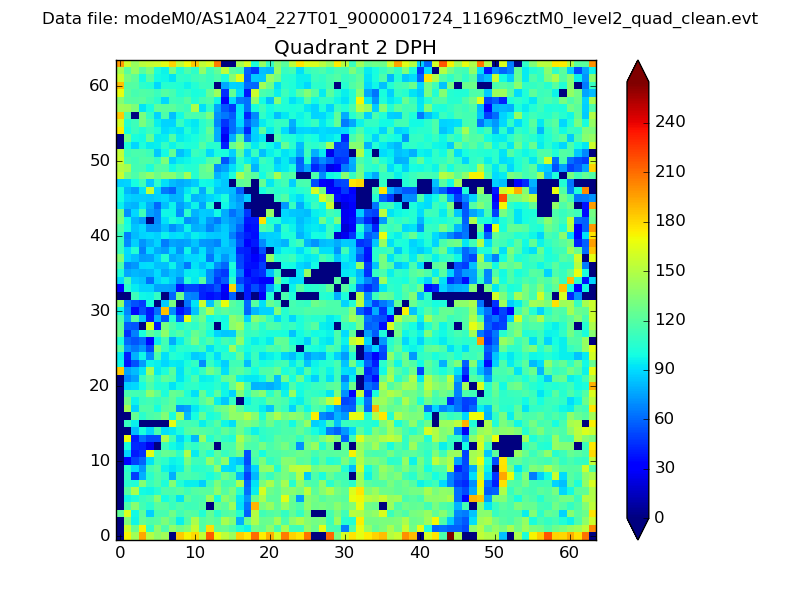 |
Quadrant C |
| Plot type | Count rate plots | Images |
|---|---|---|
| Comparison with Poisson distribution Blue bars denote a histogram of data divided into 1 sec bins. Red curve is a Poisson curve with rate = median count rate of data. |
 |
 |
| Quadrant-wise count rates Data is divided into 100 sec bins |
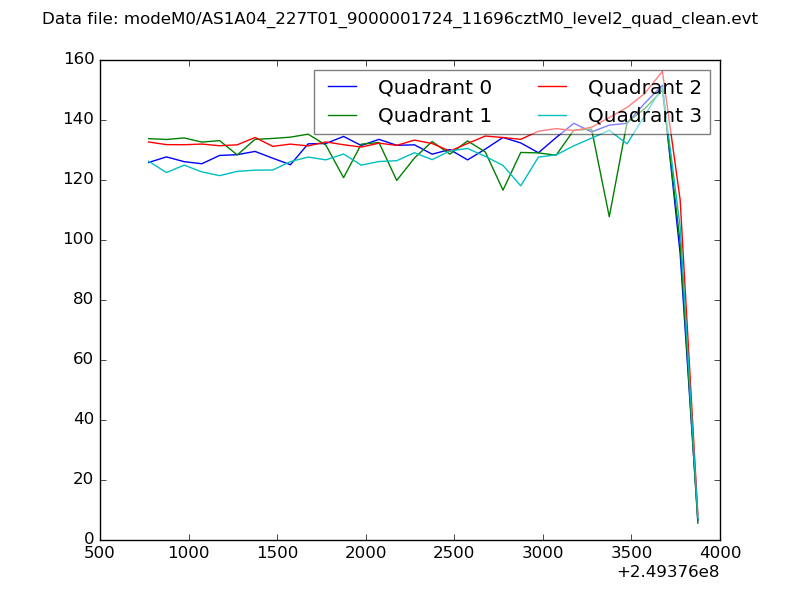 |
|
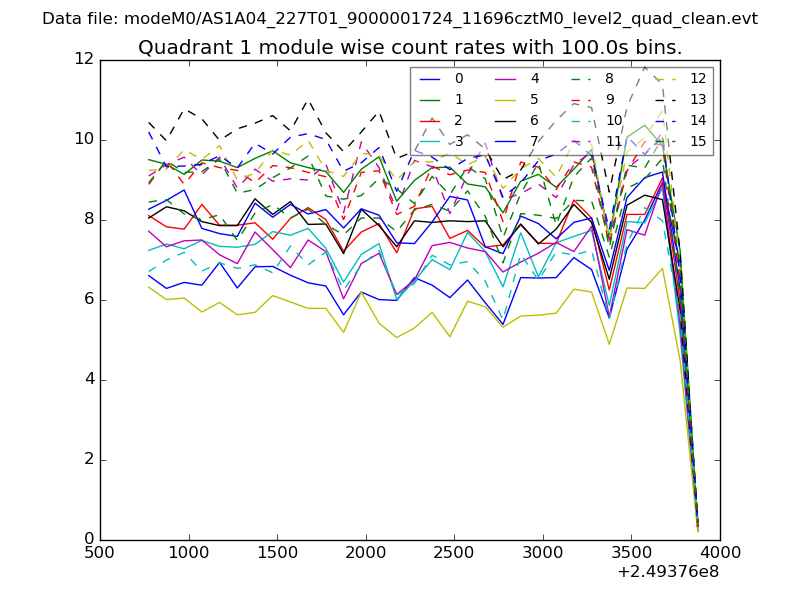
| Module-wise count rates for Quadrant A Data is divided into 100 sec bins |
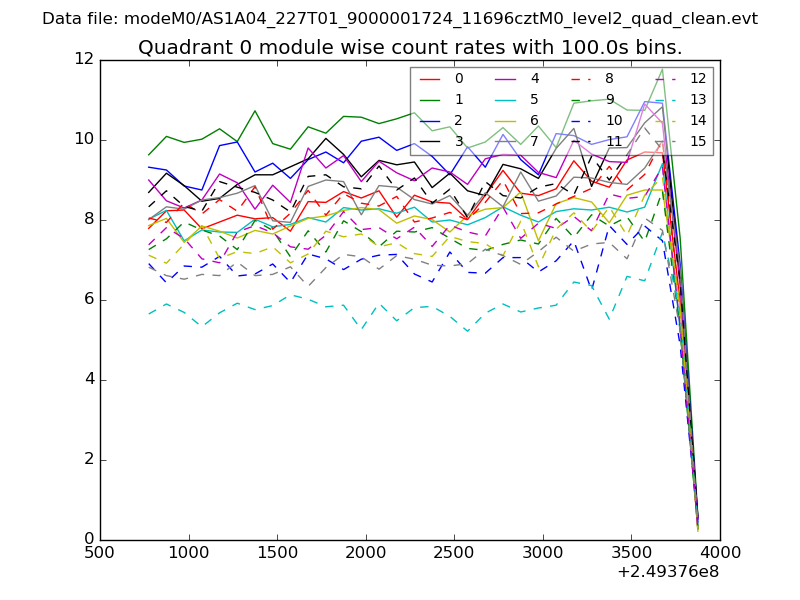 |
 |
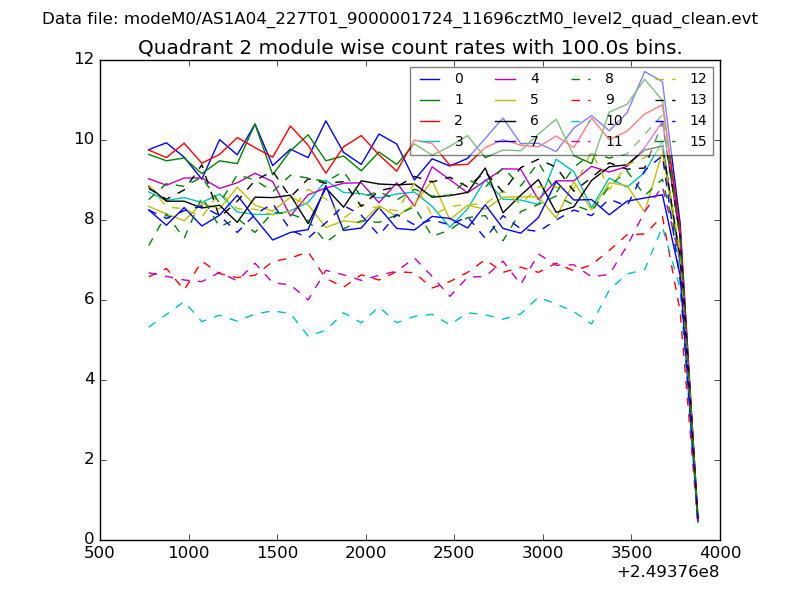
| Module-wise count rates for Quadrant B Data is divided into 100 sec bins |
 |
 |
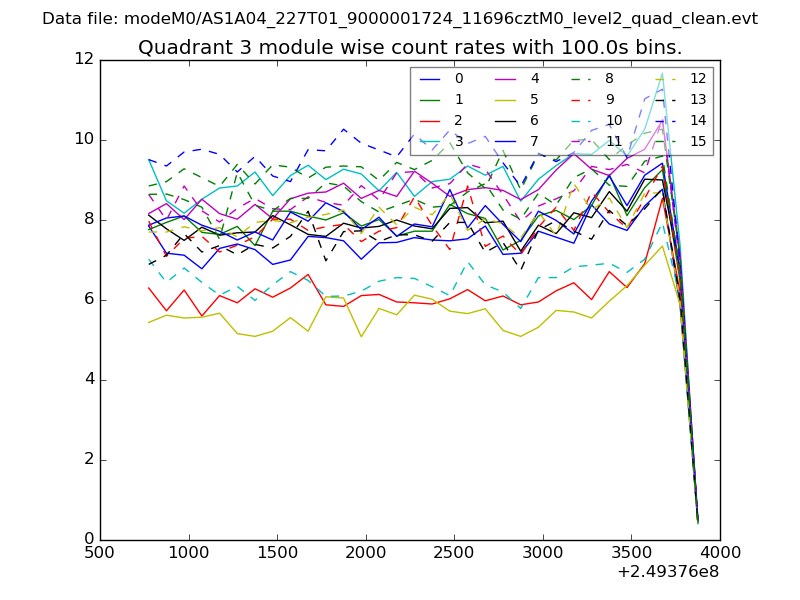
| Module-wise count rates for Quadrant C Data is divided into 100 sec bins |
 |
 |
| Module-wise count rates for Quadrant D Data is divided into 100 sec bins |
 |
 |
| Parameter | Plot |
|---|---|
| CZT HV Monitor | 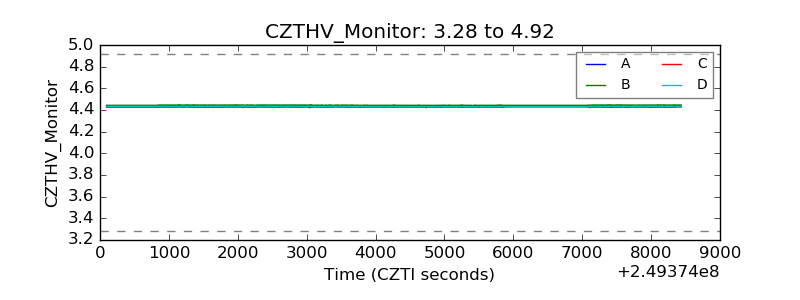 |
| D_VDD | 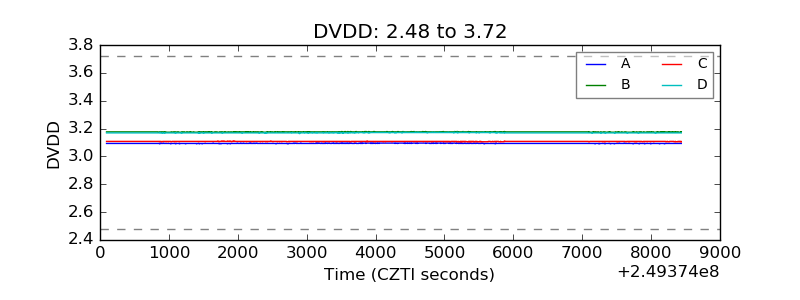 |
| Temperature 1 | 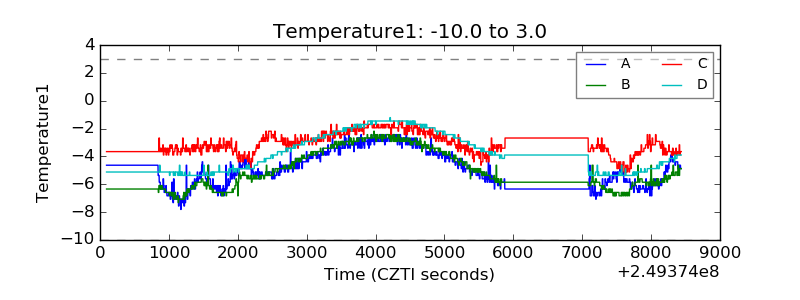 |
| Veto HV Monitor | 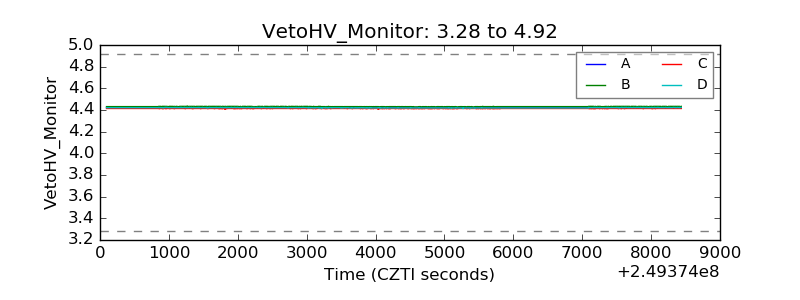 |
| Veto LLD |  |
| Alpha Counter | 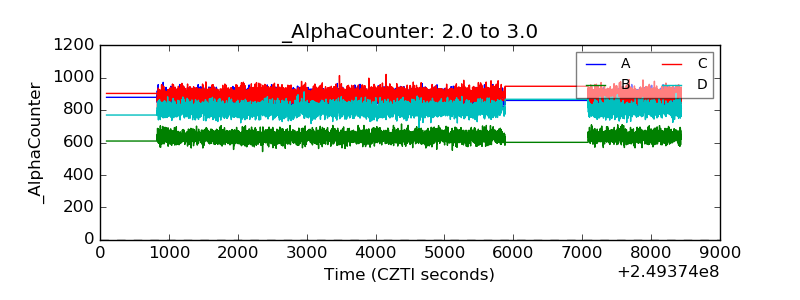 |
| _CPM_Rate | 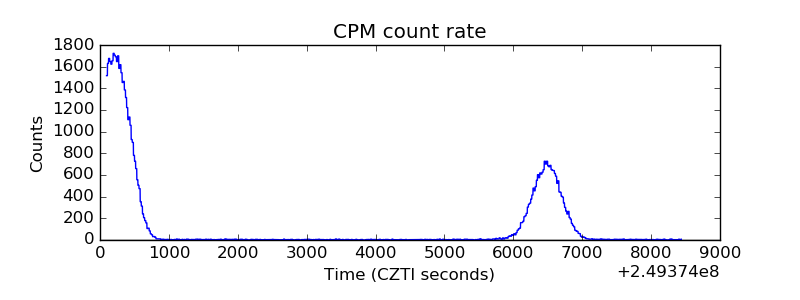 |
| CZT Counter | 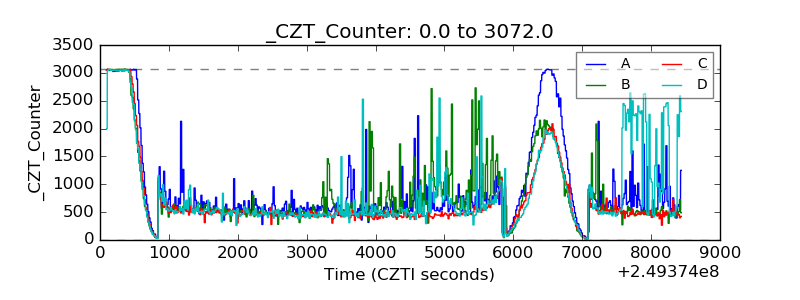 |
| +2.5 Volts monitor |  |
| +5 Volts monitor |  |
| _ROLL_ROT | 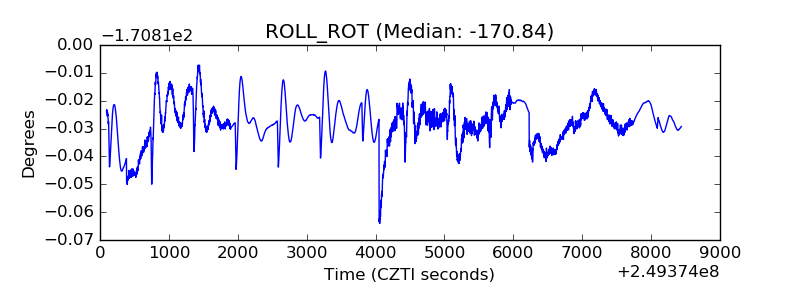 |
| _Roll_DEC | 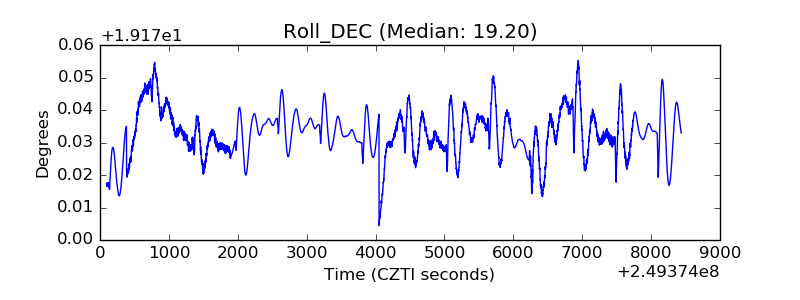 |
| _Roll_RA | 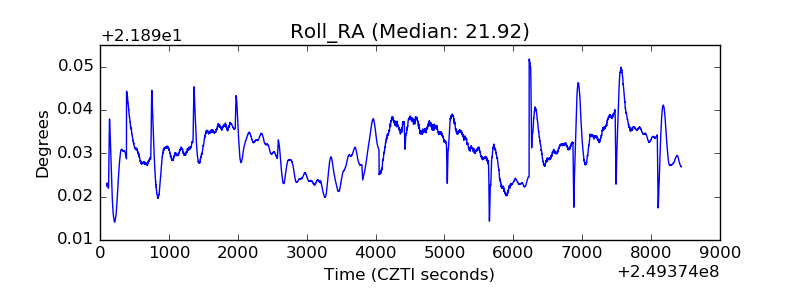 |
| Veto Counter | 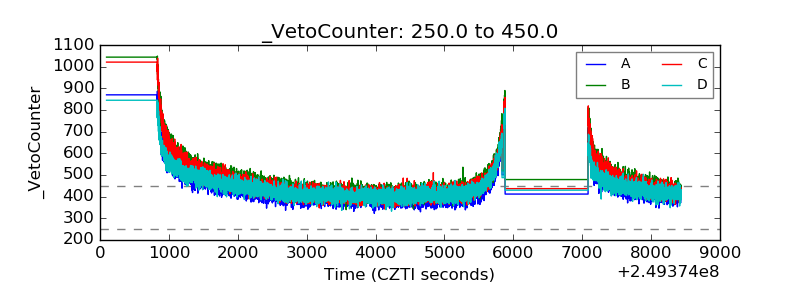 |