| Param | Original file | Final file |
|---|---|---|
| Filename | modeM0/AS1A04_227T01_9000001724_11697cztM0_level2.evt | modeM0/AS1A04_227T01_9000001724_11697cztM0_level2_quad_clean.evt |
| Size (bytes) | 772,966,080 | 77,028,480 |
| Size | 737.2 MB | 73.5 MB |
| Events in quadrant A | 4,798,017 | 483,673 |
| Events in quadrant B | 4,829,666 | 493,585 |
| Events in quadrant C | 3,239,316 | 502,096 |
| Events in quadrant D | 10,090,307 | 385,424 |
| Mode M0 | |||
|---|---|---|---|
| Quadrant | BADHDUFLAG | Total packets | Discarded packets |
| A | 0 | 18752 | 3 |
| B | 0 | 18546 | 2 |
| C | 0 | 13950 | 2 |
| D | 0 | 34519 | 2 |
| Mode SS | |||
|---|---|---|---|
| Quadrant | BADHDUFLAG | Total packets | Discarded packets |
| A | 0 | 136 | 0 |
| B | 0 | 136 | 0 |
| C | 0 | 136 | 0 |
| D | 0 | 136 | 0 |
| Mode M9 | |||
|---|---|---|---|
| Quadrant | BADHDUFLAG | Total packets | Discarded packets |
| A | 0 | 13 | 0 |
| B | 0 | 13 | 0 |
| C | 0 | 13 | 0 |
| D | 0 | 14 | 0 |
| Quadrant | Total seconds | Saturated seconds | Saturation percentage |
|---|---|---|---|
| A | 6695 | 392 | 5.855116% |
| B | 6695 | 298 | 4.451083% |
| C | 6695 | 72 | 1.075429% |
| D | 6695 | 2439 | 36.430172% |
Noise dominated data is calculated using 1-second bins in cleaned event files. If a bin has >2000 counts, and if more than 50% of those come from <1% of pixels, then it is considered to be noise-dominated and hence unusable.
| Quadrant | # 1 sec bins | Bins with >0 counts | Bins with >2000 counts | High rate bins dominated by noise | Noise dominated (total time) | Noise dominated (detector-on time) | Marked lightcurve |
|---|---|---|---|---|---|---|---|
| A | 7636 | 6697 | 143 | 143 | 1.87% | 2.14% | 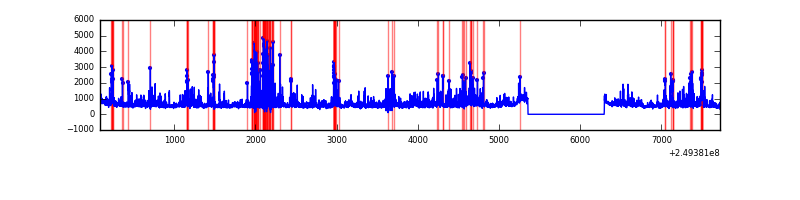 |
| B | 7636 | 6697 | 110 | 110 | 1.44% | 1.64% | 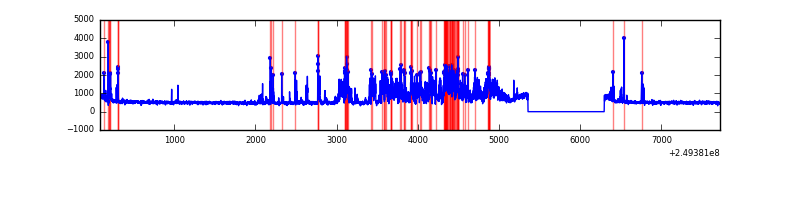 |
| C | 7636 | 6697 | 11 | 11 | 0.14% | 0.16% |  |
| D | 7636 | 6697 | 2288 | 2288 | 29.96% | 34.16% | 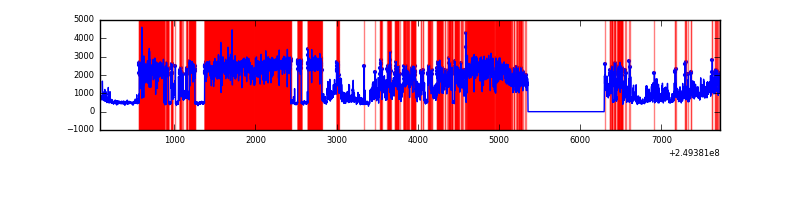 |
Top three noisy pixels from each quadrant. If the there are fewer than three noisy pixels in the level2.evt file, extra rows are filled as -1
| Pixel properties | Quadrant properties | ||||||
|---|---|---|---|---|---|---|---|
| Quadrant | DetID | PixID | Counts | Sigma | Mean | Median | Sigma |
| A | 8 | 5 | 1097810 | 6571.73 | 827 | 809 | 166.9 |
| A | 1 | 162 | 198044 | 1181.56 | 827 | 809 | 166.9 |
| A | 1 | 178 | 105301 | 625.97 | 827 | 809 | 166.9 |
| B | 10 | 244 | 1103412 | 6835.63 | 837 | 818 | 161.3 |
| B | 4 | 239 | 309435 | 1913.3 | 837 | 818 | 161.3 |
| B | 15 | 204 | 62003 | 379.32 | 837 | 818 | 161.3 |
| C | 14 | 234 | 53826 | 279.66 | 817 | 823 | 189.5 |
| C | 13 | 61 | 5957 | 27.09 | 817 | 823 | 189.5 |
| C | 7 | 247 | 1982 | 6.12 | 817 | 823 | 189.5 |
| D | 13 | 152 | 6870230 | 40227.83 | 714 | 697 | 170.8 |
| D | 7 | 80 | 208216 | 1215.23 | 714 | 697 | 170.8 |
| D | 8 | 195 | 162218 | 945.86 | 714 | 697 | 170.8 |
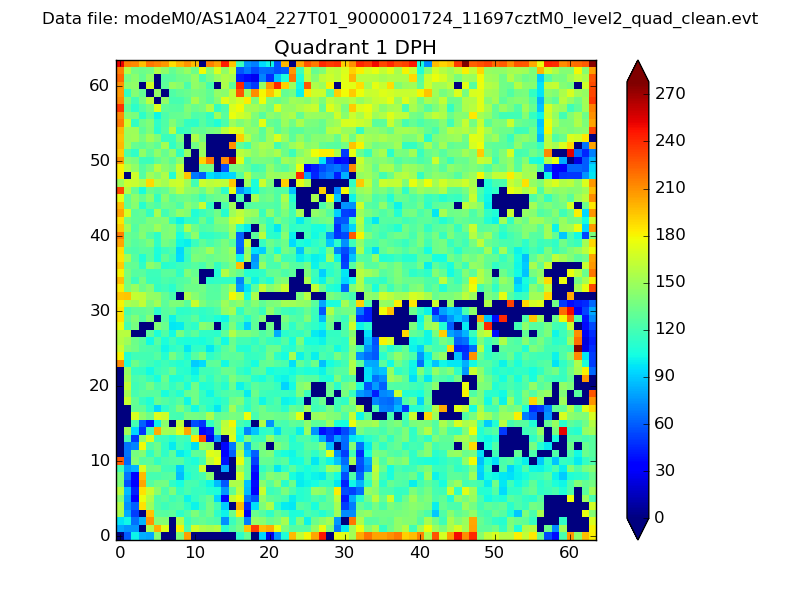
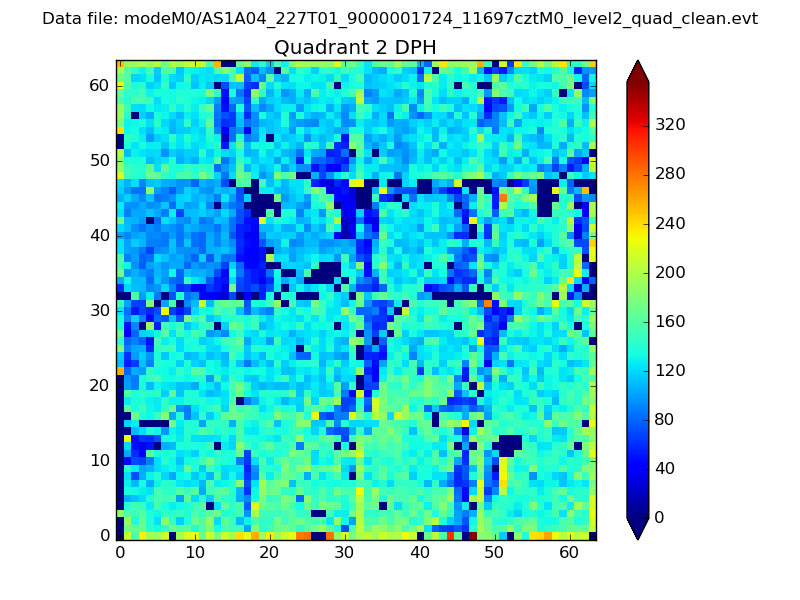
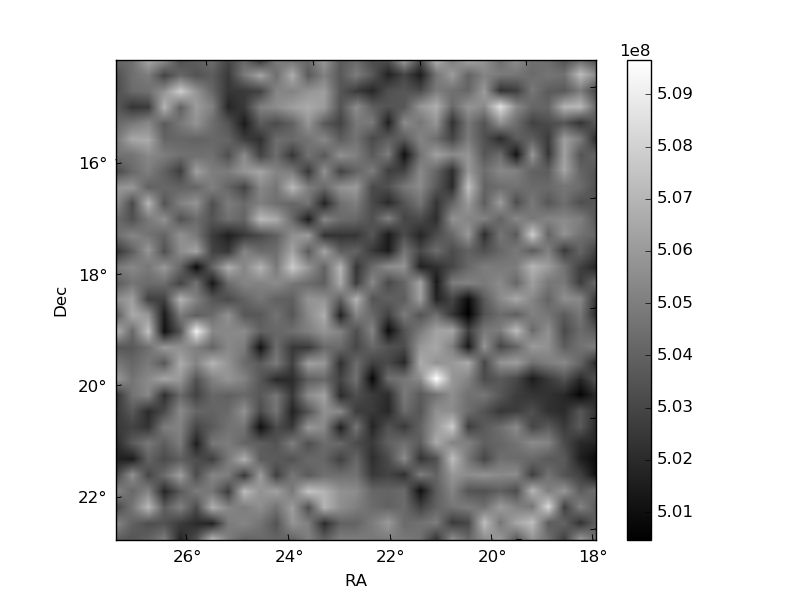
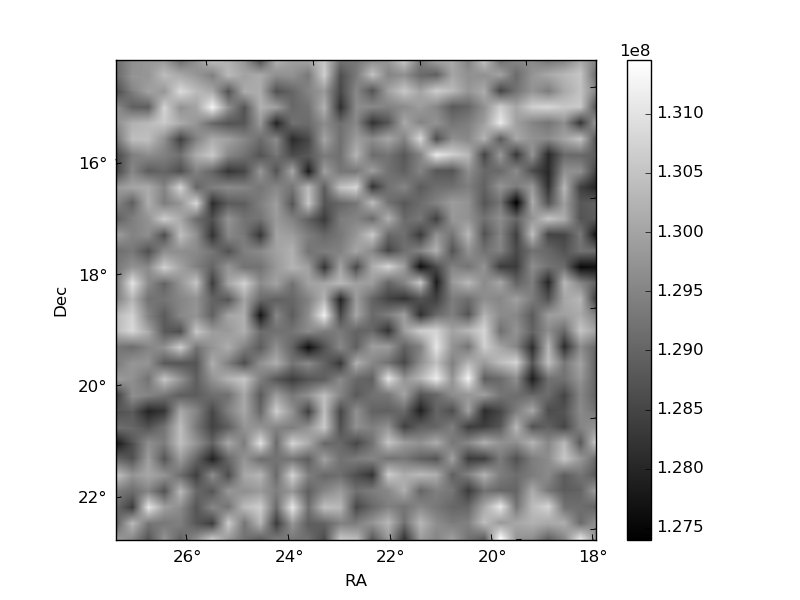
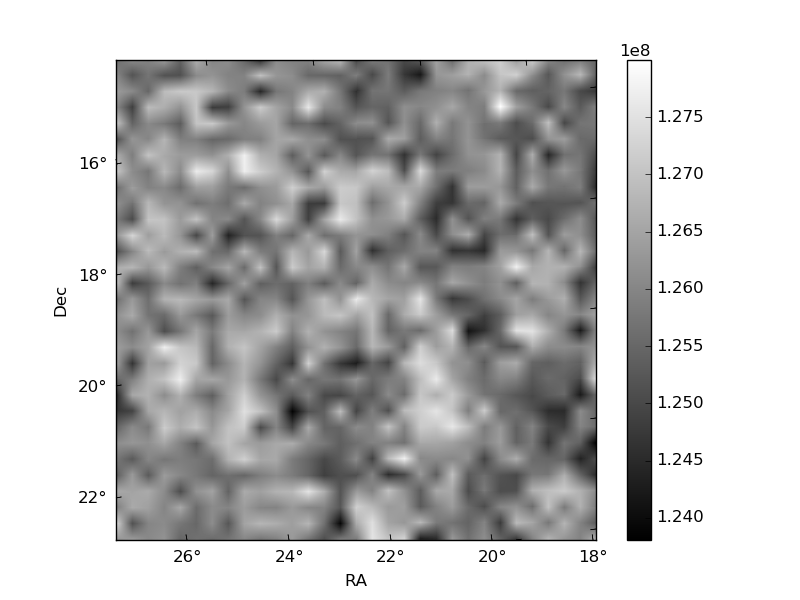
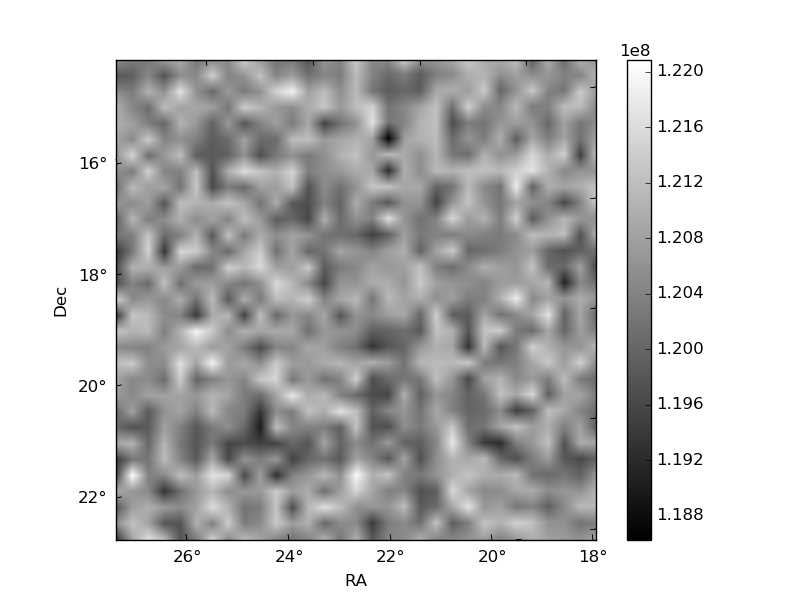
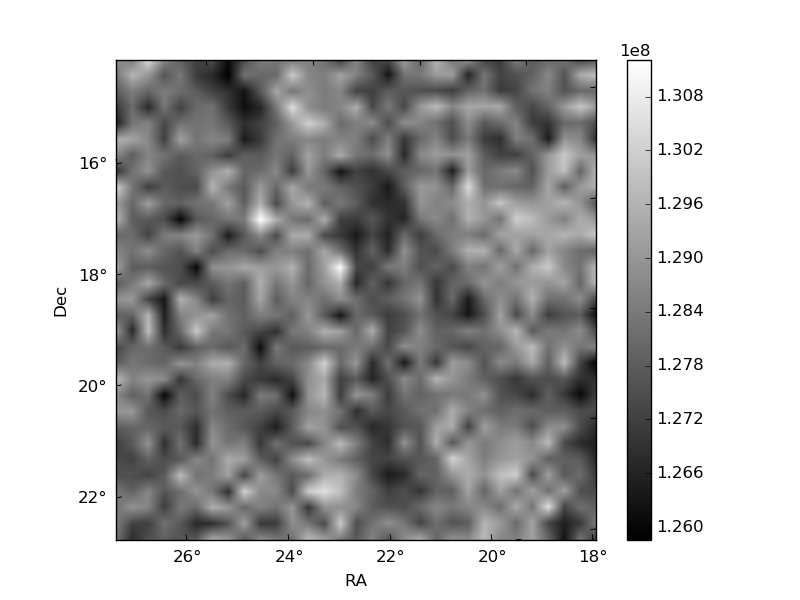
Histogram calculated using DETX and DETY for each event in the final _common_clean file
| Quadrant A | 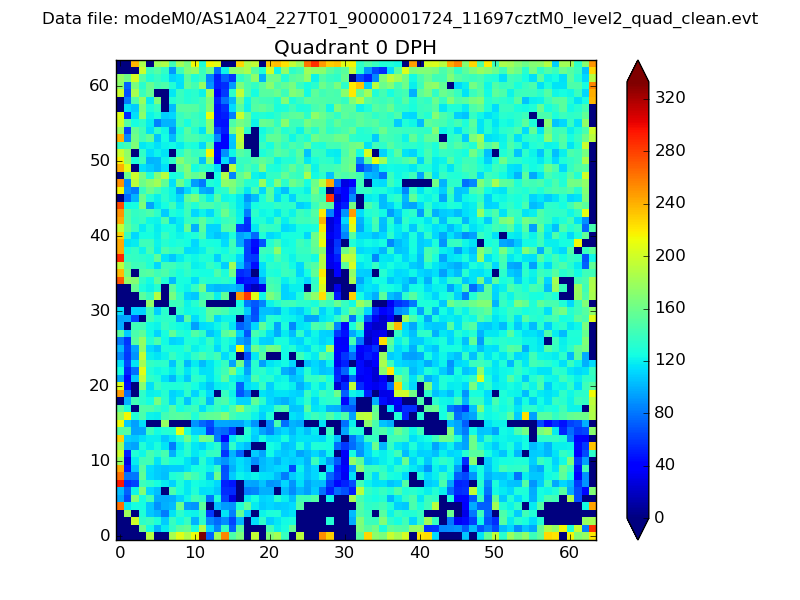 |
 |
Quadrant B |
|---|---|---|---|
| Quadrant D | 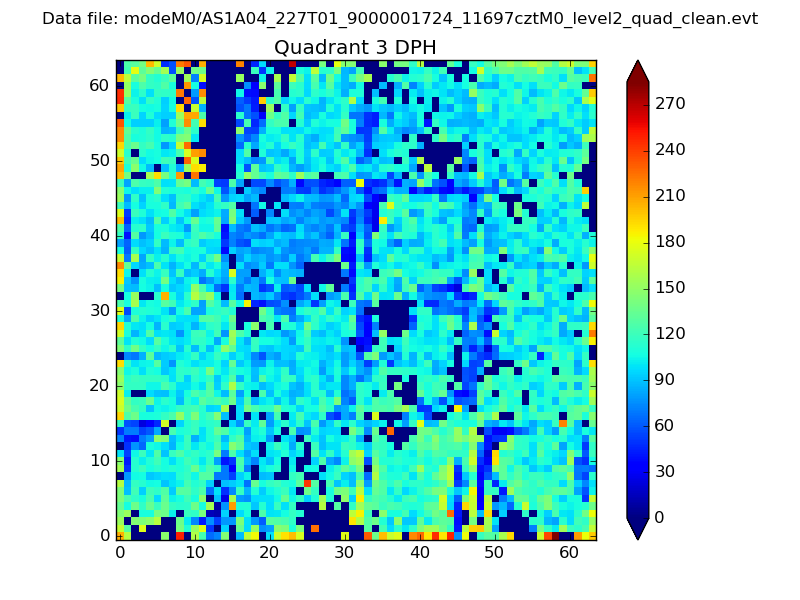 |
 |
Quadrant C |
| Plot type | Count rate plots | Images |
|---|---|---|
| Comparison with Poisson distribution Blue bars denote a histogram of data divided into 1 sec bins. Red curve is a Poisson curve with rate = median count rate of data. |
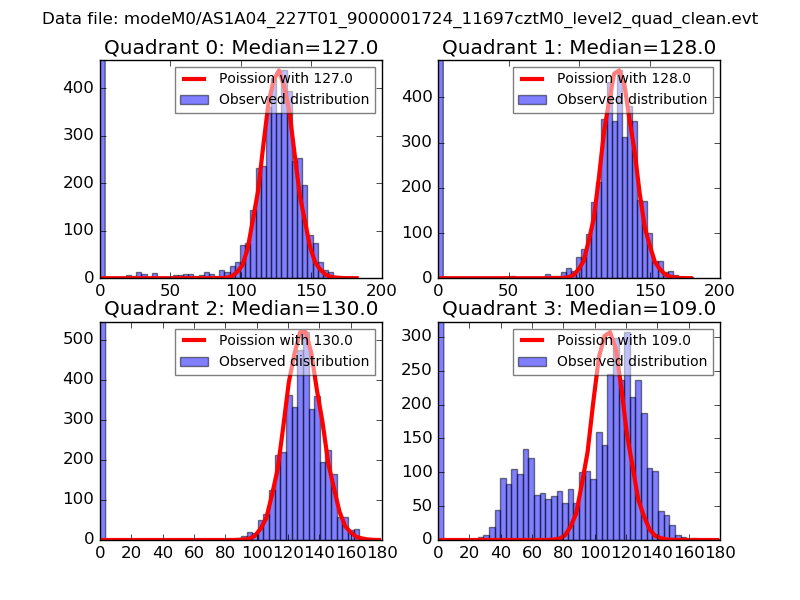 |
 |
| Quadrant-wise count rates Data is divided into 100 sec bins |
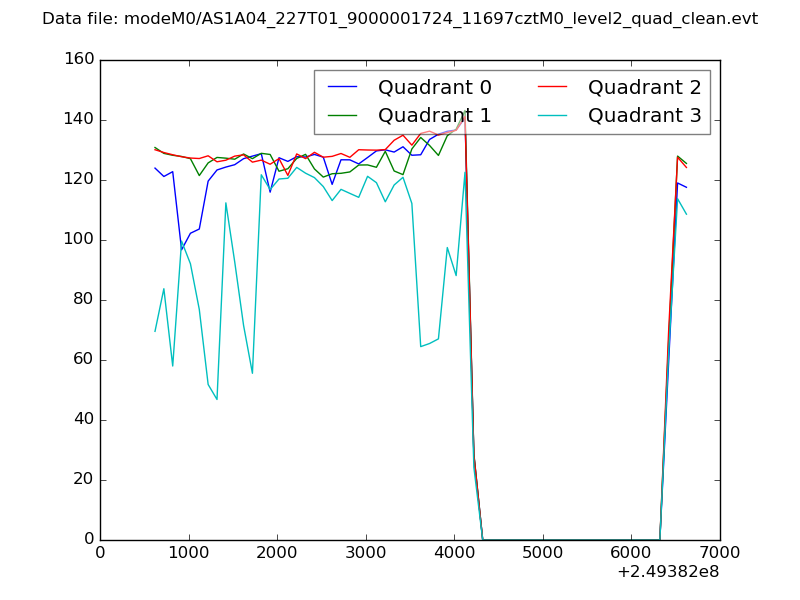 |
|
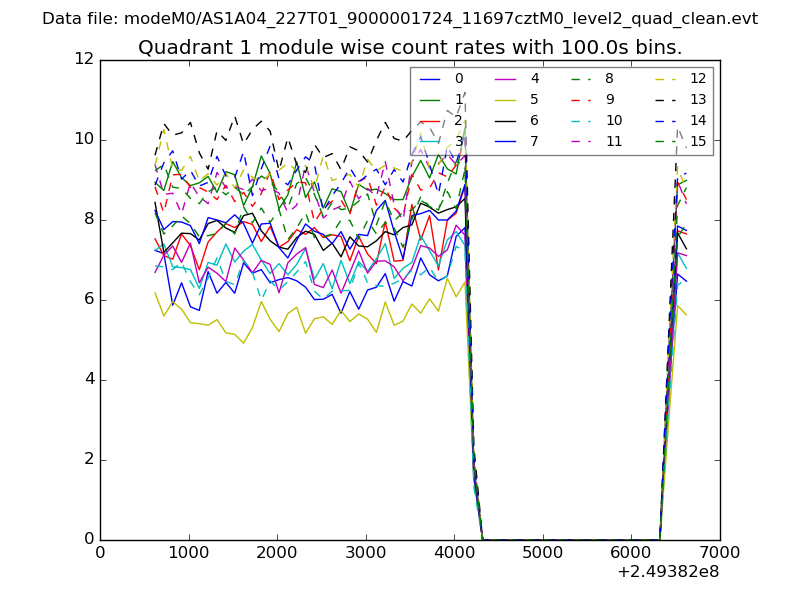
| Module-wise count rates for Quadrant A Data is divided into 100 sec bins |
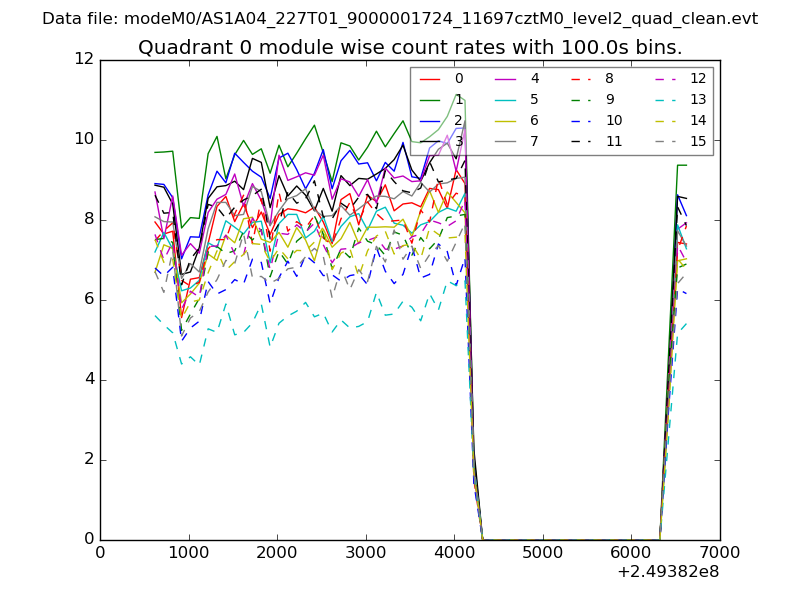 |
 |
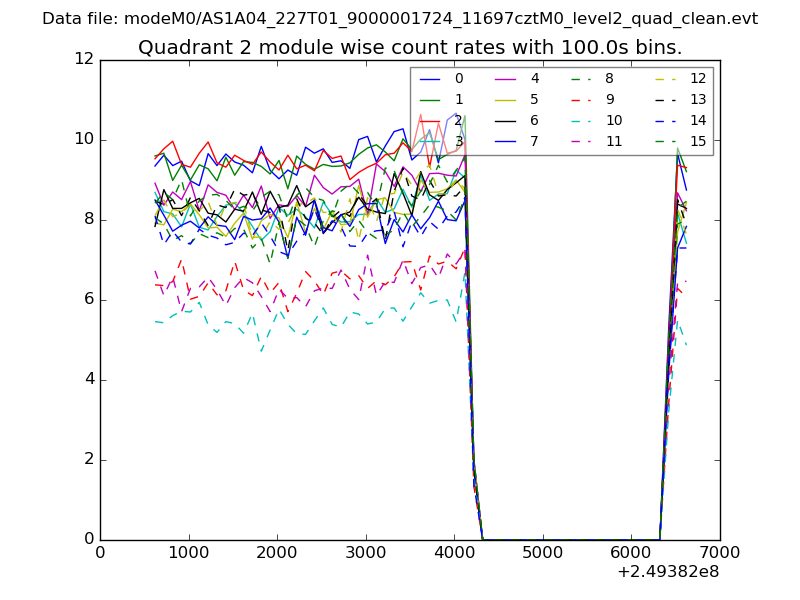
| Module-wise count rates for Quadrant B Data is divided into 100 sec bins |
 |
 |
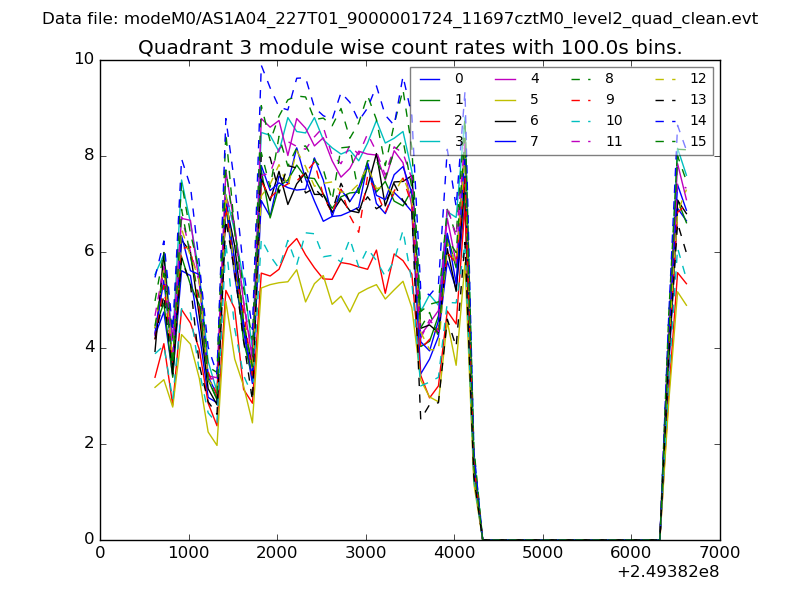
| Module-wise count rates for Quadrant C Data is divided into 100 sec bins |
 |
 |
| Module-wise count rates for Quadrant D Data is divided into 100 sec bins |
 |
 |
| Parameter | Plot |
|---|---|
| CZT HV Monitor | 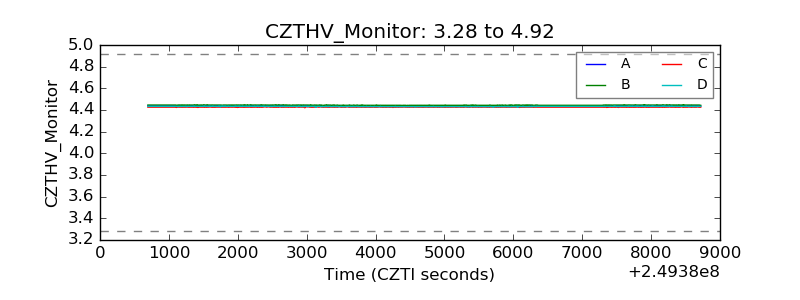 |
| D_VDD | 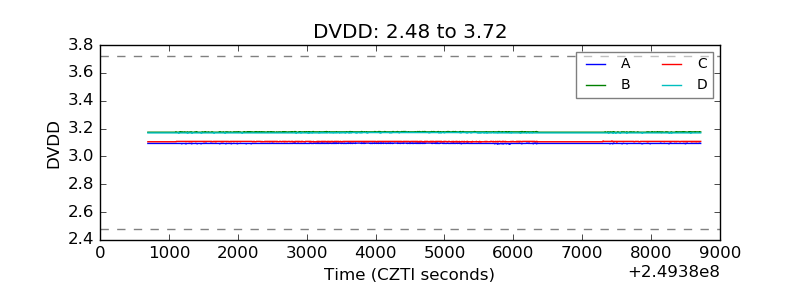 |
| Temperature 1 | 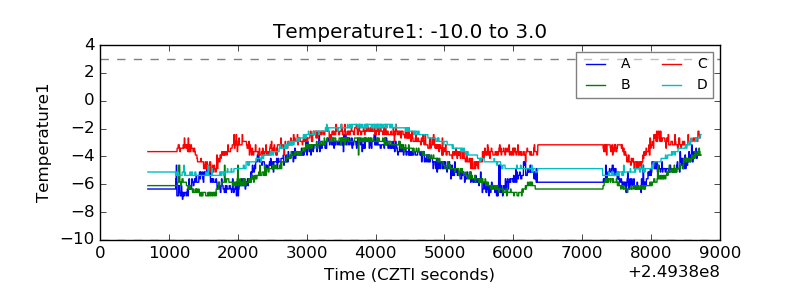 |
| Veto HV Monitor | 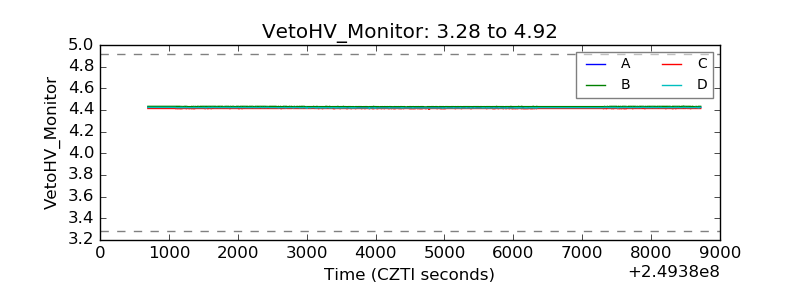 |
| Veto LLD | 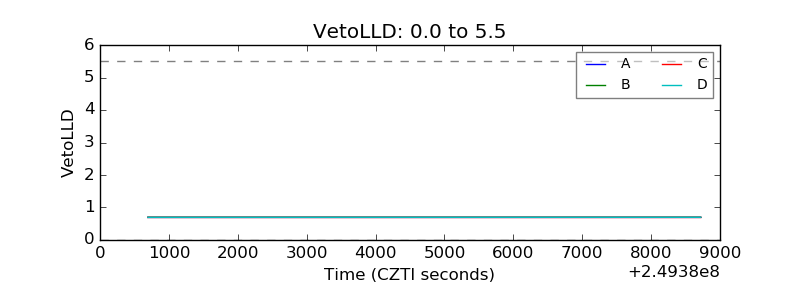 |
| Alpha Counter | 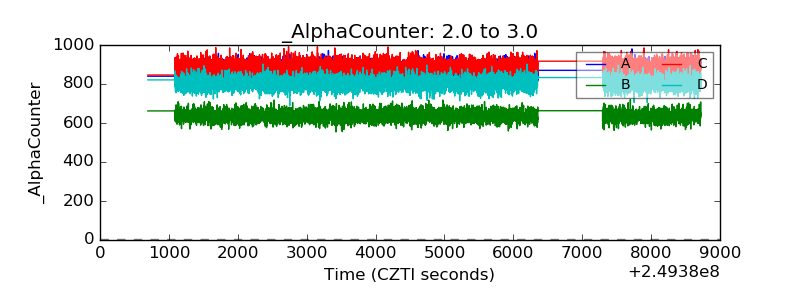 |
| _CPM_Rate | 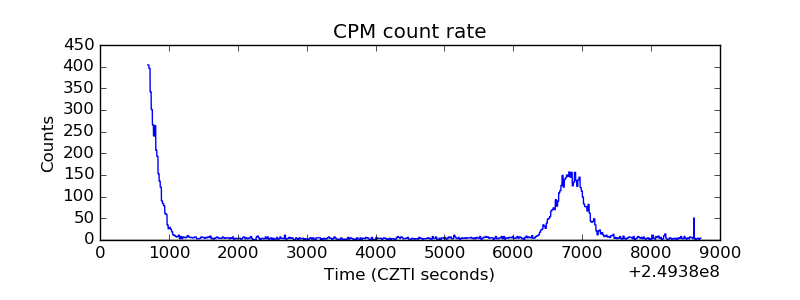 |
| CZT Counter | 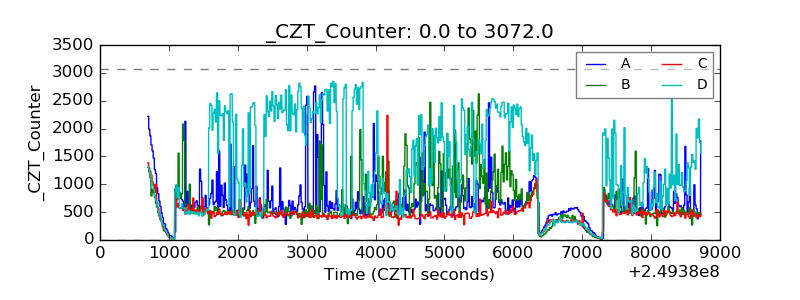 |
| +2.5 Volts monitor |  |
| +5 Volts monitor |  |
| _ROLL_ROT | 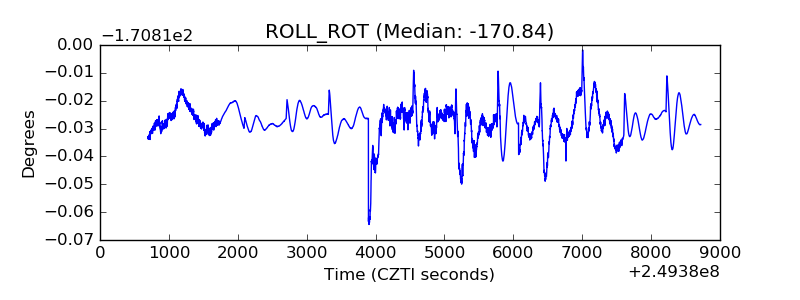 |
| _Roll_DEC | 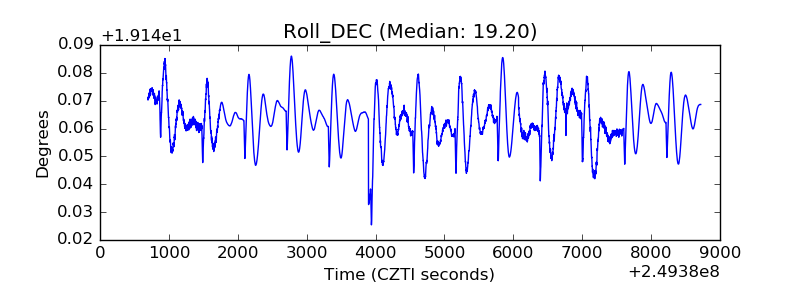 |
| _Roll_RA | 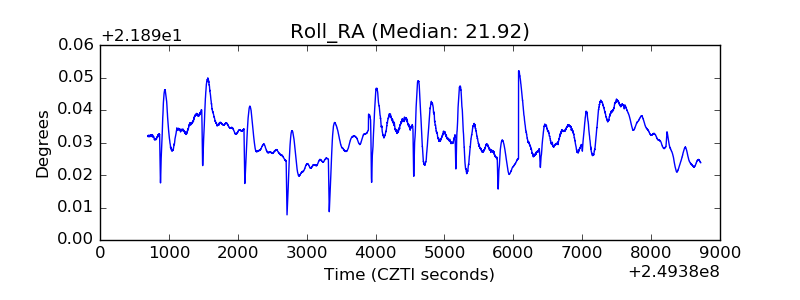 |
| Veto Counter | 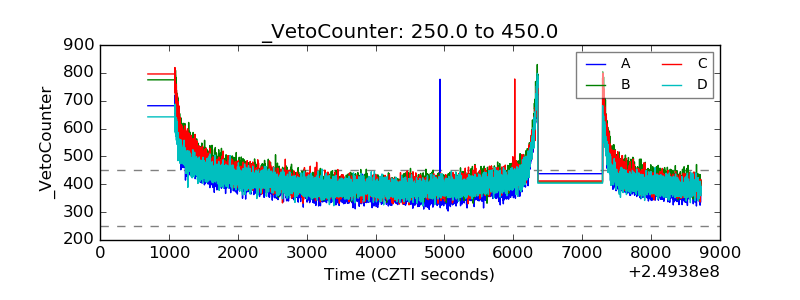 |