| Param | Original file | Final file |
|---|---|---|
| Filename | modeM0/AS1A04_227T01_9000001724_11698cztM0_level2.evt | modeM0/AS1A04_227T01_9000001724_11698cztM0_level2_quad_clean.evt |
| Size (bytes) | 909,987,840 | 78,577,920 |
| Size | 867.8 MB | 74.9 MB |
| Events in quadrant A | 6,113,767 | 511,489 |
| Events in quadrant B | 4,713,290 | 517,208 |
| Events in quadrant C | 3,388,743 | 546,472 |
| Events in quadrant D | 12,852,702 | 297,057 |
| Mode M0 | |||
|---|---|---|---|
| Quadrant | BADHDUFLAG | Total packets | Discarded packets |
| A | 0 | 23150 | 3 |
| B | 0 | 18512 | 2 |
| C | 0 | 14958 | 2 |
| D | 0 | 43029 | 2 |
| Mode SS | |||
|---|---|---|---|
| Quadrant | BADHDUFLAG | Total packets | Discarded packets |
| A | 0 | 146 | 0 |
| B | 0 | 146 | 0 |
| C | 0 | 146 | 0 |
| D | 0 | 146 | 0 |
| Mode M9 | |||
|---|---|---|---|
| Quadrant | BADHDUFLAG | Total packets | Discarded packets |
| A | 0 | 11 | 0 |
| B | 0 | 11 | 0 |
| C | 0 | 11 | 0 |
| D | 0 | 12 | 0 |
| Quadrant | Total seconds | Saturated seconds | Saturation percentage |
|---|---|---|---|
| A | 7268 | 758 | 10.429279% |
| B | 7268 | 488 | 6.714364% |
| C | 7268 | 78 | 1.073198% |
| D | 7268 | 4126 | 56.769400% |
Noise dominated data is calculated using 1-second bins in cleaned event files. If a bin has >2000 counts, and if more than 50% of those come from <1% of pixels, then it is considered to be noise-dominated and hence unusable.
| Quadrant | # 1 sec bins | Bins with >0 counts | Bins with >2000 counts | High rate bins dominated by noise | Noise dominated (total time) | Noise dominated (detector-on time) | Marked lightcurve |
|---|---|---|---|---|---|---|---|
| A | 7784 | 7269 | 323 | 323 | 4.15% | 4.44% | 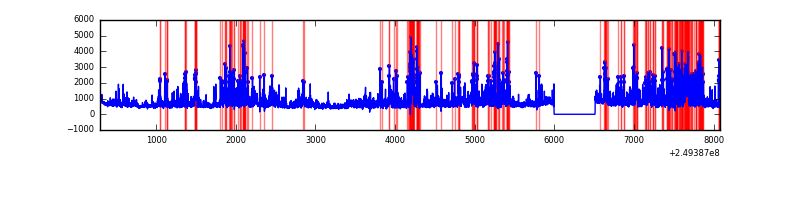 |
| B | 7784 | 7270 | 136 | 136 | 1.75% | 1.87% | 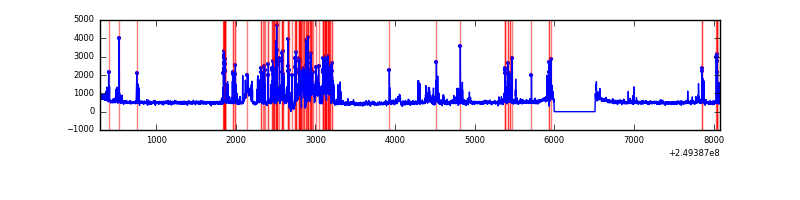 |
| C | 7784 | 7270 | 0 | 0 | 0.00% | 0.00% | 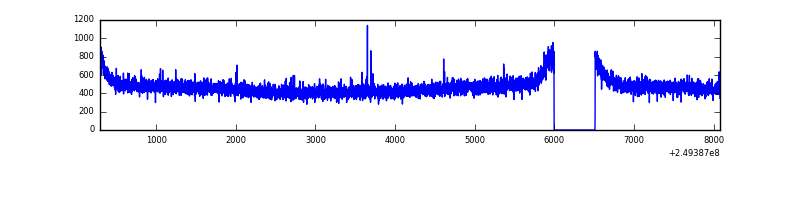 |
| D | 7784 | 7270 | 3833 | 3833 | 49.24% | 52.72% | 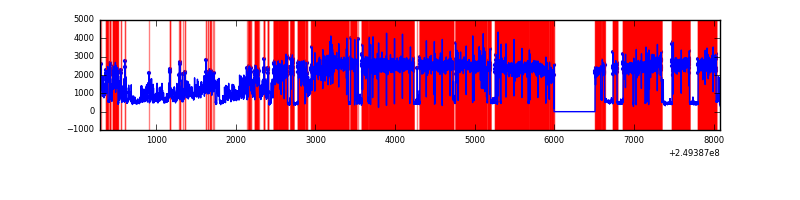 |
Top three noisy pixels from each quadrant. If the there are fewer than three noisy pixels in the level2.evt file, extra rows are filled as -1
| Pixel properties | Quadrant properties | ||||||
|---|---|---|---|---|---|---|---|
| Quadrant | DetID | PixID | Counts | Sigma | Mean | Median | Sigma |
| A | 8 | 5 | 2222692 | 12670.61 | 860 | 840 | 175.4 |
| A | 1 | 162 | 222370 | 1263.32 | 860 | 840 | 175.4 |
| A | 1 | 178 | 118830 | 672.86 | 860 | 840 | 175.4 |
| B | 4 | 239 | 555603 | 3314.71 | 867 | 842 | 167.4 |
| B | 3 | 64 | 334433 | 1993.22 | 867 | 842 | 167.4 |
| B | 10 | 244 | 264558 | 1575.71 | 867 | 842 | 167.4 |
| C | 13 | 61 | 6350 | 27.31 | 867 | 871 | 200.7 |
| C | 12 | 4 | 5642 | 23.78 | 867 | 871 | 200.7 |
| C | 3 | 202 | 2128 | 6.26 | 867 | 871 | 200.7 |
| D | 13 | 152 | 9956617 | 73241.6 | 561 | 544 | 135.9 |
| D | 10 | 157 | 316519 | 2324.46 | 561 | 544 | 135.9 |
| D | 8 | 195 | 219790 | 1612.88 | 561 | 544 | 135.9 |
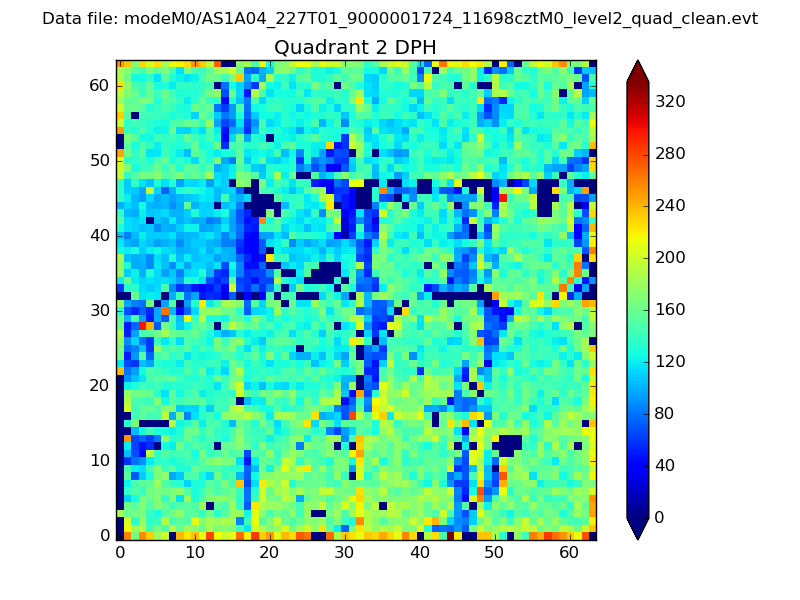
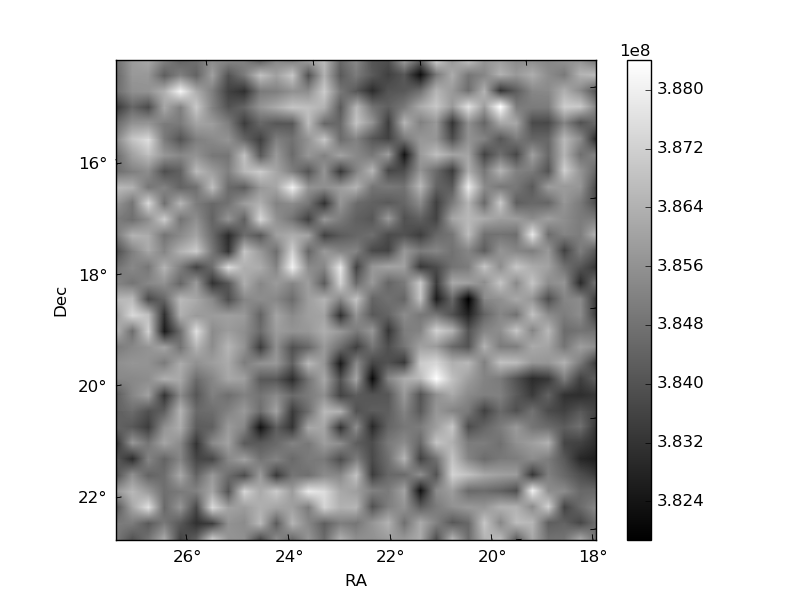
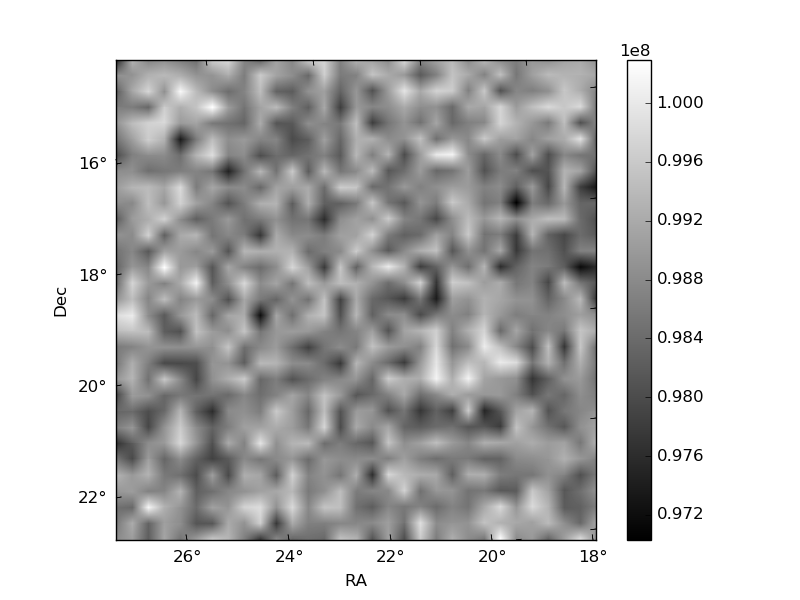
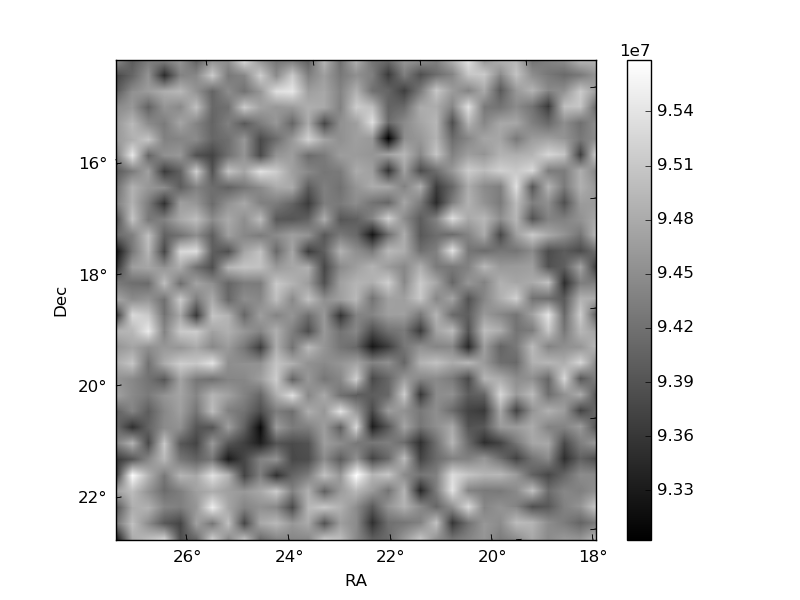
Histogram calculated using DETX and DETY for each event in the final _common_clean file
| Quadrant A | 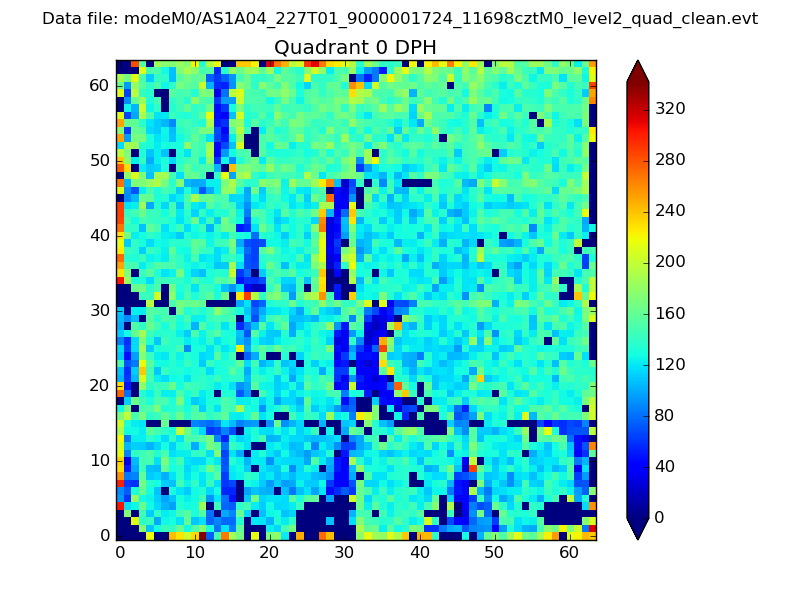 |
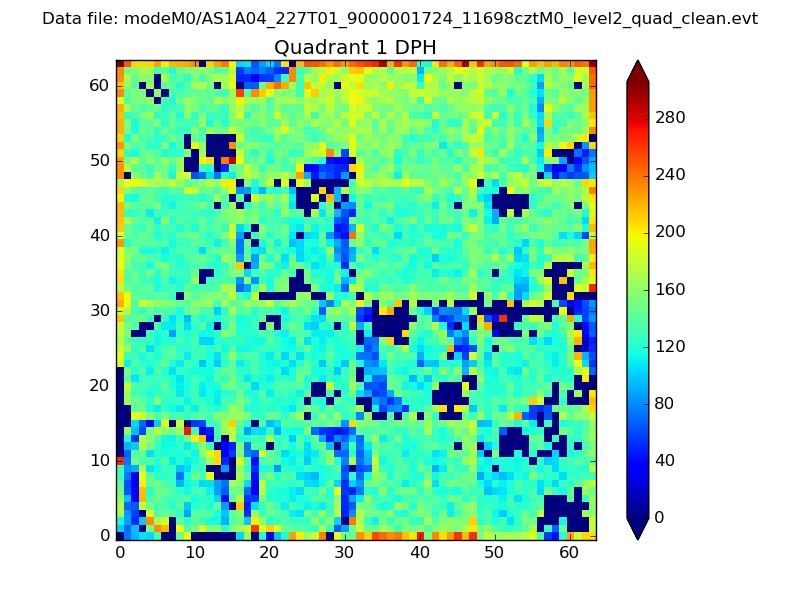 |
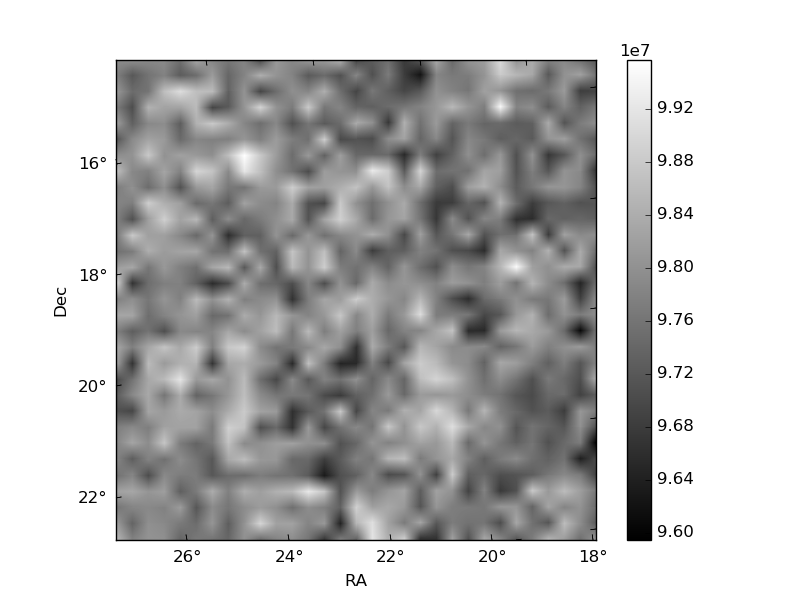
Quadrant B |
|---|---|---|---|
| Quadrant D | 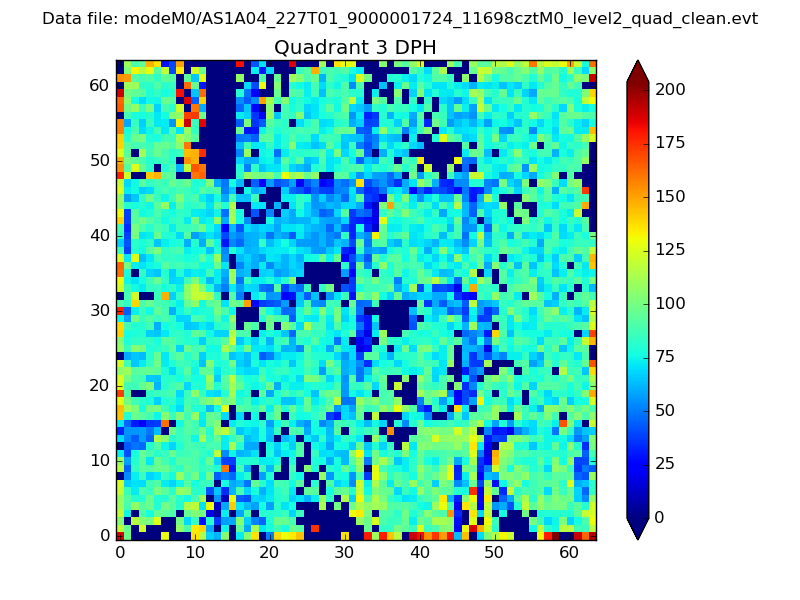 |
 |
Quadrant C |
| Plot type | Count rate plots | Images |
|---|---|---|
| Comparison with Poisson distribution Blue bars denote a histogram of data divided into 1 sec bins. Red curve is a Poisson curve with rate = median count rate of data. |
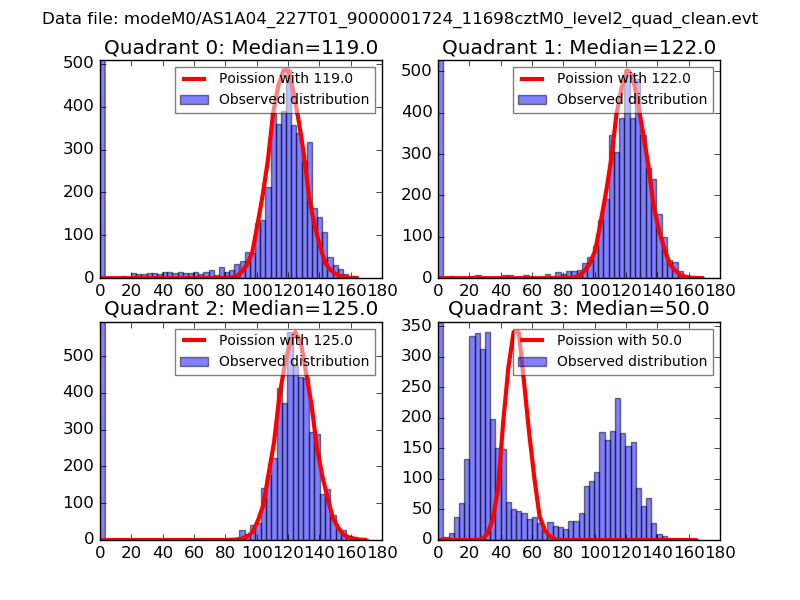 |
 |
| Quadrant-wise count rates Data is divided into 100 sec bins |
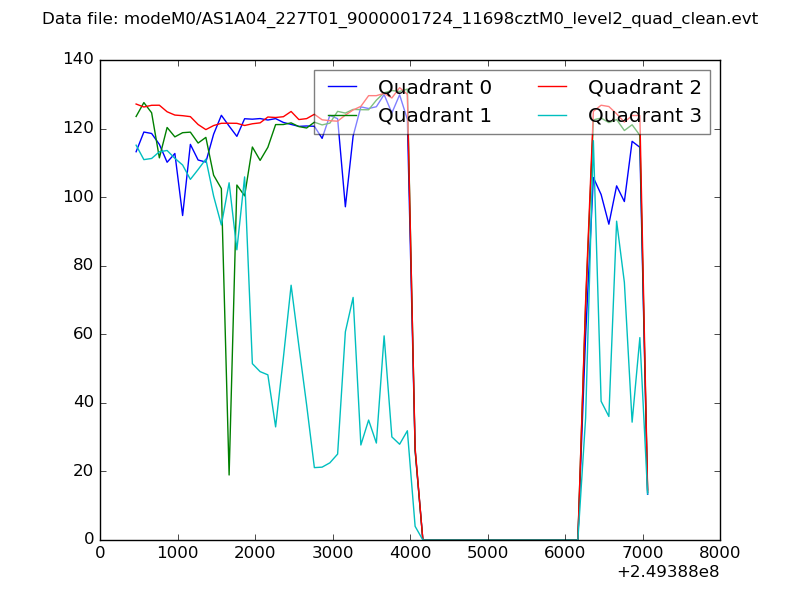 |
|
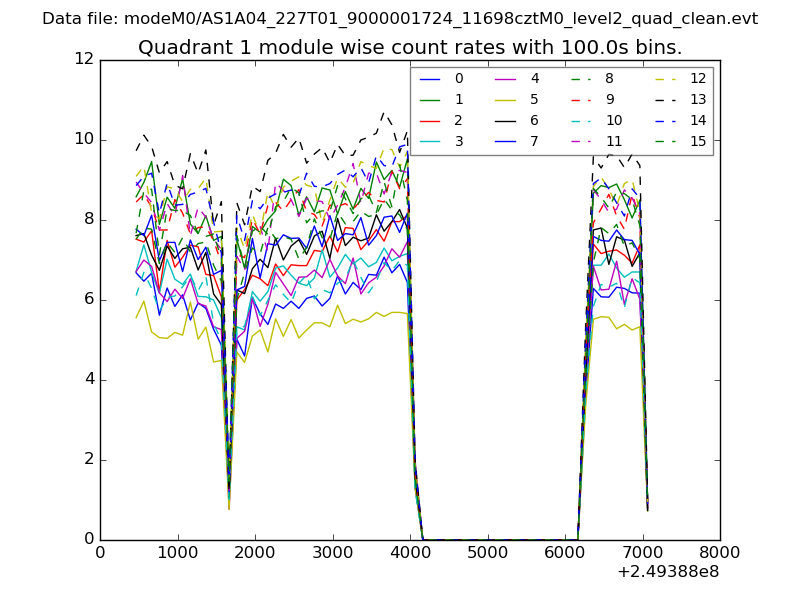
| Module-wise count rates for Quadrant A Data is divided into 100 sec bins |
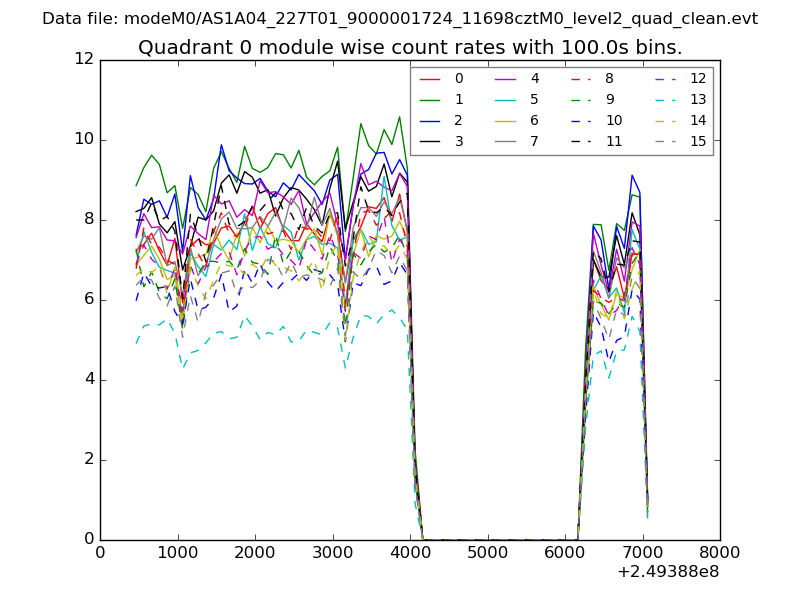 |
 |
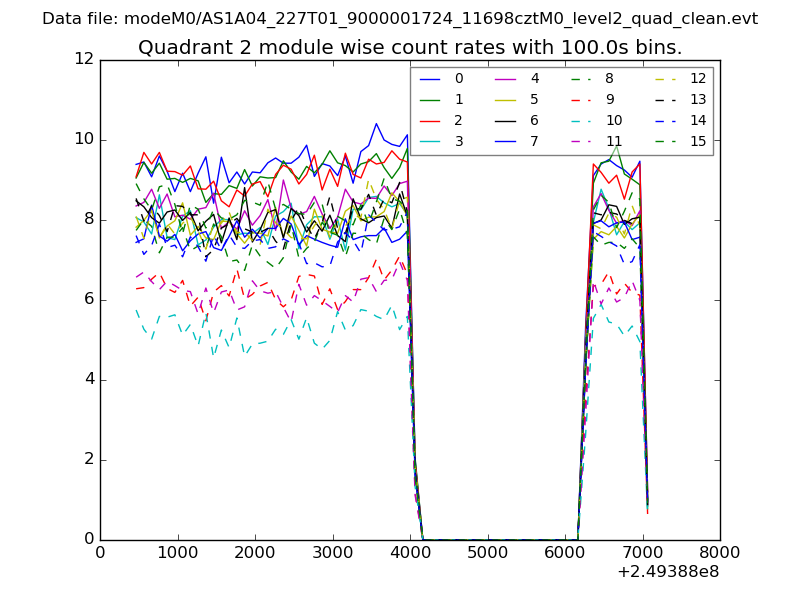
| Module-wise count rates for Quadrant B Data is divided into 100 sec bins |
 |
 |
| Module-wise count rates for Quadrant C Data is divided into 100 sec bins |
 |
 |
| Module-wise count rates for Quadrant D Data is divided into 100 sec bins |
 |
 |
| Parameter | Plot |
|---|---|
| CZT HV Monitor | 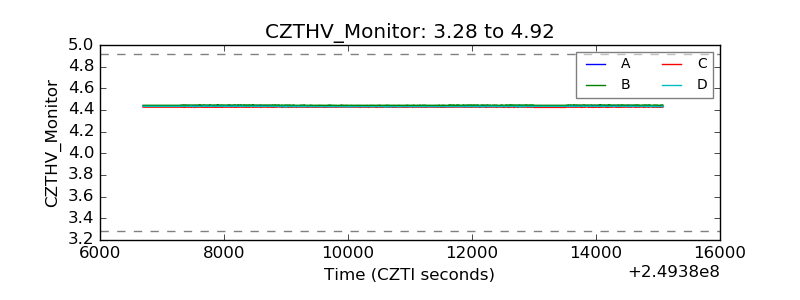 |
| D_VDD | 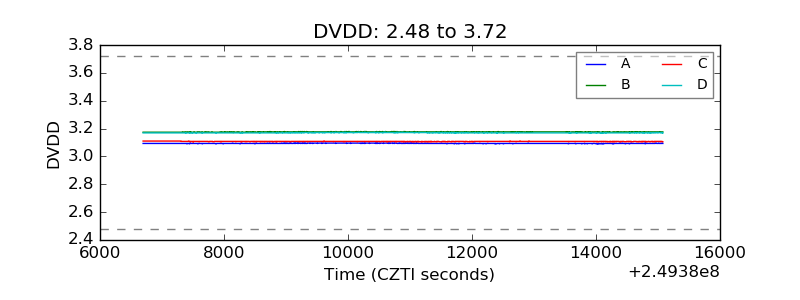 |
| Temperature 1 | 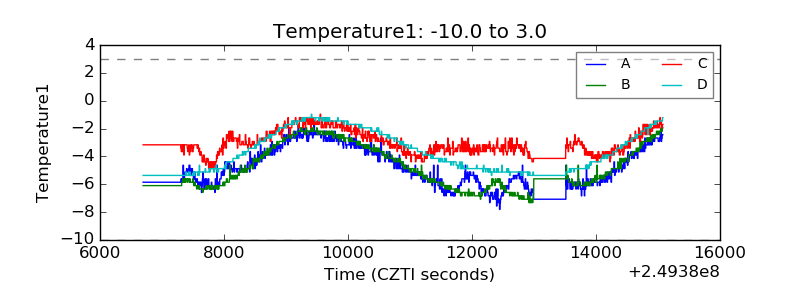 |
| Veto HV Monitor | 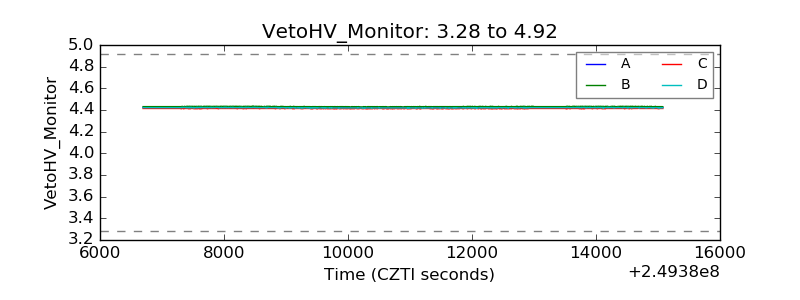 |
| Veto LLD | 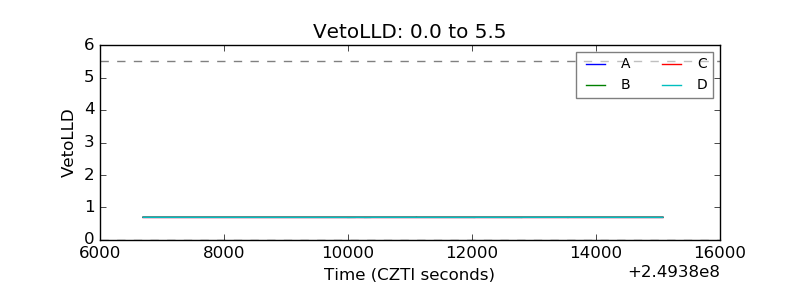 |
| Alpha Counter | 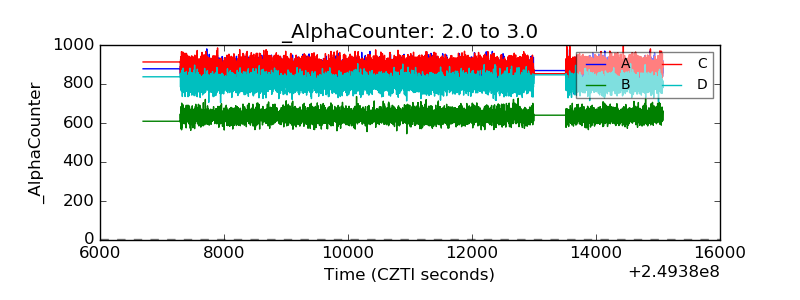 |
| _CPM_Rate | 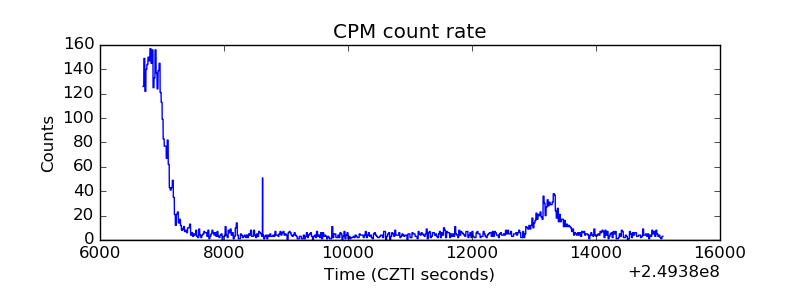 |
| CZT Counter | 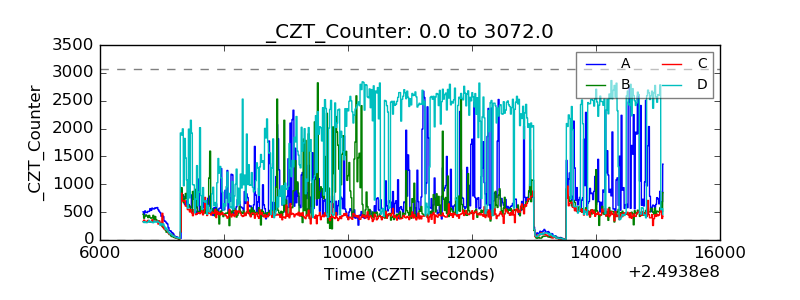 |
| +2.5 Volts monitor |  |
| +5 Volts monitor |  |
| _ROLL_ROT | 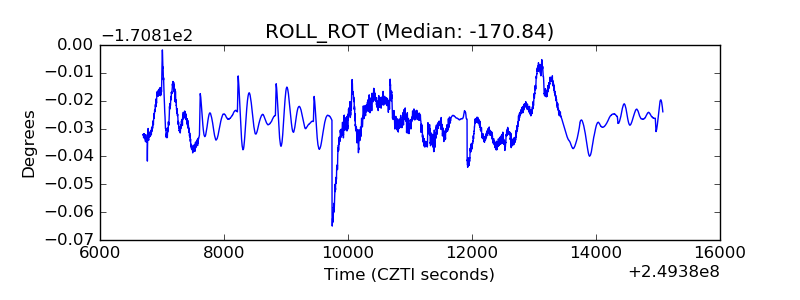 |
| _Roll_DEC |  |
| _Roll_RA | 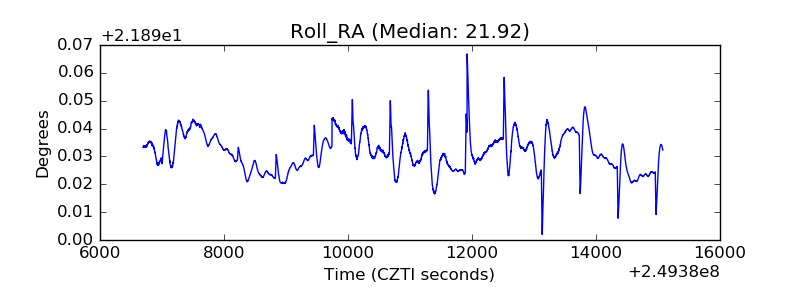 |
| Veto Counter | 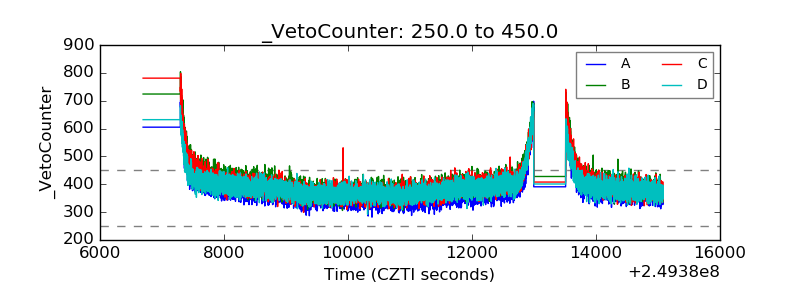 |