| Param | Original file | Final file |
|---|---|---|
| Filename | modeM0/AS1A04_227T01_9000001724_11699cztM0_level2.evt | modeM0/AS1A04_227T01_9000001724_11699cztM0_level2_quad_clean.evt |
| Size (bytes) | 831,219,840 | 85,239,360 |
| Size | 792.7 MB | 81.3 MB |
| Events in quadrant A | 7,412,618 | 514,195 |
| Events in quadrant B | 4,464,488 | 557,802 |
| Events in quadrant C | 3,313,503 | 586,537 |
| Events in quadrant D | 9,503,885 | 427,523 |
| Mode M0 | |||
|---|---|---|---|
| Quadrant | BADHDUFLAG | Total packets | Discarded packets |
| A | 0 | 26939 | 2 |
| B | 0 | 17697 | 1 |
| C | 0 | 14713 | 1 |
| D | 0 | 32997 | 1 |
| Mode SS | |||
|---|---|---|---|
| Quadrant | BADHDUFLAG | Total packets | Discarded packets |
| A | 0 | 142 | 0 |
| B | 0 | 142 | 0 |
| C | 0 | 142 | 0 |
| D | 0 | 142 | 0 |
| Quadrant | Total seconds | Saturated seconds | Saturation percentage |
|---|---|---|---|
| A | 7090 | 1435 | 20.239774% |
| B | 7090 | 579 | 8.166432% |
| C | 7090 | 104 | 1.466855% |
| D | 7090 | 2315 | 32.651622% |
Noise dominated data is calculated using 1-second bins in cleaned event files. If a bin has >2000 counts, and if more than 50% of those come from <1% of pixels, then it is considered to be noise-dominated and hence unusable.
| Quadrant | # 1 sec bins | Bins with >0 counts | Bins with >2000 counts | High rate bins dominated by noise | Noise dominated (total time) | Noise dominated (detector-on time) | Marked lightcurve |
|---|---|---|---|---|---|---|---|
| A | 7121 | 7092 | 724 | 724 | 10.17% | 10.21% | 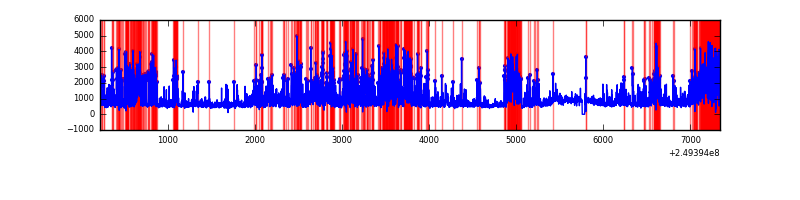 |
| B | 7121 | 7092 | 152 | 152 | 2.13% | 2.14% | 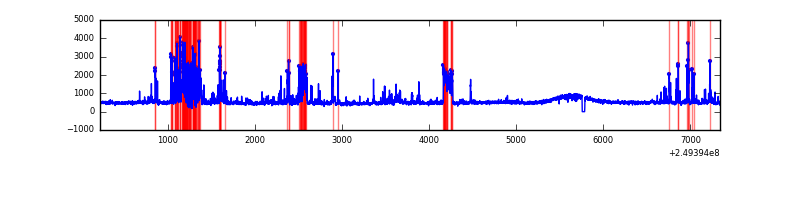 |
| C | 7121 | 7092 | 0 | 0 | 0.00% | 0.00% | 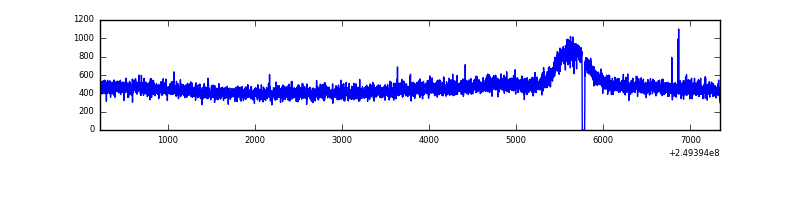 |
| D | 7121 | 7092 | 2127 | 2127 | 29.87% | 29.99% | 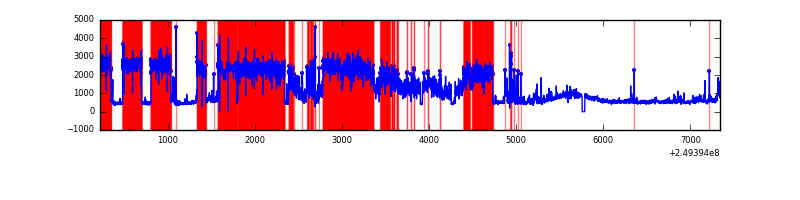 |
Top three noisy pixels from each quadrant. If the there are fewer than three noisy pixels in the level2.evt file, extra rows are filled as -1
| Pixel properties | Quadrant properties | ||||||
|---|---|---|---|---|---|---|---|
| Quadrant | DetID | PixID | Counts | Sigma | Mean | Median | Sigma |
| A | 8 | 5 | 3562002 | 21139.67 | 816 | 799 | 168.5 |
| A | 1 | 162 | 231706 | 1370.69 | 816 | 799 | 168.5 |
| A | 1 | 178 | 130400 | 769.32 | 816 | 799 | 168.5 |
| B | 3 | 64 | 552371 | 3336.77 | 848 | 824 | 165.3 |
| B | 4 | 239 | 458847 | 2770.97 | 848 | 824 | 165.3 |
| B | 15 | 204 | 78151 | 467.81 | 848 | 824 | 165.3 |
| C | 13 | 61 | 6187 | 27.08 | 848 | 851 | 197.1 |
| C | 8 | 222 | 3995 | 15.95 | 848 | 851 | 197.1 |
| C | 14 | 234 | 2831 | 10.05 | 848 | 851 | 197.1 |
| D | 13 | 152 | 5828798 | 32738.97 | 729 | 705 | 178.0 |
| D | 7 | 80 | 294771 | 1651.9 | 729 | 705 | 178.0 |
| D | 10 | 157 | 280818 | 1573.52 | 729 | 705 | 178.0 |
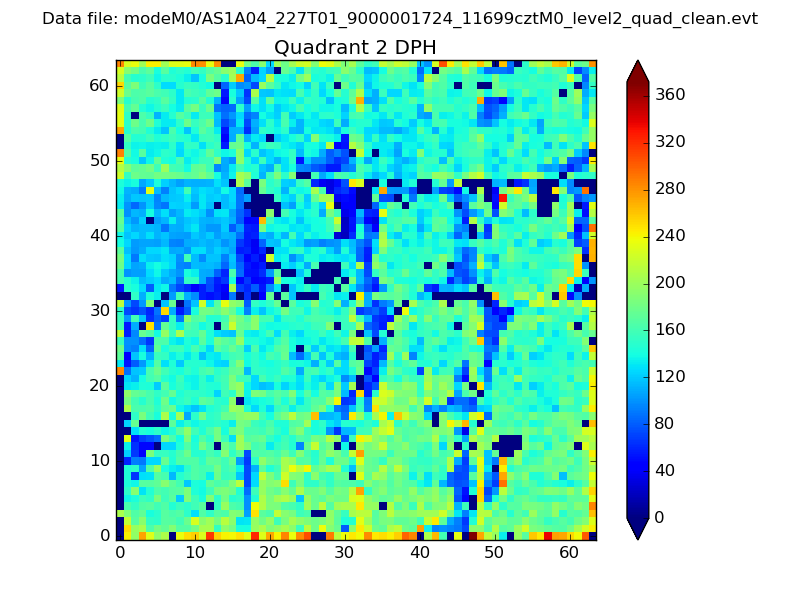
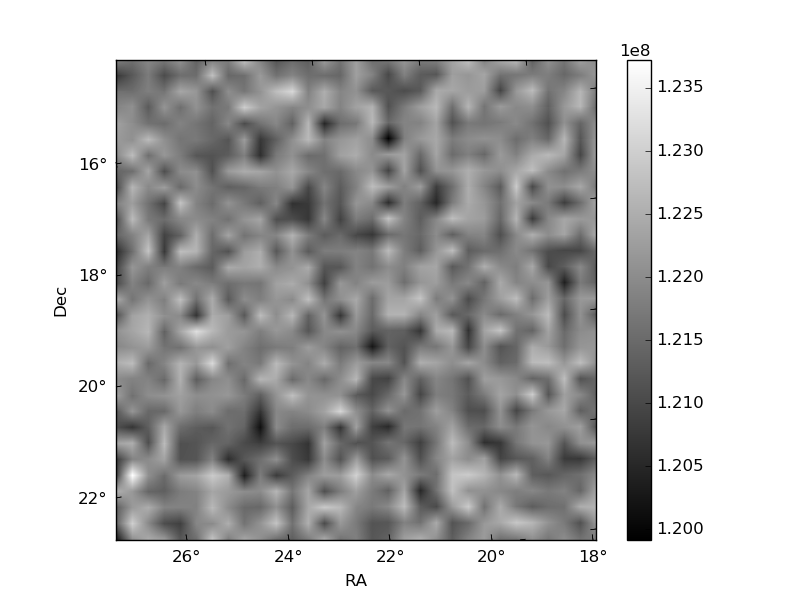
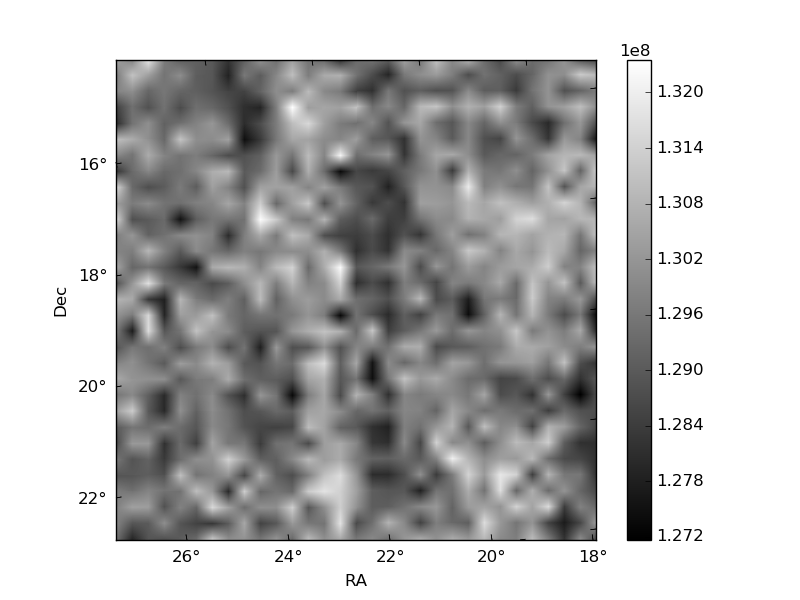
Histogram calculated using DETX and DETY for each event in the final _common_clean file
| Quadrant A | 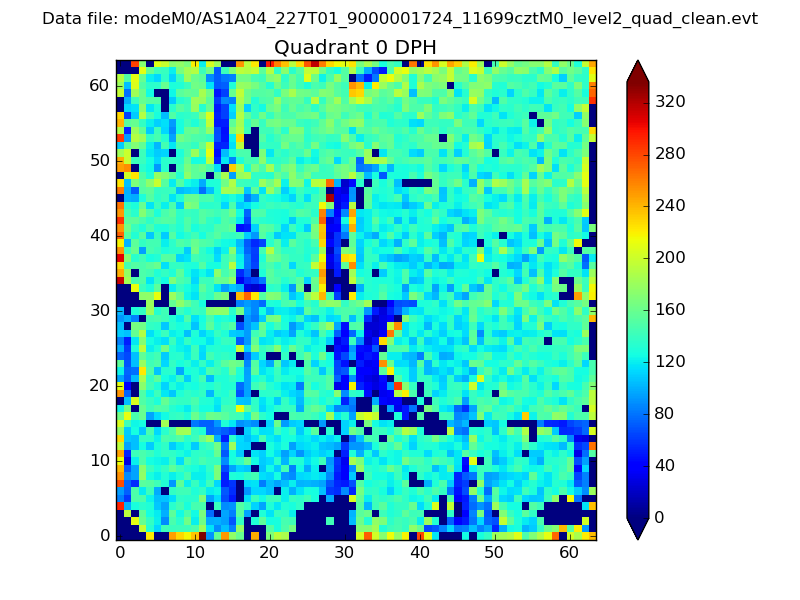 |
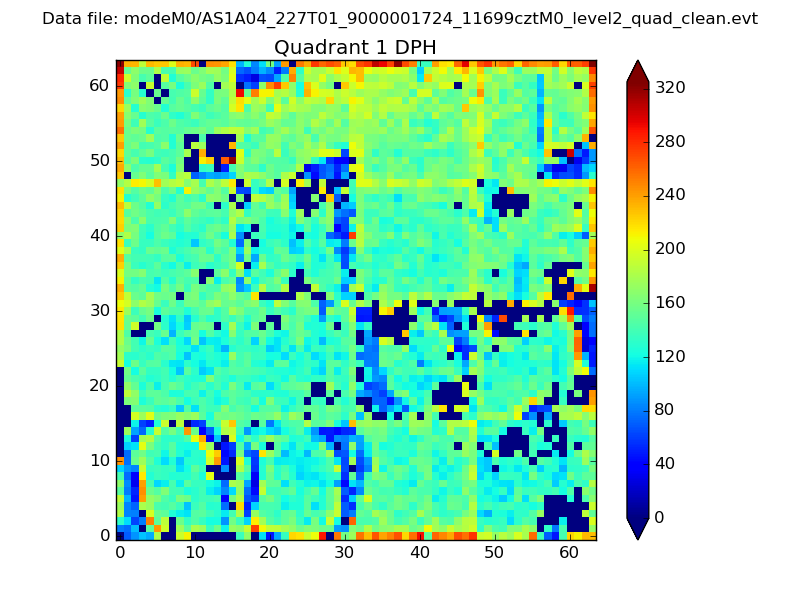 |
Quadrant B |
|---|---|---|---|
| Quadrant D | 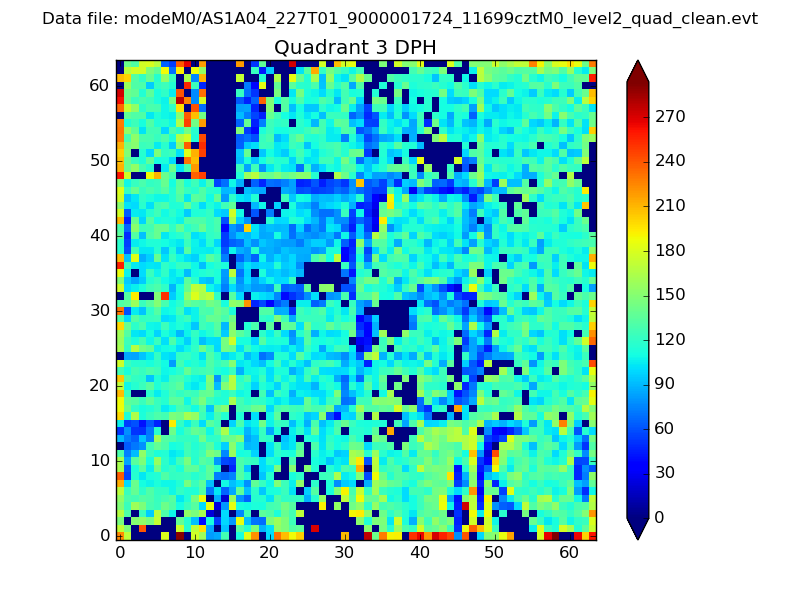 |
 |
Quadrant C |
| Plot type | Count rate plots | Images |
|---|---|---|
| Comparison with Poisson distribution Blue bars denote a histogram of data divided into 1 sec bins. Red curve is a Poisson curve with rate = median count rate of data. |
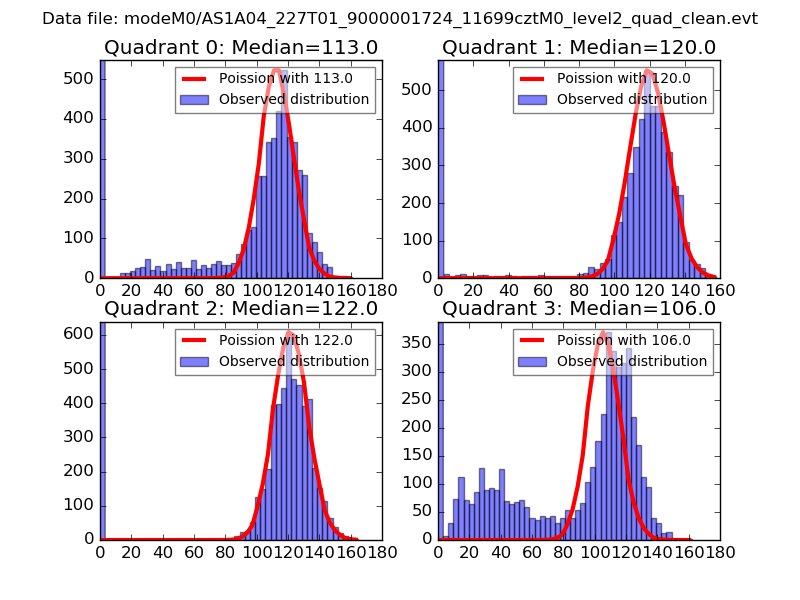 |
 |
| Quadrant-wise count rates Data is divided into 100 sec bins |
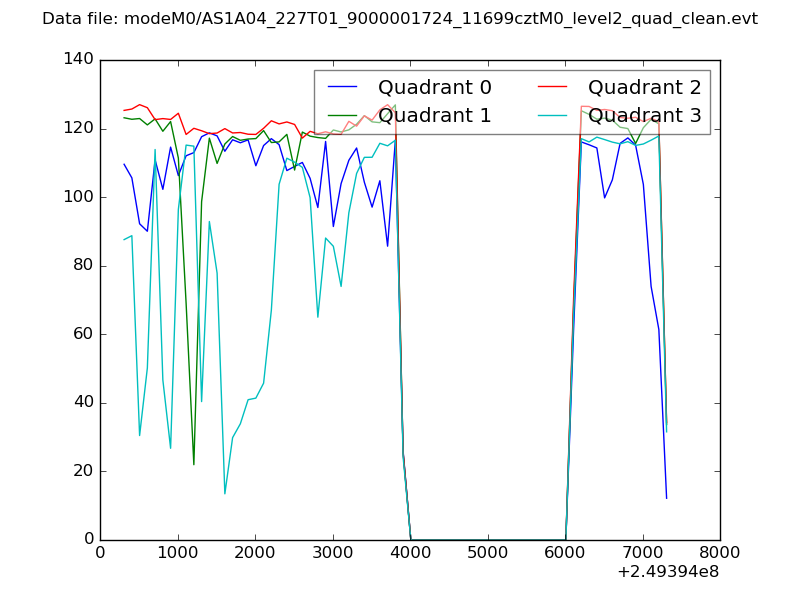 |
|
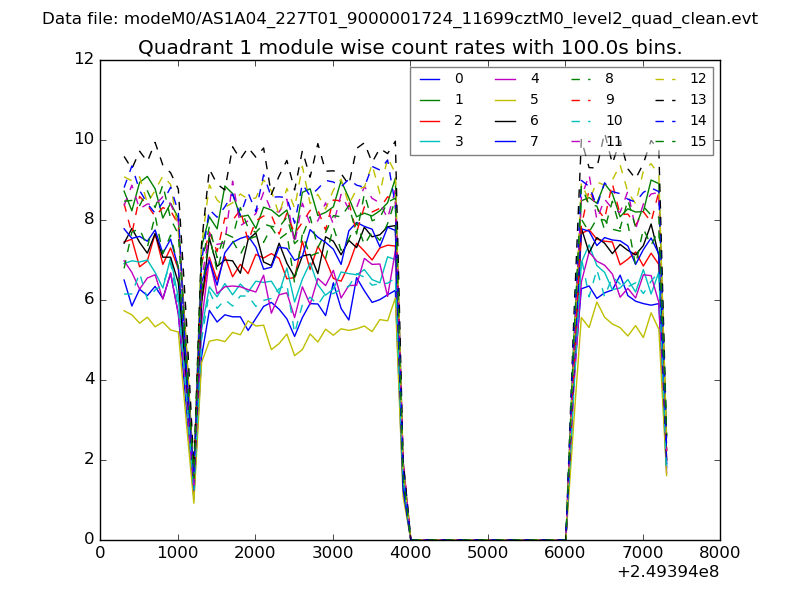
| Module-wise count rates for Quadrant A Data is divided into 100 sec bins |
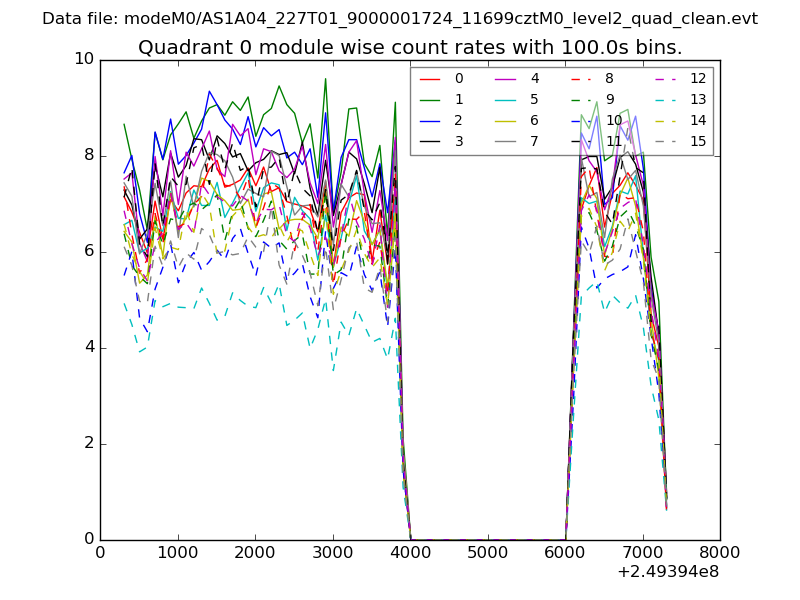 |
 |
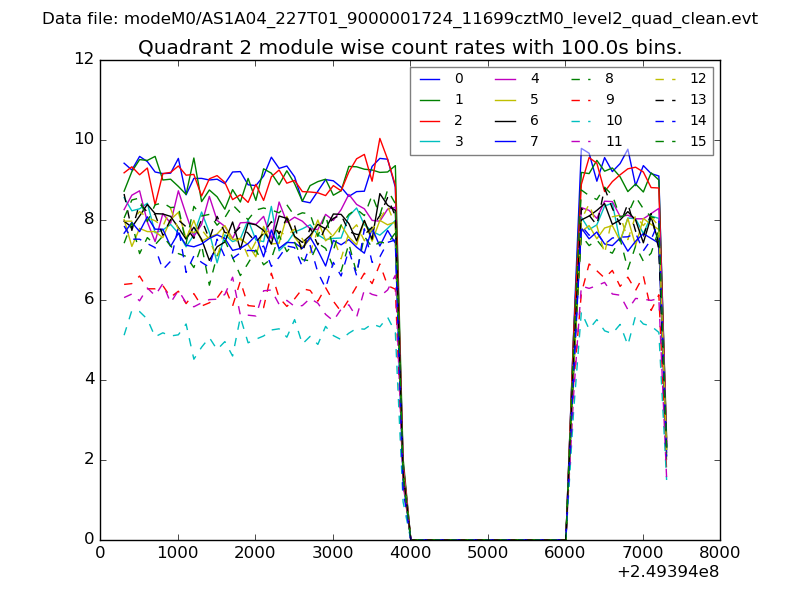
| Module-wise count rates for Quadrant B Data is divided into 100 sec bins |
 |
 |
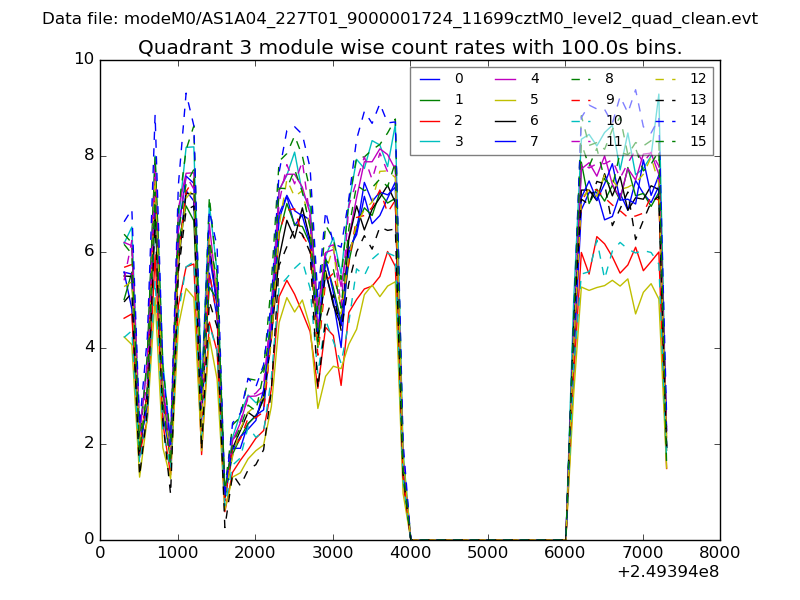
| Module-wise count rates for Quadrant C Data is divided into 100 sec bins |
 |
 |
| Module-wise count rates for Quadrant D Data is divided into 100 sec bins |
 |
 |
| Parameter | Plot |
|---|---|
| CZT HV Monitor | 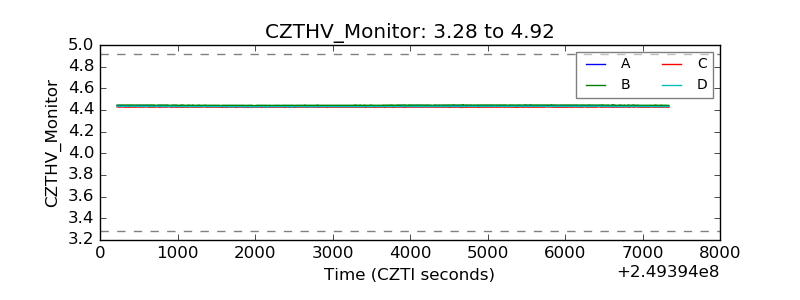 |
| D_VDD |  |
| Temperature 1 | 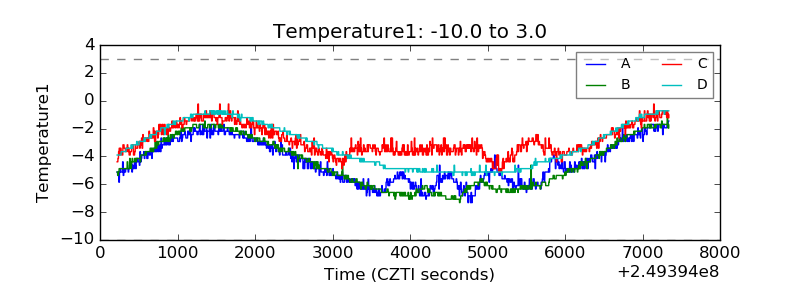 |
| Veto HV Monitor | 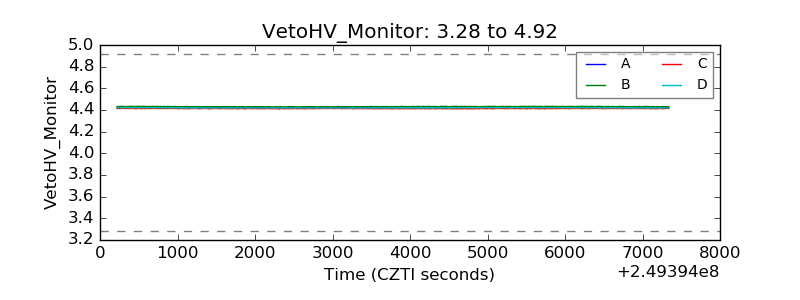 |
| Veto LLD | 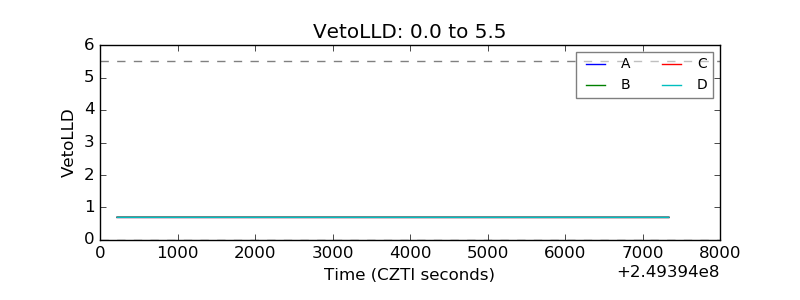 |
| Alpha Counter | 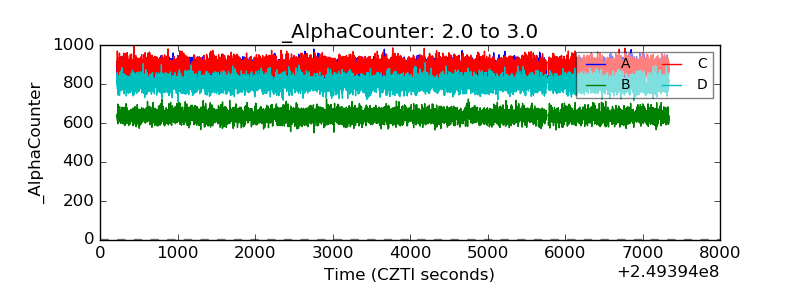 |
| _CPM_Rate | 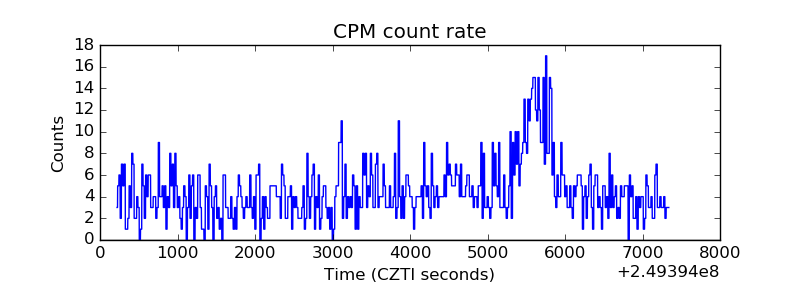 |
| CZT Counter |  |
| +2.5 Volts monitor |  |
| +5 Volts monitor |  |
| _ROLL_ROT | 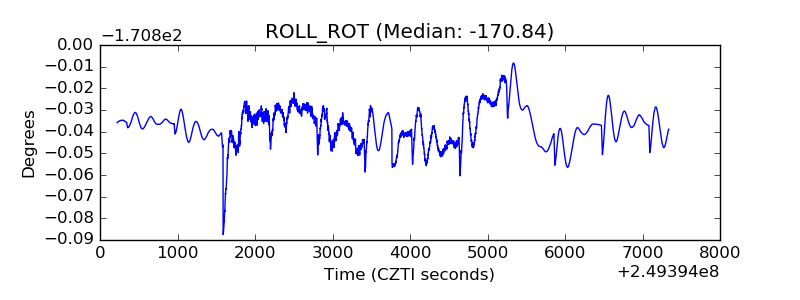 |
| _Roll_DEC | 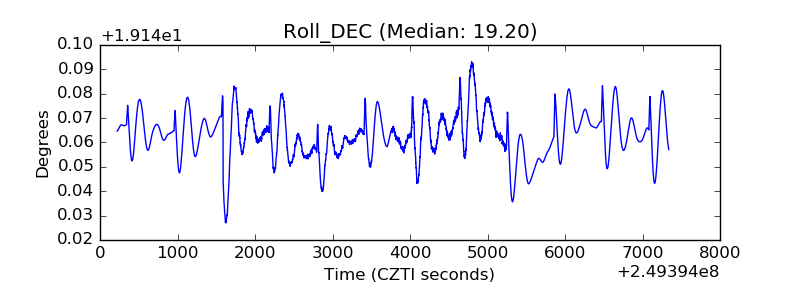 |
| _Roll_RA |  |
| Veto Counter | 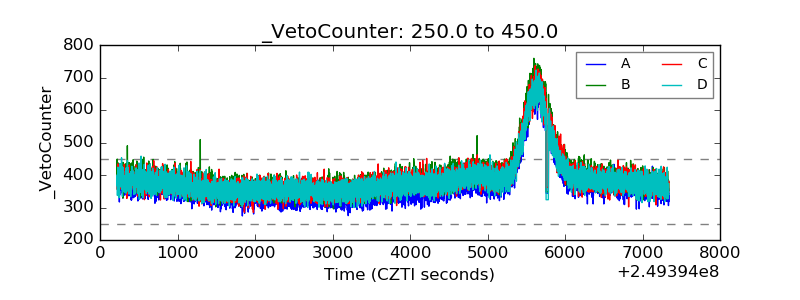 |