| Param | Original file | Final file |
|---|---|---|
| Filename | modeM0/AS1A04_227T01_9000001724_11700cztM0_level2.evt | modeM0/AS1A04_227T01_9000001724_11700cztM0_level2_quad_clean.evt |
| Size (bytes) | 892,704,960 | 97,459,200 |
| Size | 851.3 MB | 92.9 MB |
| Events in quadrant A | 10,748,277 | 520,522 |
| Events in quadrant B | 5,244,776 | 632,700 |
| Events in quadrant C | 3,698,081 | 652,377 |
| Events in quadrant D | 6,814,394 | 598,021 |
| Mode M0 | |||
|---|---|---|---|
| Quadrant | BADHDUFLAG | Total packets | Discarded packets |
| A | 0 | 37503 | 3 |
| B | 0 | 20665 | 2 |
| C | 0 | 16394 | 2 |
| D | 0 | 25593 | 2 |
| Mode SS | |||
|---|---|---|---|
| Quadrant | BADHDUFLAG | Total packets | Discarded packets |
| A | 0 | 160 | 0 |
| B | 0 | 160 | 0 |
| C | 0 | 160 | 0 |
| D | 0 | 160 | 0 |
| Mode M9 | |||
|---|---|---|---|
| Quadrant | BADHDUFLAG | Total packets | Discarded packets |
| A | 0 | 2 | 0 |
| B | 0 | 2 | 0 |
| C | 0 | 2 | 0 |
| D | 0 | 2 | 0 |
| Quadrant | Total seconds | Saturated seconds | Saturation percentage |
|---|---|---|---|
| A | 7865 | 2552 | 32.447552% |
| B | 7865 | 462 | 5.874126% |
| C | 7865 | 74 | 0.940877% |
| D | 7865 | 638 | 8.111888% |
Noise dominated data is calculated using 1-second bins in cleaned event files. If a bin has >2000 counts, and if more than 50% of those come from <1% of pixels, then it is considered to be noise-dominated and hence unusable.
| Quadrant | # 1 sec bins | Bins with >0 counts | Bins with >2000 counts | High rate bins dominated by noise | Noise dominated (total time) | Noise dominated (detector-on time) | Marked lightcurve |
|---|---|---|---|---|---|---|---|
| A | 8046 | 7869 | 1566 | 1566 | 19.46% | 19.90% | 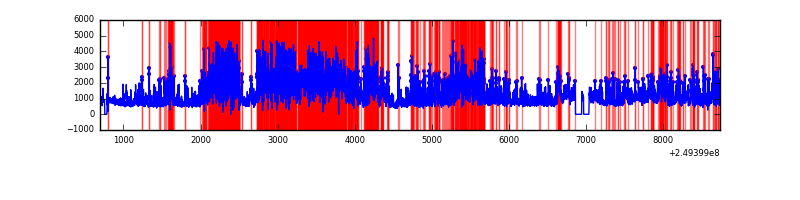 |
| B | 8046 | 7869 | 158 | 158 | 1.96% | 2.01% | 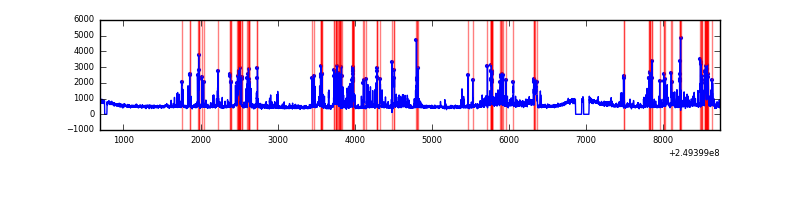 |
| C | 8046 | 7869 | 0 | 0 | 0.00% | 0.00% | 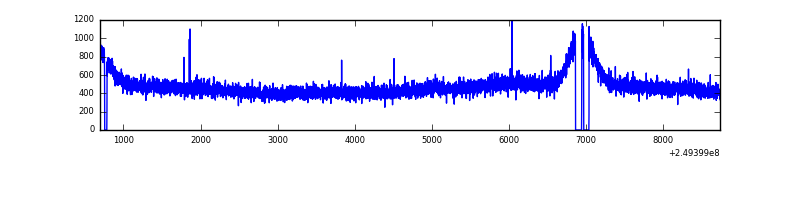 |
| D | 8046 | 7869 | 413 | 413 | 5.13% | 5.25% | 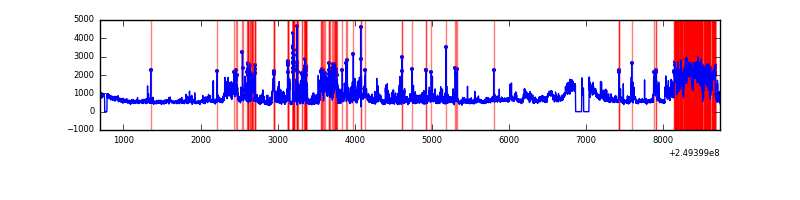 |
Top three noisy pixels from each quadrant. If the there are fewer than three noisy pixels in the level2.evt file, extra rows are filled as -1
| Pixel properties | Quadrant properties | ||||||
|---|---|---|---|---|---|---|---|
| Quadrant | DetID | PixID | Counts | Sigma | Mean | Median | Sigma |
| A | 8 | 5 | 5625804 | 31456.62 | 864 | 845 | 178.8 |
| A | 6 | 16 | 1057604 | 5909.74 | 864 | 845 | 178.8 |
| A | 1 | 162 | 248263 | 1383.64 | 864 | 845 | 178.8 |
| B | 3 | 64 | 627008 | 3359.83 | 960 | 934 | 186.3 |
| B | 4 | 239 | 579501 | 3104.88 | 960 | 934 | 186.3 |
| B | 0 | 219 | 101568 | 540.05 | 960 | 934 | 186.3 |
| C | 13 | 61 | 6847 | 26.75 | 946 | 951 | 220.4 |
| C | 8 | 222 | 5831 | 22.14 | 946 | 951 | 220.4 |
| C | 14 | 234 | 2817 | 8.47 | 946 | 951 | 220.4 |
| D | 13 | 152 | 1834354 | 8123.47 | 926 | 898 | 225.7 |
| D | 1 | 52 | 744669 | 3295.42 | 926 | 898 | 225.7 |
| D | 8 | 195 | 379561 | 1677.74 | 926 | 898 | 225.7 |
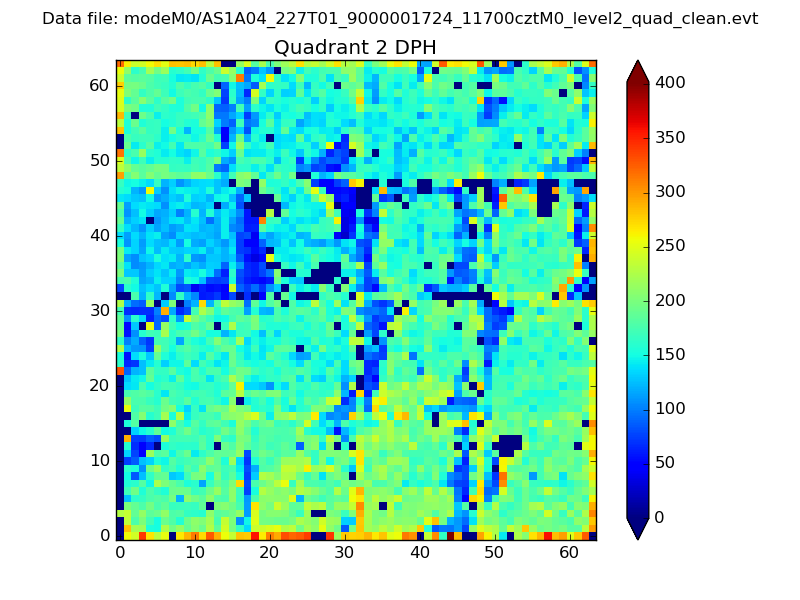
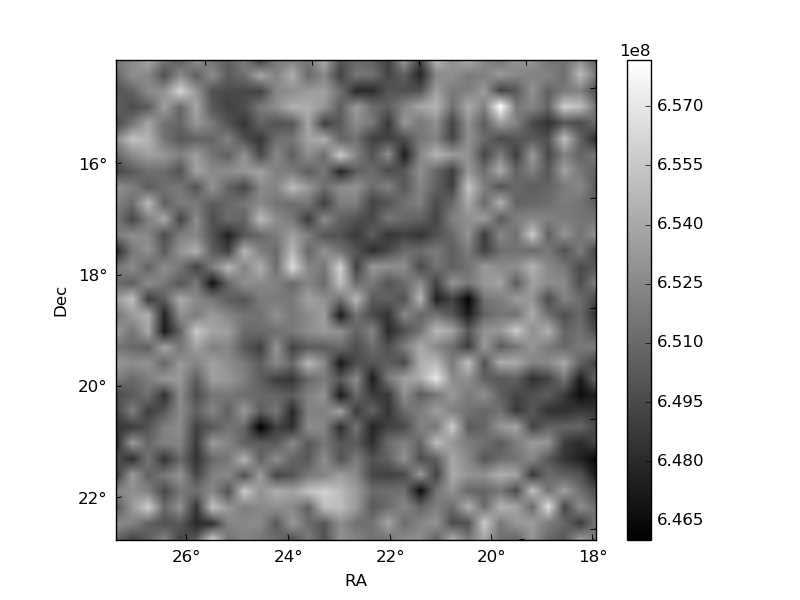
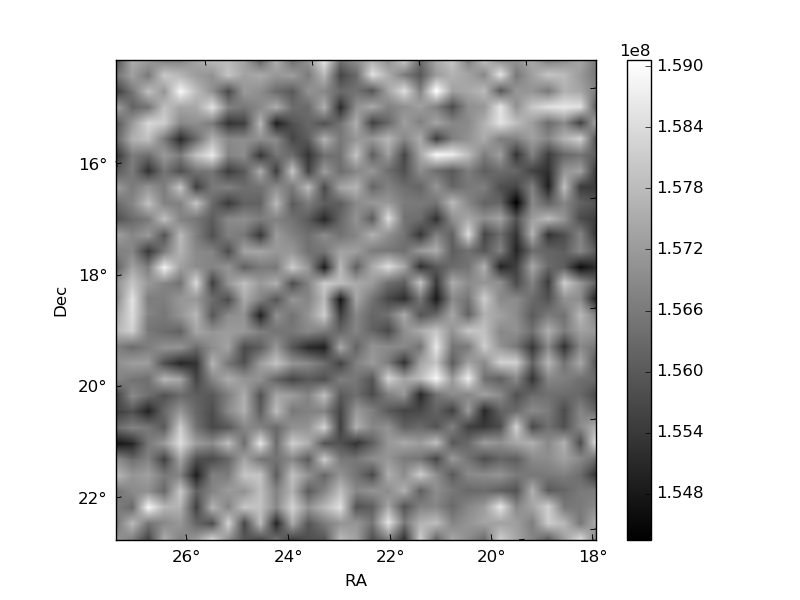
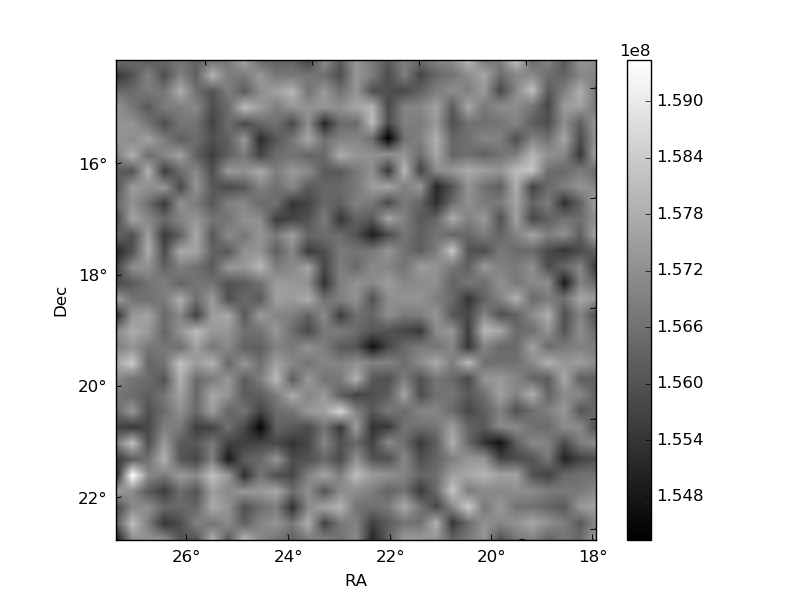
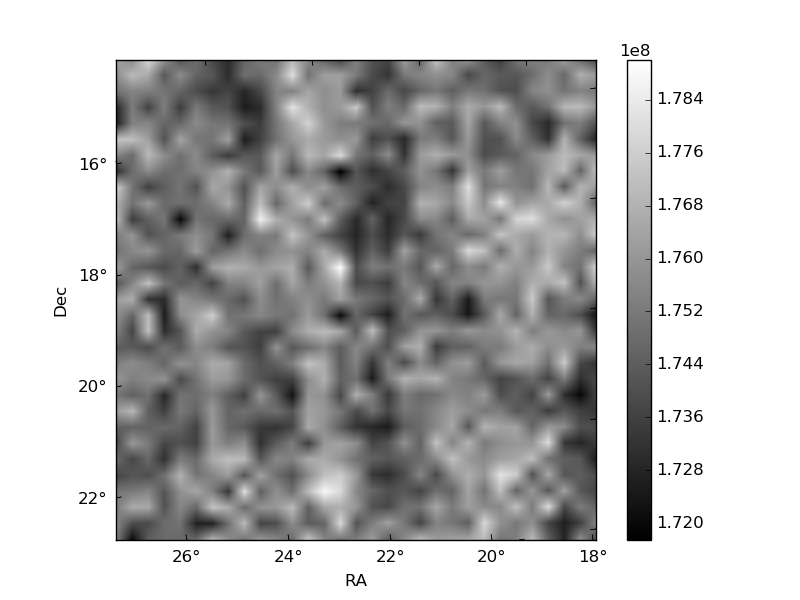
Histogram calculated using DETX and DETY for each event in the final _common_clean file
| Quadrant A | 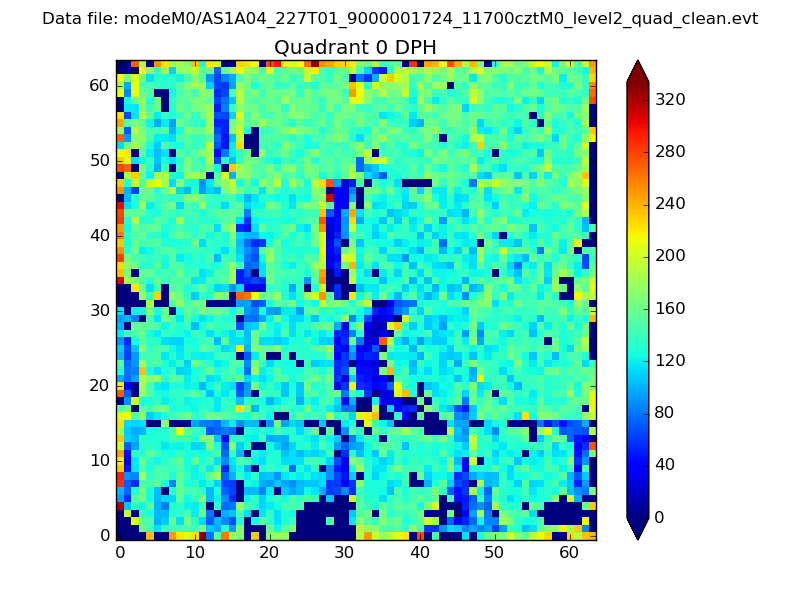 |
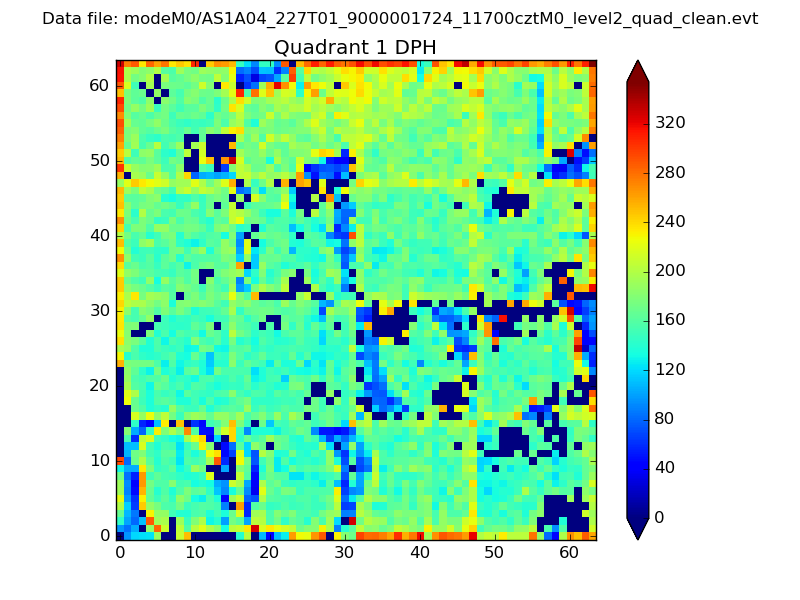 |
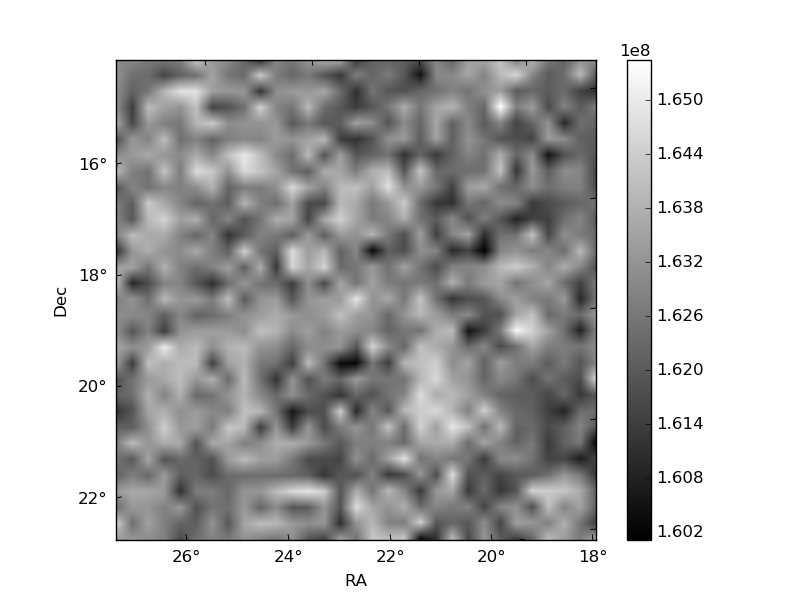
Quadrant B |
|---|---|---|---|
| Quadrant D | 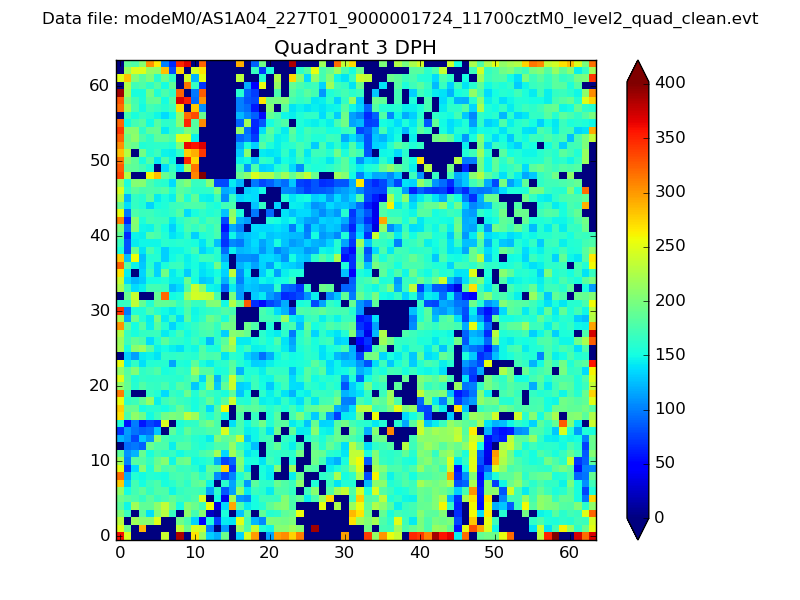 |
 |
Quadrant C |
| Plot type | Count rate plots | Images |
|---|---|---|
| Comparison with Poisson distribution Blue bars denote a histogram of data divided into 1 sec bins. Red curve is a Poisson curve with rate = median count rate of data. |
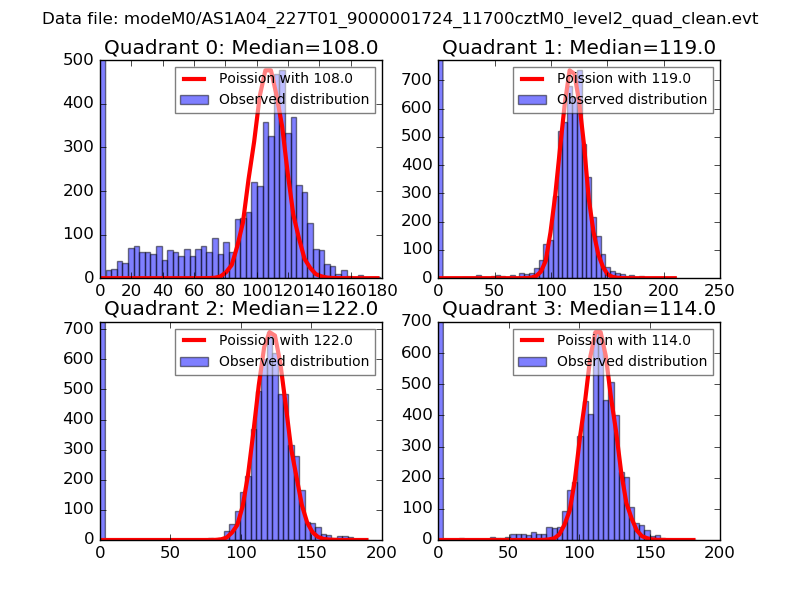 |
 |
| Quadrant-wise count rates Data is divided into 100 sec bins |
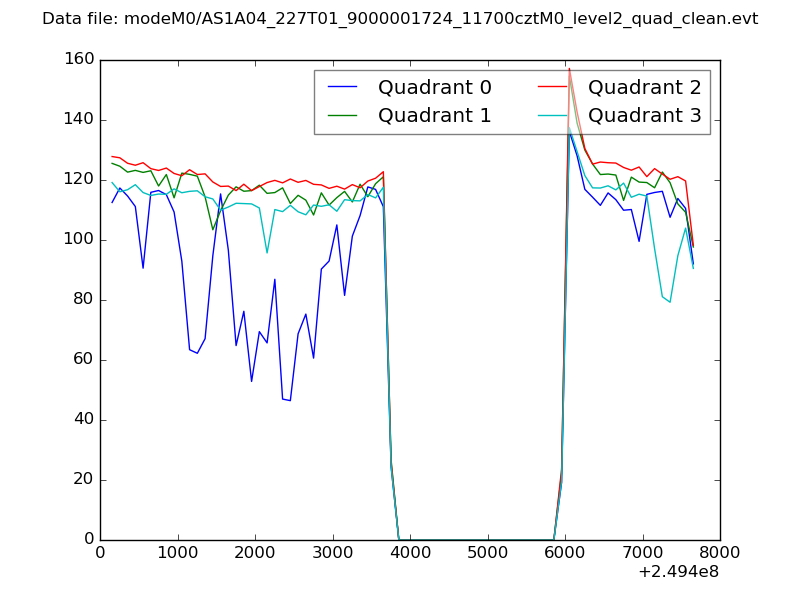 |
|
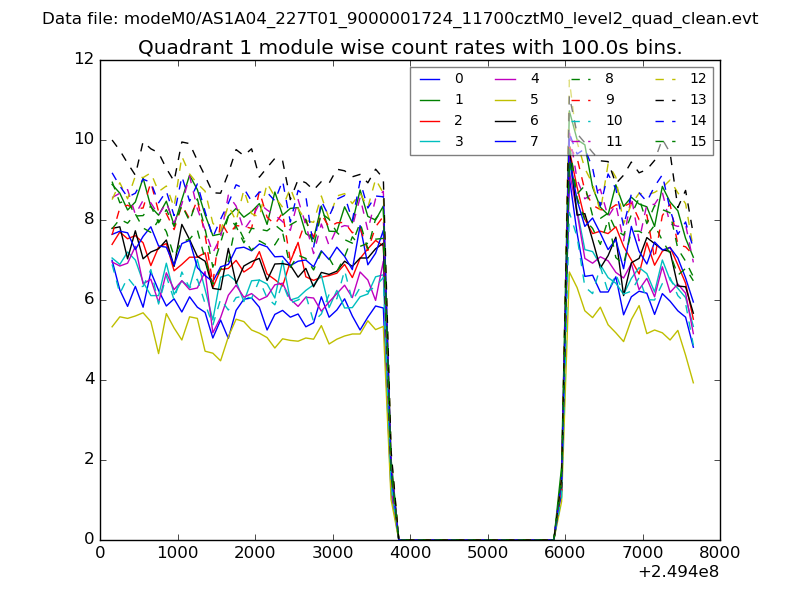
| Module-wise count rates for Quadrant A Data is divided into 100 sec bins |
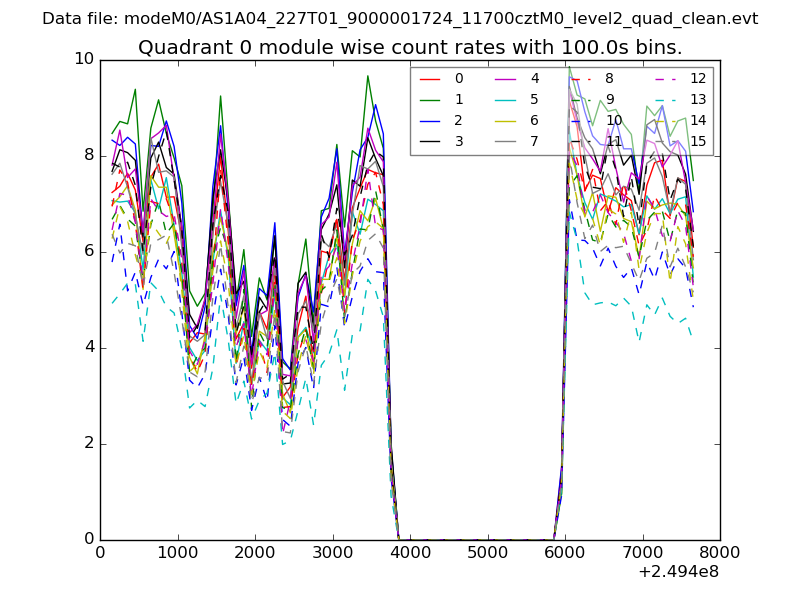 |
 |
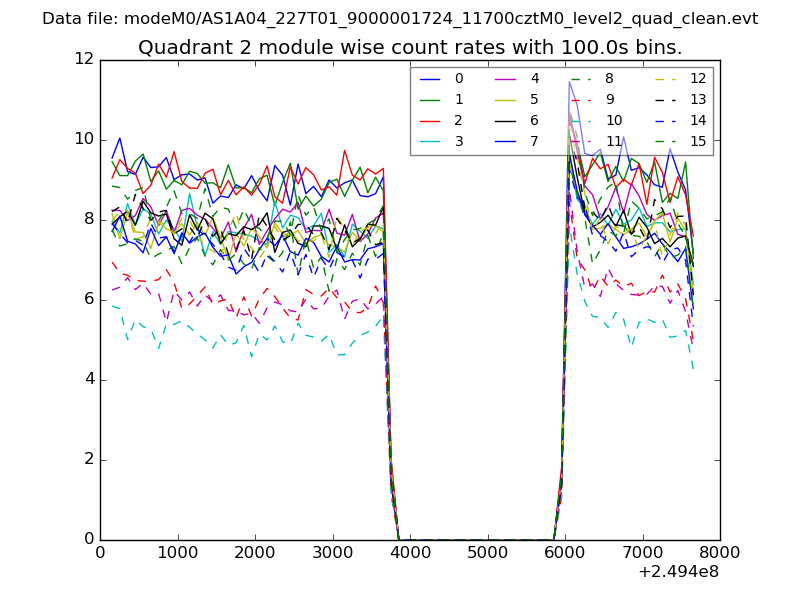
| Module-wise count rates for Quadrant B Data is divided into 100 sec bins |
 |
 |
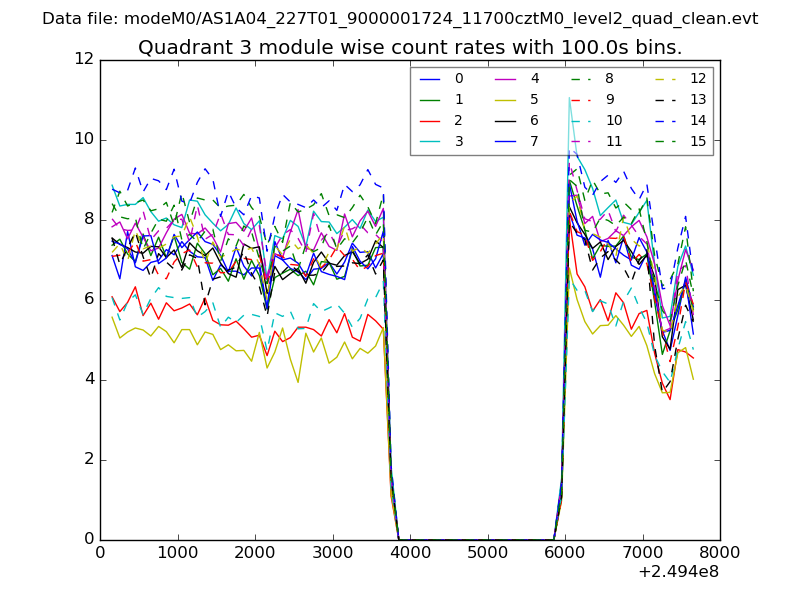
| Module-wise count rates for Quadrant C Data is divided into 100 sec bins |
 |
 |
| Module-wise count rates for Quadrant D Data is divided into 100 sec bins |
 |
 |
| Parameter | Plot |
|---|---|
| CZT HV Monitor | 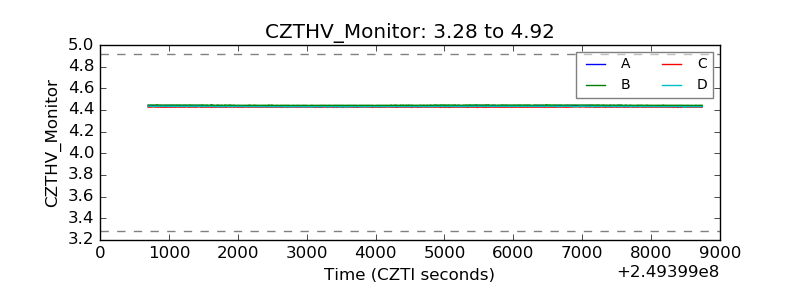 |
| D_VDD | 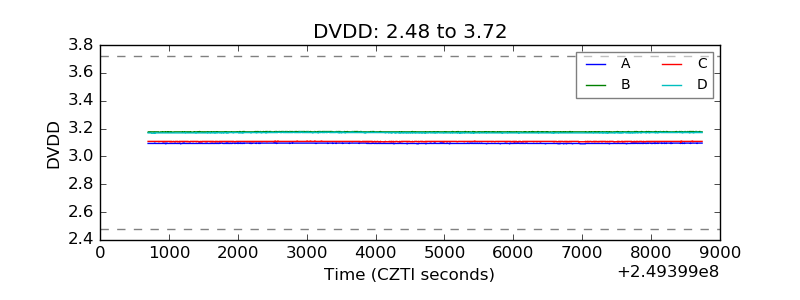 |
| Temperature 1 |  |
| Veto HV Monitor | 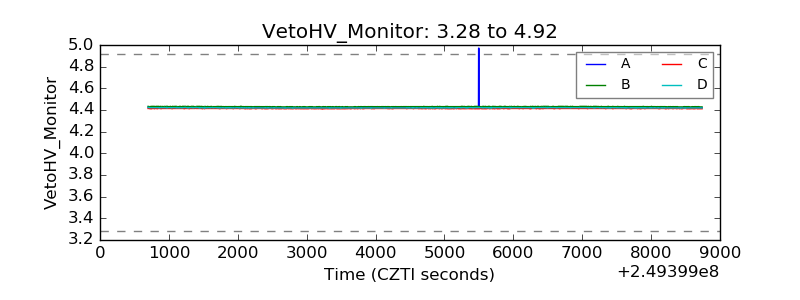 |
| Veto LLD | 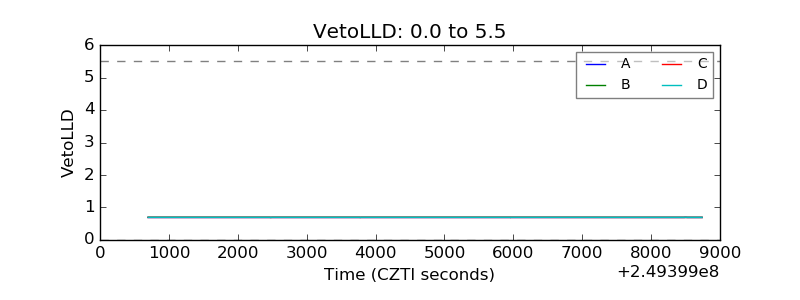 |
| Alpha Counter | 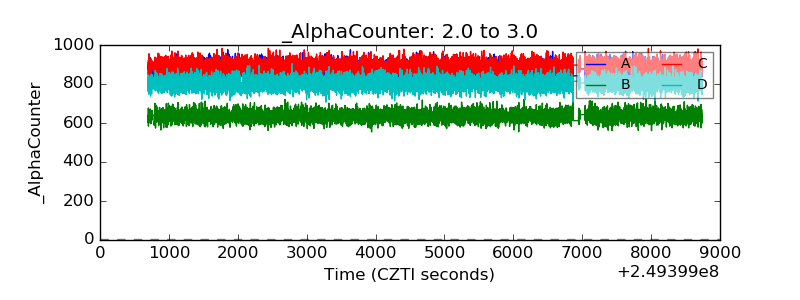 |
| _CPM_Rate |  |
| CZT Counter | 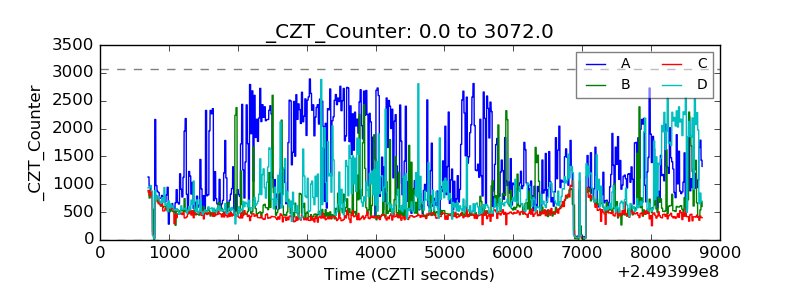 |
| +2.5 Volts monitor |  |
| +5 Volts monitor |  |
| _ROLL_ROT | 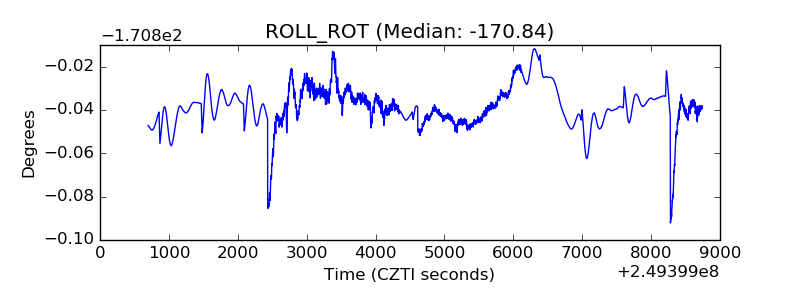 |
| _Roll_DEC |  |
| _Roll_RA | 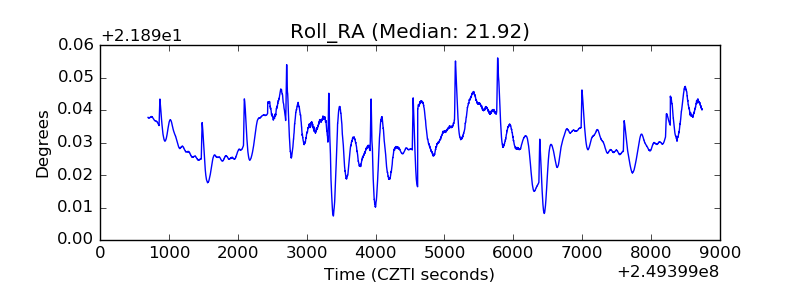 |
| Veto Counter | 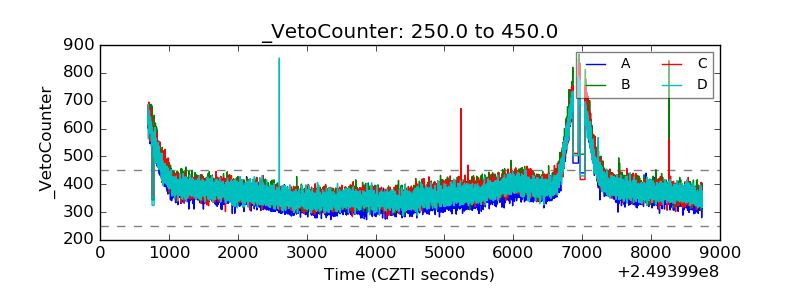 |