| Param | Original file | Final file |
|---|---|---|
| Filename | modeM0/AS1A04_227T01_9000001724_11703cztM0_level2.evt | modeM0/AS1A04_227T01_9000001724_11703cztM0_level2_quad_clean.evt |
| Size (bytes) | 2,309,388,480 | 213,586,560 |
| Size | 2.2 GB | 203.7 MB |
| Events in quadrant A | 22,193,150 | 1,276,852 |
| Events in quadrant B | 11,225,834 | 1,383,461 |
| Events in quadrant C | 8,253,303 | 1,426,666 |
| Events in quadrant D | 27,041,675 | 1,118,476 |
| Mode M0 | |||
|---|---|---|---|
| Quadrant | BADHDUFLAG | Total packets | Discarded packets |
| A | 0 | 78829 | 4 |
| B | 0 | 45221 | 3 |
| C | 0 | 37314 | 3 |
| D | 0 | 92893 | 3 |
| Mode SS | |||
|---|---|---|---|
| Quadrant | BADHDUFLAG | Total packets | Discarded packets |
| A | 0 | 370 | 0 |
| B | 0 | 370 | 0 |
| C | 0 | 370 | 0 |
| D | 0 | 370 | 0 |
| Mode M9 | |||
|---|---|---|---|
| Quadrant | BADHDUFLAG | Total packets | Discarded packets |
| A | 0 | 18 | 0 |
| B | 0 | 18 | 0 |
| C | 0 | 18 | 0 |
| D | 0 | 18 | 0 |
| Quadrant | Total seconds | Saturated seconds | Saturation percentage |
|---|---|---|---|
| A | 18283 | 3946 | 21.582891% |
| B | 18283 | 669 | 3.659137% |
| C | 18283 | 98 | 0.536017% |
| D | 18283 | 6503 | 35.568561% |
Noise dominated data is calculated using 1-second bins in cleaned event files. If a bin has >2000 counts, and if more than 50% of those come from <1% of pixels, then it is considered to be noise-dominated and hence unusable.
| Quadrant | # 1 sec bins | Bins with >0 counts | Bins with >2000 counts | High rate bins dominated by noise | Noise dominated (total time) | Noise dominated (detector-on time) | Marked lightcurve |
|---|---|---|---|---|---|---|---|
| A | 20044 | 18287 | 2467 | 2467 | 12.31% | 13.49% | 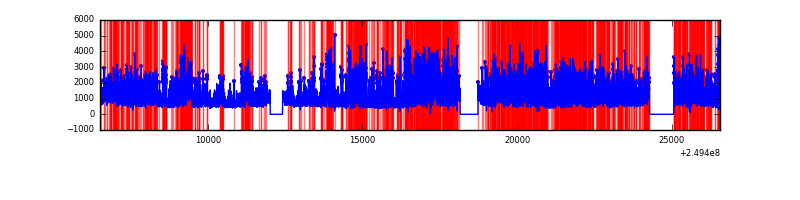 |
| B | 20044 | 18287 | 322 | 322 | 1.61% | 1.76% | 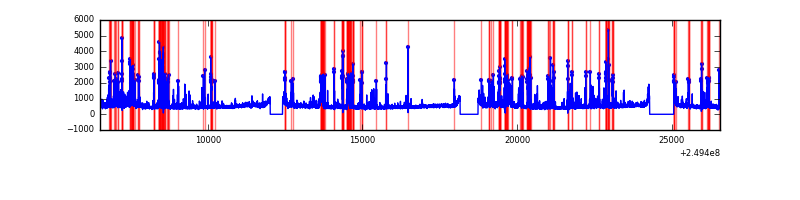 |
| C | 20044 | 18287 | 0 | 0 | 0.00% | 0.00% | 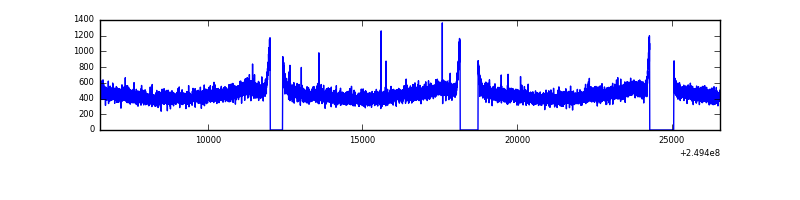 |
| D | 20044 | 18287 | 5041 | 5041 | 25.15% | 27.57% | 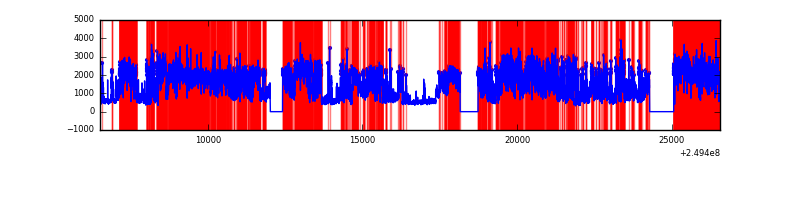 |
Top three noisy pixels from each quadrant. If the there are fewer than three noisy pixels in the level2.evt file, extra rows are filled as -1
| Pixel properties | Quadrant properties | ||||||
|---|---|---|---|---|---|---|---|
| Quadrant | DetID | PixID | Counts | Sigma | Mean | Median | Sigma |
| A | 8 | 5 | 12356060 | 30113.4 | 1999 | 1950 | 410.3 |
| A | 1 | 162 | 516033 | 1253.09 | 1999 | 1950 | 410.3 |
| A | 6 | 16 | 403957 | 979.9 | 1999 | 1950 | 410.3 |
| B | 4 | 239 | 1241667 | 3018.15 | 2142 | 2080 | 410.7 |
| B | 3 | 64 | 1038987 | 2524.66 | 2142 | 2080 | 410.7 |
| B | 15 | 204 | 176347 | 424.31 | 2142 | 2080 | 410.7 |
| C | 13 | 61 | 15496 | 27.28 | 2114 | 2127 | 490.0 |
| C | 8 | 222 | 15140 | 26.56 | 2114 | 2127 | 490.0 |
| C | 3 | 202 | 5142 | 6.15 | 2114 | 2127 | 490.0 |
| D | 13 | 152 | 17353829 | 38756.93 | 1855 | 1803 | 447.7 |
| D | 8 | 195 | 901682 | 2009.94 | 1855 | 1803 | 447.7 |
| D | 7 | 80 | 746135 | 1662.52 | 1855 | 1803 | 447.7 |
Histogram calculated using DETX and DETY for each event in the final _common_clean file
| Quadrant A | 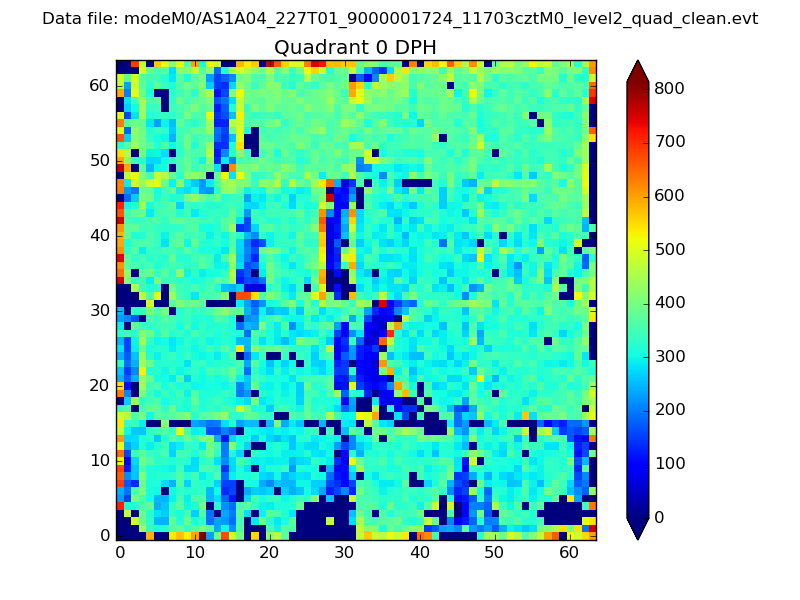 |
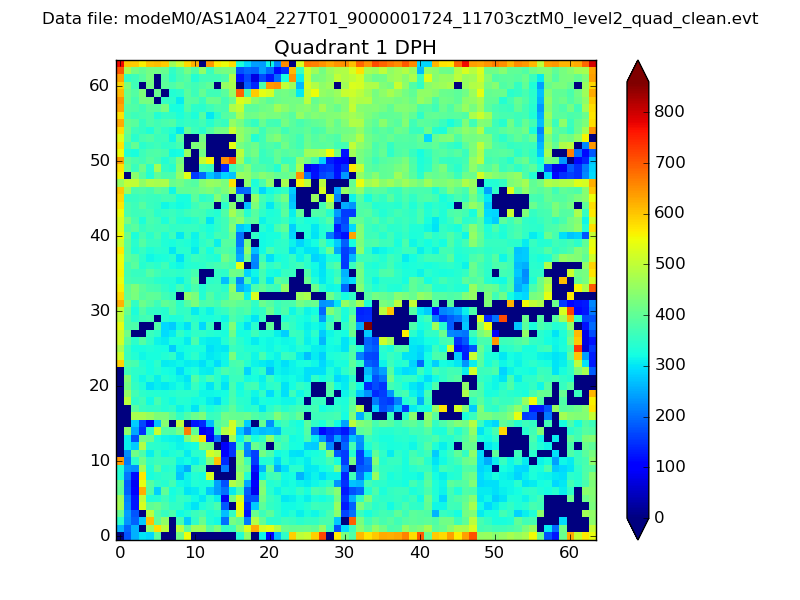 |
Quadrant B |
|---|---|---|---|
| Quadrant D |  |
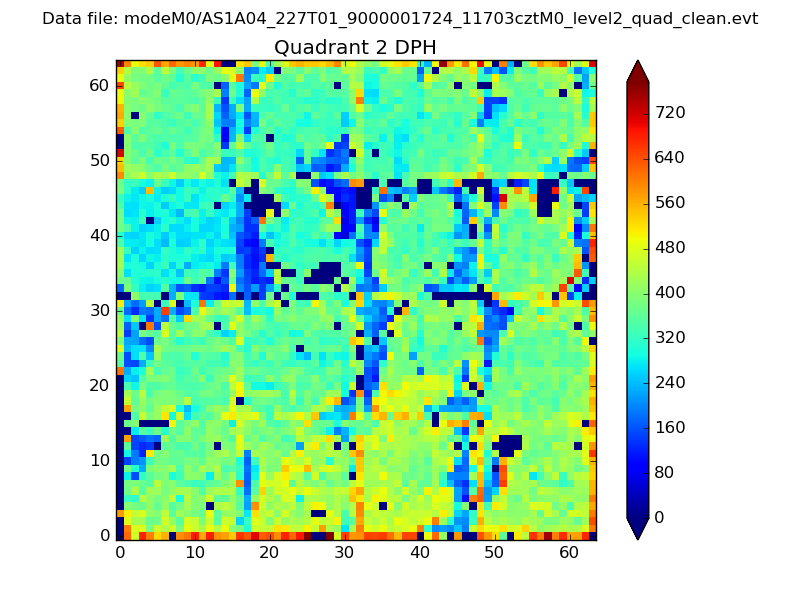 |
Quadrant C |
| Plot type | Count rate plots | Images |
|---|---|---|
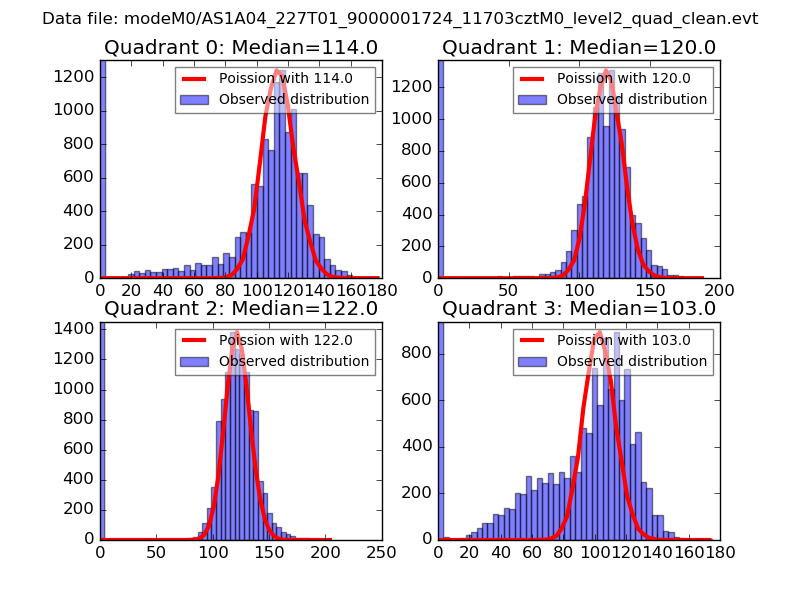
| Comparison with Poisson distribution Blue bars denote a histogram of data divided into 1 sec bins. Red curve is a Poisson curve with rate = median count rate of data. |
 |
 |
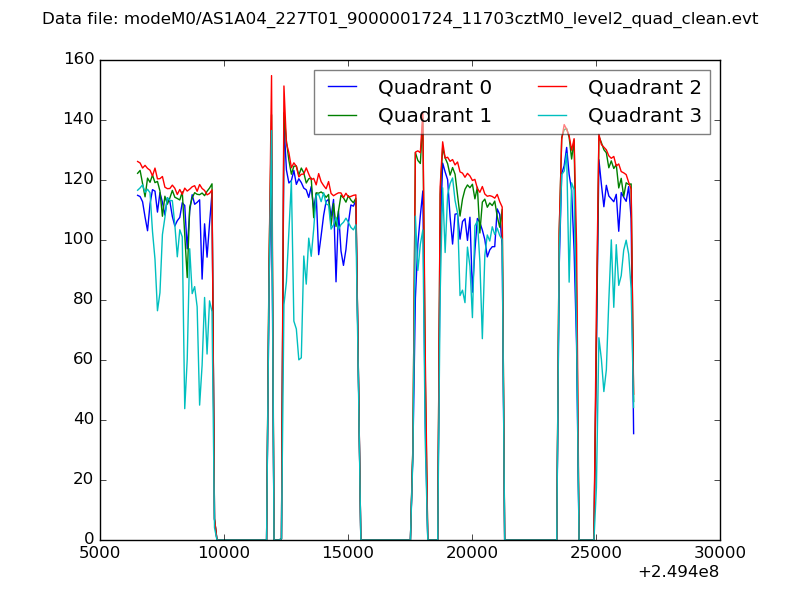
| Quadrant-wise count rates Data is divided into 100 sec bins |
 |
|
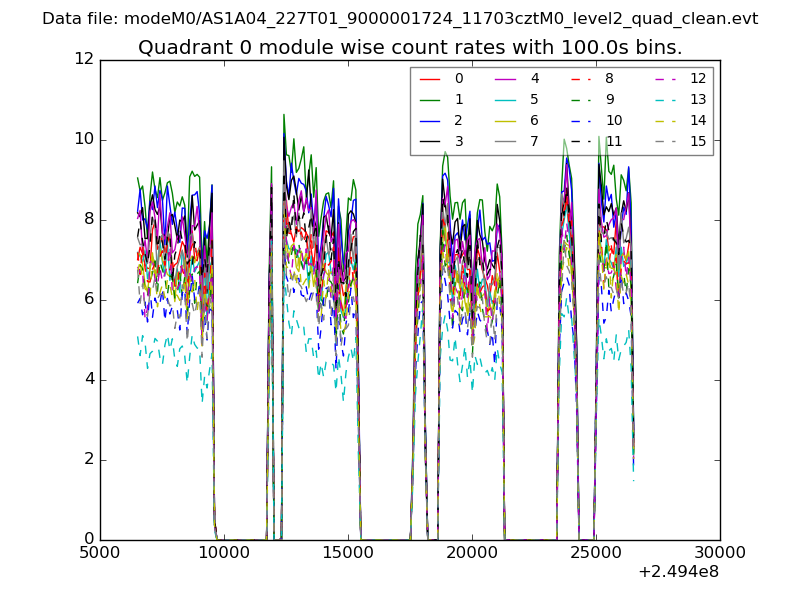
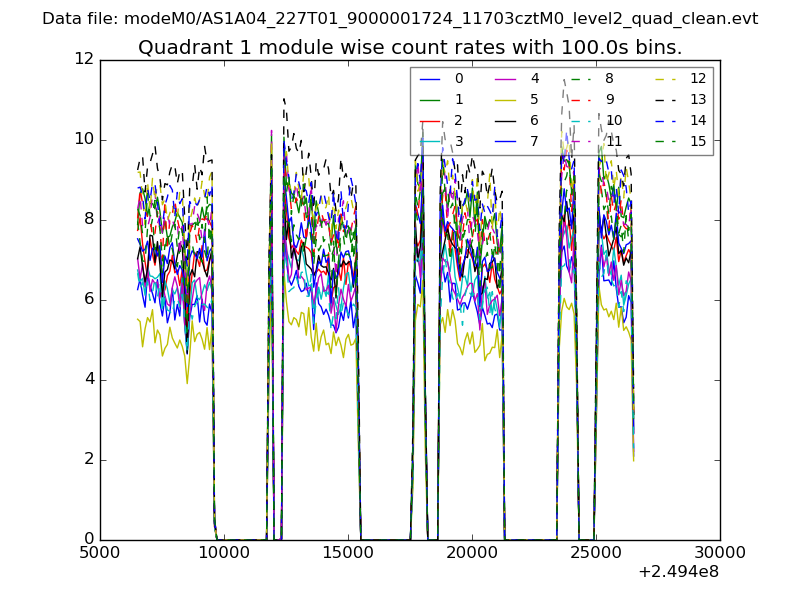
| Module-wise count rates for Quadrant A Data is divided into 100 sec bins |
 |
 |
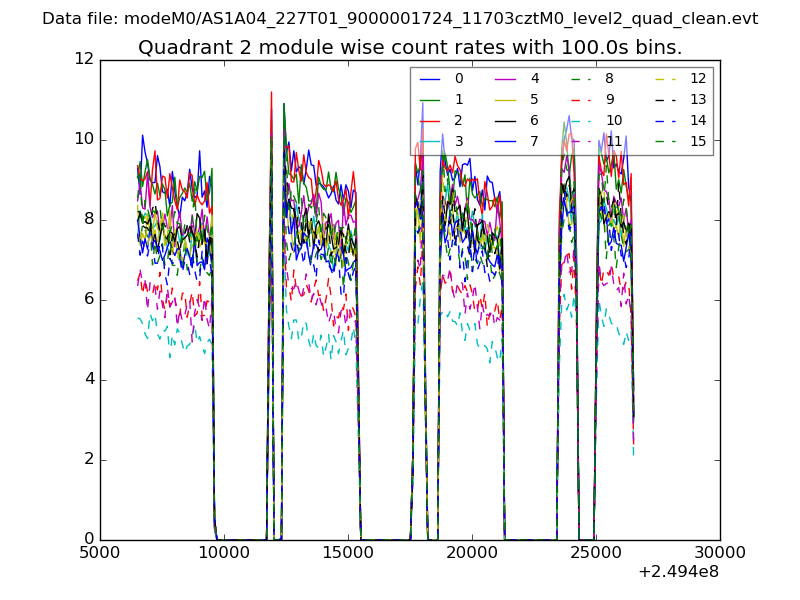
| Module-wise count rates for Quadrant B Data is divided into 100 sec bins |
 |
 |
| Module-wise count rates for Quadrant C Data is divided into 100 sec bins |
 |
 |
| Module-wise count rates for Quadrant D Data is divided into 100 sec bins |
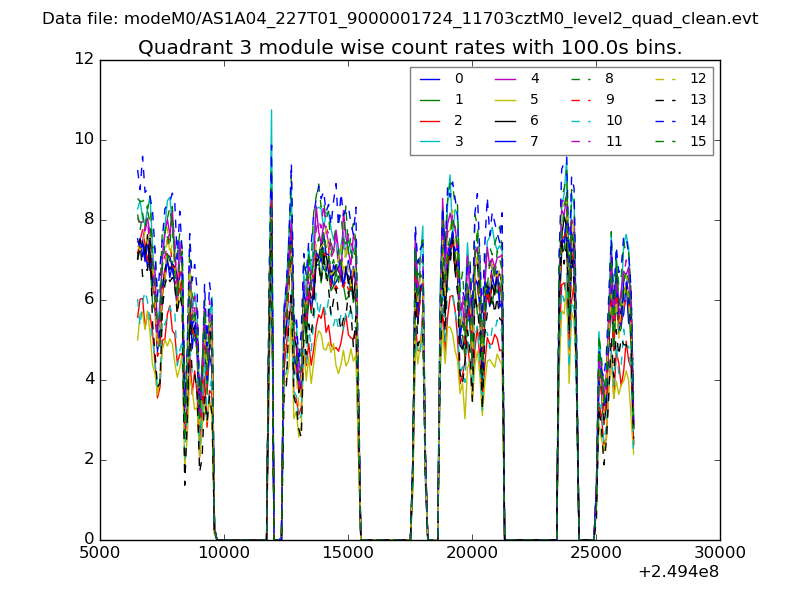 |
 |
| Parameter | Plot |
|---|---|
| CZT HV Monitor | 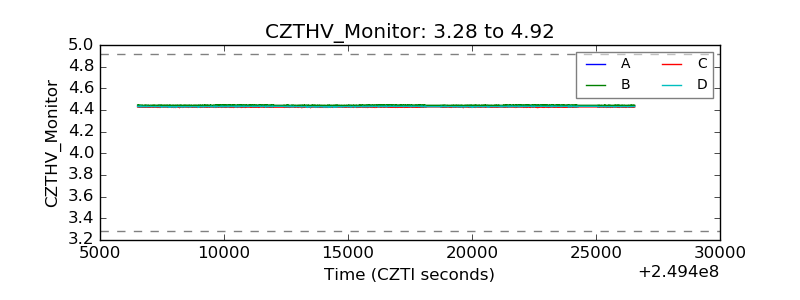 |
| D_VDD | 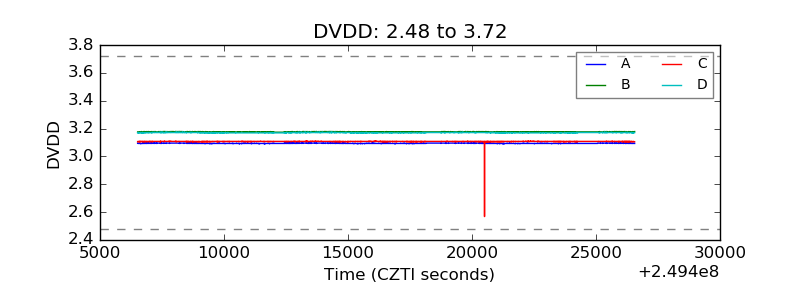 |
| Temperature 1 | 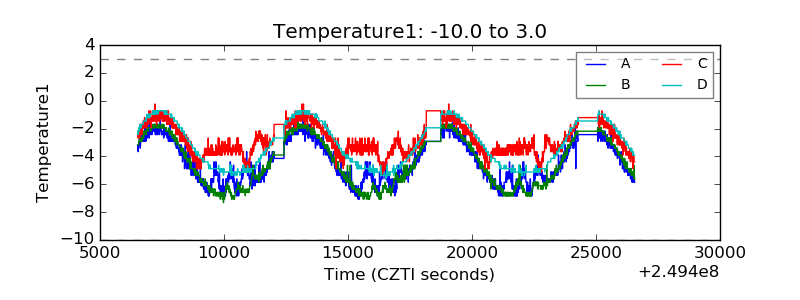 |
| Veto HV Monitor | 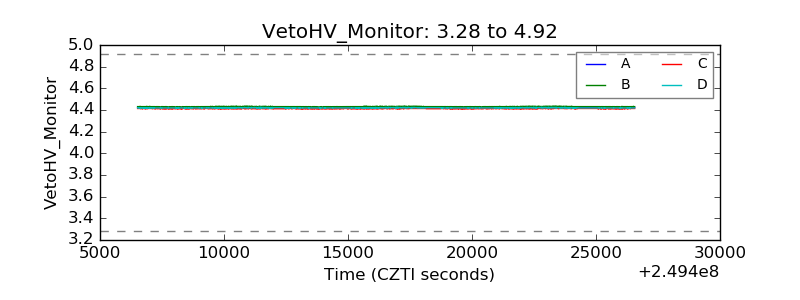 |
| Veto LLD | 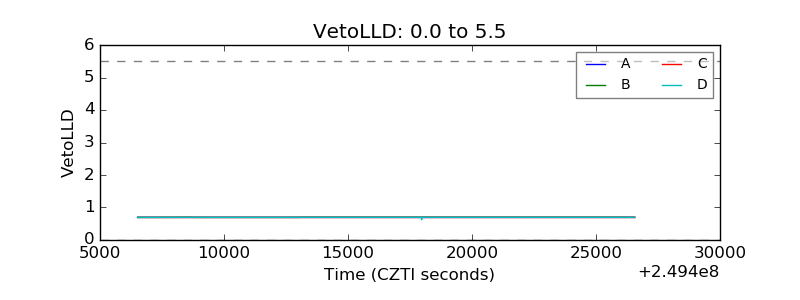 |
| Alpha Counter | 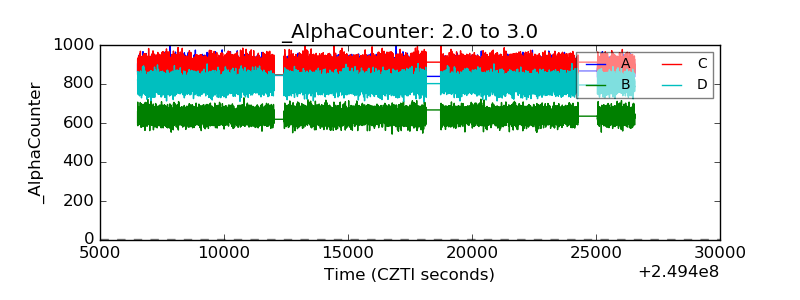 |
| _CPM_Rate | 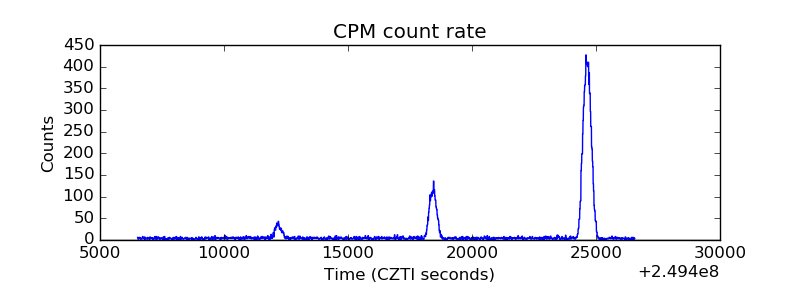 |
| CZT Counter |  |
| +2.5 Volts monitor |  |
| +5 Volts monitor |  |
| _ROLL_ROT | 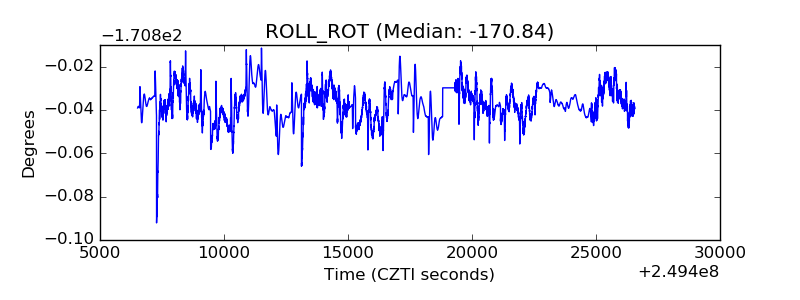 |
| _Roll_DEC | 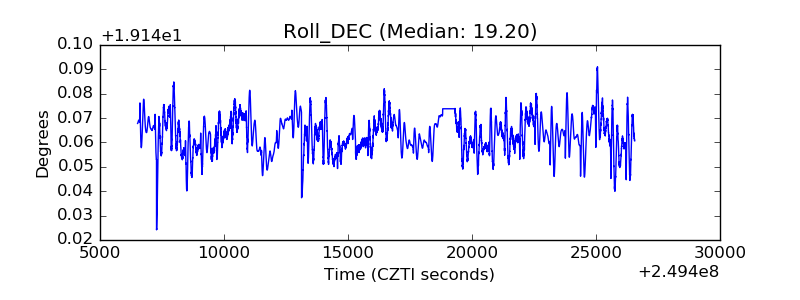 |
| _Roll_RA | 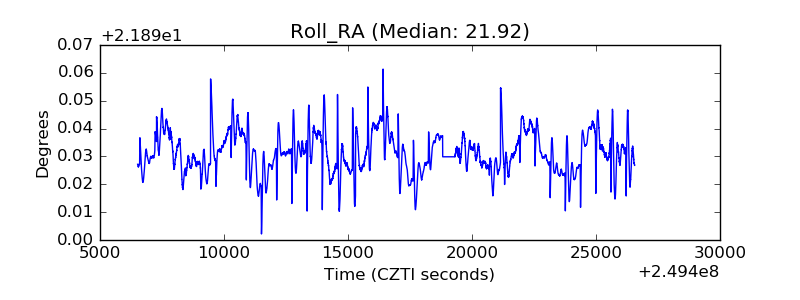 |
| Veto Counter | 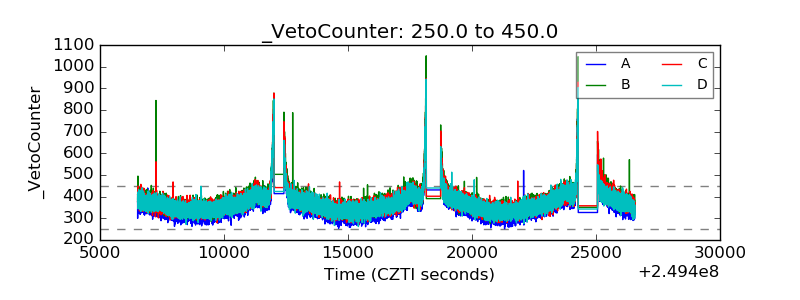 |