| Param | Original file | Final file |
|---|---|---|
| Filename | modeM0/AS1A04_227T01_9000001724_11704cztM0_level2.evt | modeM0/AS1A04_227T01_9000001724_11704cztM0_level2_quad_clean.evt |
| Size (bytes) | 915,707,520 | 84,055,680 |
| Size | 873.3 MB | 80.2 MB |
| Events in quadrant A | 6,393,222 | 528,753 |
| Events in quadrant B | 4,260,573 | 560,985 |
| Events in quadrant C | 3,019,133 | 572,326 |
| Events in quadrant D | 13,608,105 | 415,308 |
| Mode M0 | |||
|---|---|---|---|
| Quadrant | BADHDUFLAG | Total packets | Discarded packets |
| A | 0 | 23614 | 3 |
| B | 0 | 16965 | 2 |
| C | 0 | 13541 | 2 |
| D | 0 | 44972 | 2 |
| Mode SS | |||
|---|---|---|---|
| Quadrant | BADHDUFLAG | Total packets | Discarded packets |
| A | 0 | 138 | 0 |
| B | 0 | 138 | 0 |
| C | 0 | 138 | 0 |
| D | 0 | 138 | 0 |
| Mode M9 | |||
|---|---|---|---|
| Quadrant | BADHDUFLAG | Total packets | Discarded packets |
| A | 0 | 11 | 0 |
| B | 0 | 11 | 0 |
| C | 0 | 11 | 0 |
| D | 0 | 12 | 0 |
| Quadrant | Total seconds | Saturated seconds | Saturation percentage |
|---|---|---|---|
| A | 6682 | 704 | 10.535768% |
| B | 6682 | 276 | 4.130500% |
| C | 6682 | 18 | 0.269380% |
| D | 6682 | 4597 | 68.796767% |
Noise dominated data is calculated using 1-second bins in cleaned event files. If a bin has >2000 counts, and if more than 50% of those come from <1% of pixels, then it is considered to be noise-dominated and hence unusable.
| Quadrant | # 1 sec bins | Bins with >0 counts | Bins with >2000 counts | High rate bins dominated by noise | Noise dominated (total time) | Noise dominated (detector-on time) | Marked lightcurve |
|---|---|---|---|---|---|---|---|
| A | 7633 | 6684 | 425 | 425 | 5.57% | 6.36% | 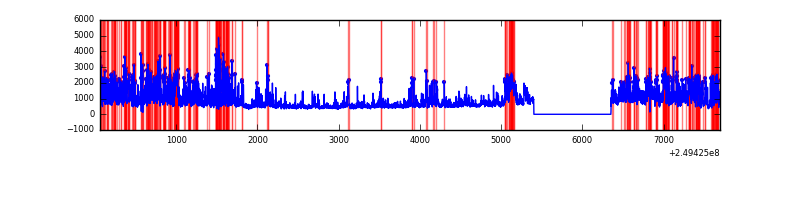 |
| B | 7633 | 6684 | 136 | 136 | 1.78% | 2.03% | 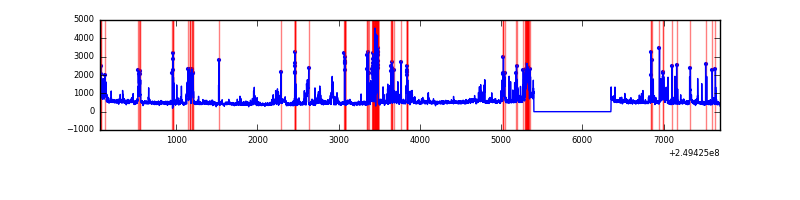 |
| C | 7633 | 6684 | 0 | 0 | 0.00% | 0.00% | 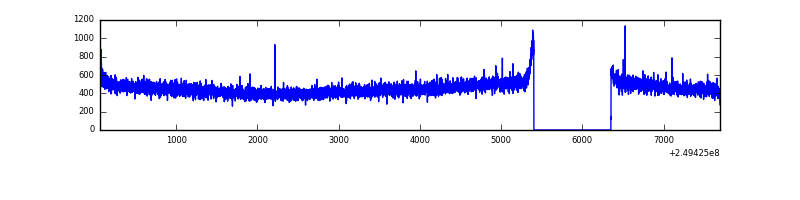 |
| D | 7633 | 6684 | 3922 | 3922 | 51.38% | 58.68% | 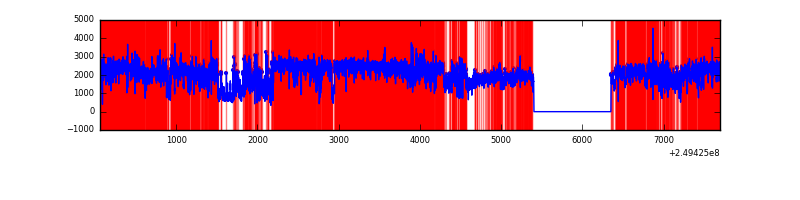 |
Top three noisy pixels from each quadrant. If the there are fewer than three noisy pixels in the level2.evt file, extra rows are filled as -1
| Pixel properties | Quadrant properties | ||||||
|---|---|---|---|---|---|---|---|
| Quadrant | DetID | PixID | Counts | Sigma | Mean | Median | Sigma |
| A | 8 | 5 | 2905985 | 18547.94 | 765 | 748 | 156.6 |
| A | 1 | 162 | 136378 | 865.9 | 765 | 748 | 156.6 |
| A | 15 | 174 | 84697 | 535.96 | 765 | 748 | 156.6 |
| B | 4 | 239 | 567185 | 3777.11 | 778 | 759 | 150.0 |
| B | 3 | 64 | 397219 | 2643.72 | 778 | 759 | 150.0 |
| B | 15 | 204 | 66538 | 438.64 | 778 | 759 | 150.0 |
| C | 13 | 61 | 5625 | 26.94 | 773 | 778 | 179.9 |
| C | 8 | 222 | 3609 | 15.74 | 773 | 778 | 179.9 |
| C | 14 | 234 | 2157 | 7.66 | 773 | 778 | 179.9 |
| D | 13 | 152 | 10397198 | 72867.18 | 588 | 571 | 142.7 |
| D | 13 | 104 | 353369 | 2472.67 | 588 | 571 | 142.7 |
| D | 10 | 157 | 326980 | 2287.71 | 588 | 571 | 142.7 |
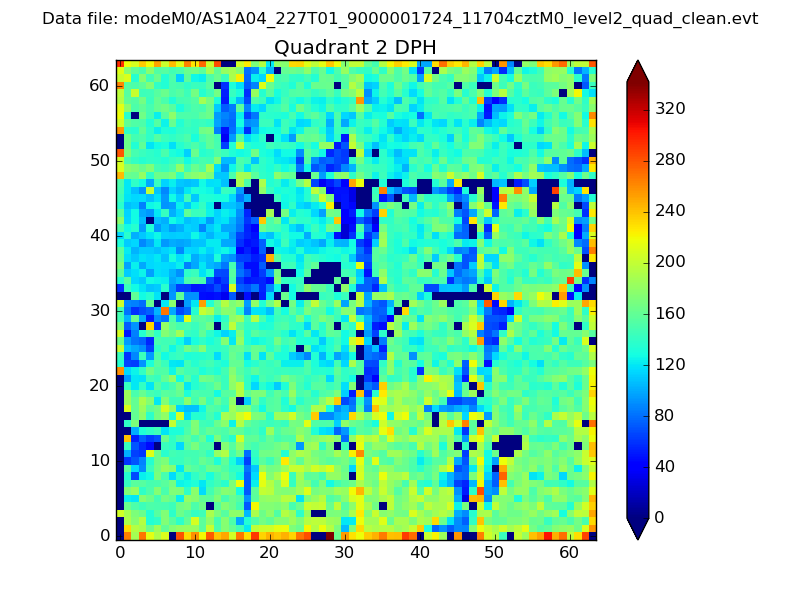
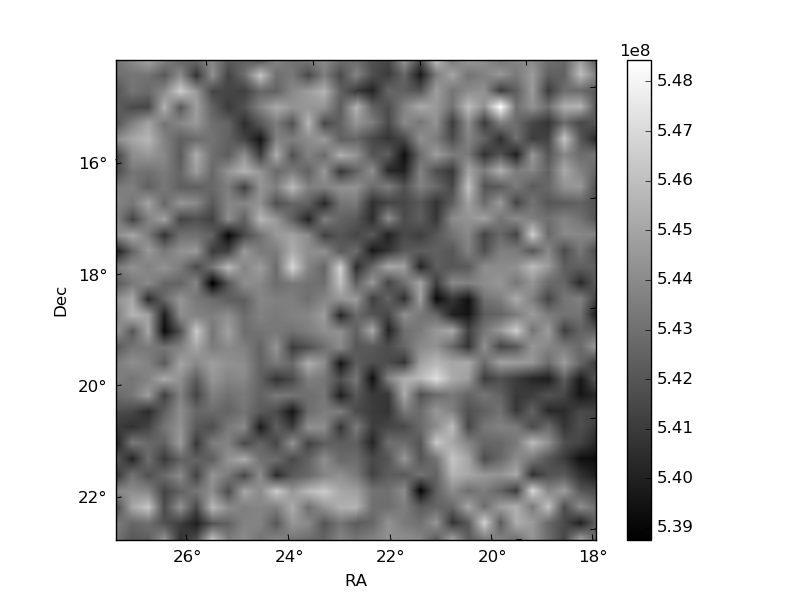
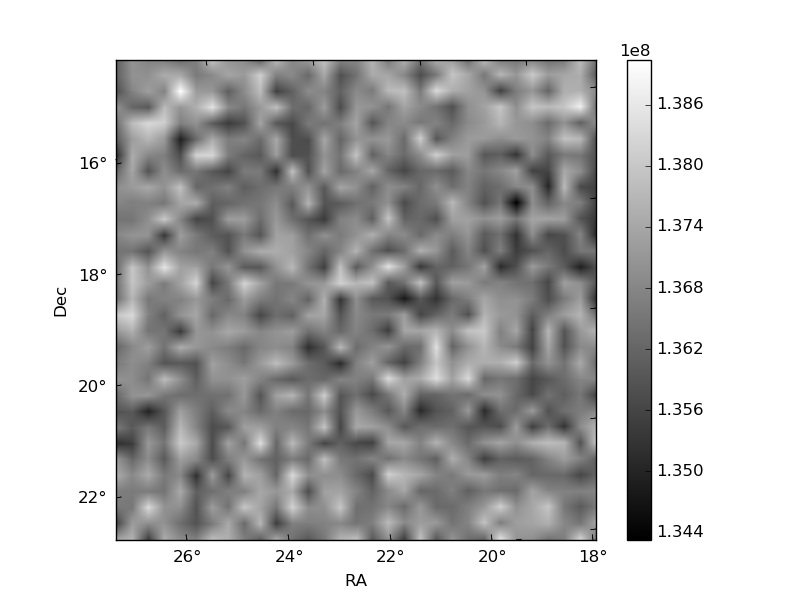
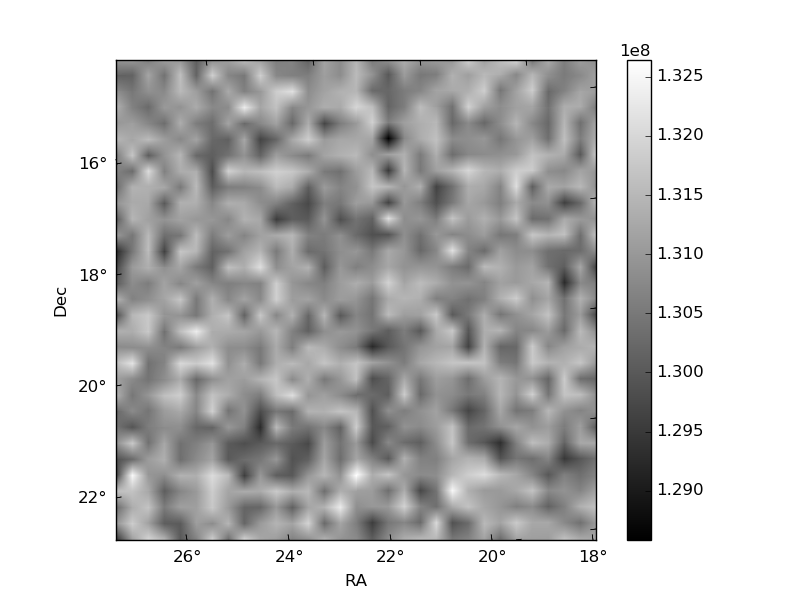
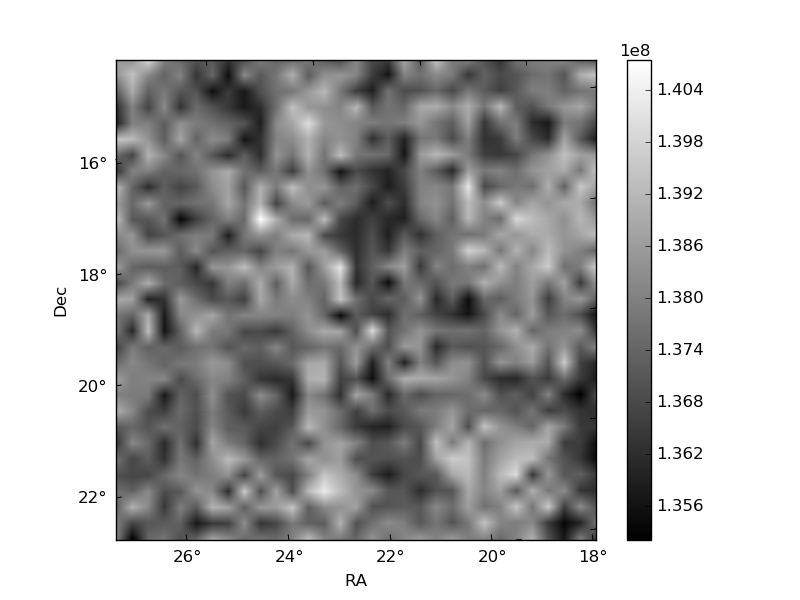
Histogram calculated using DETX and DETY for each event in the final _common_clean file
| Quadrant A | 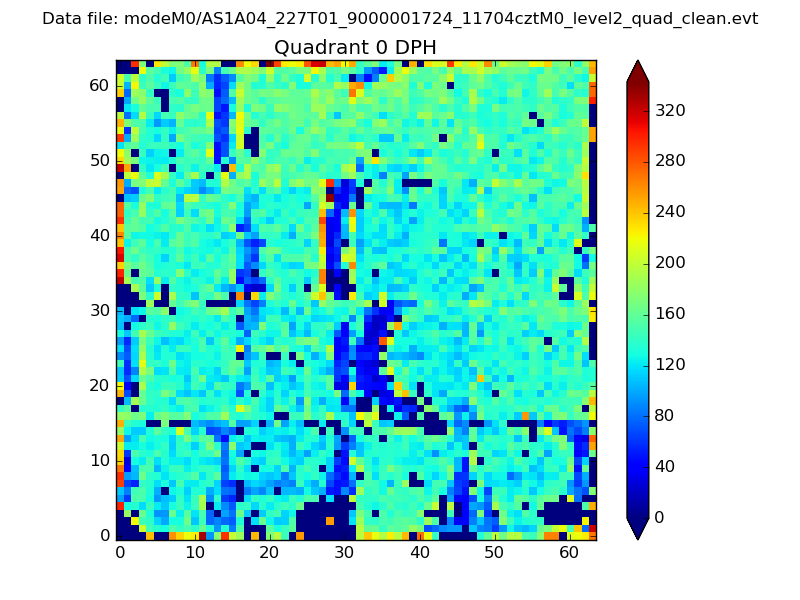 |
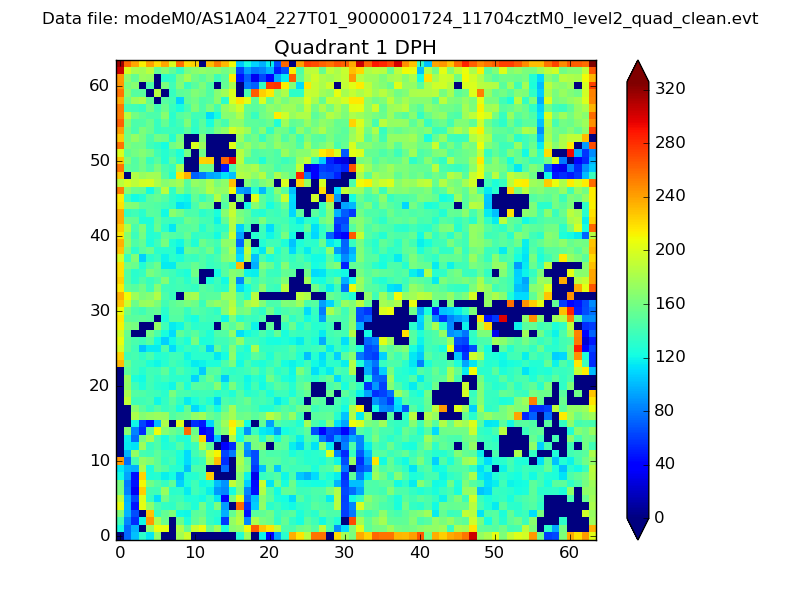 |
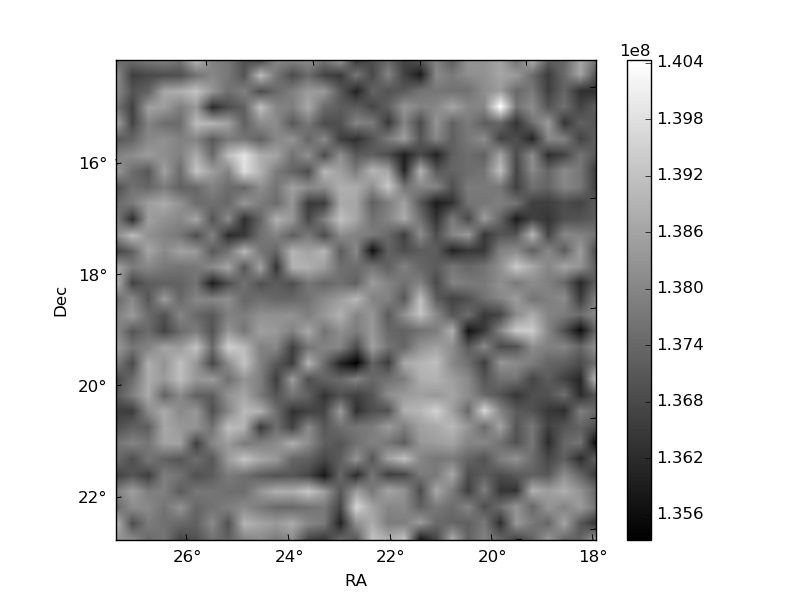
Quadrant B |
|---|---|---|---|
| Quadrant D | 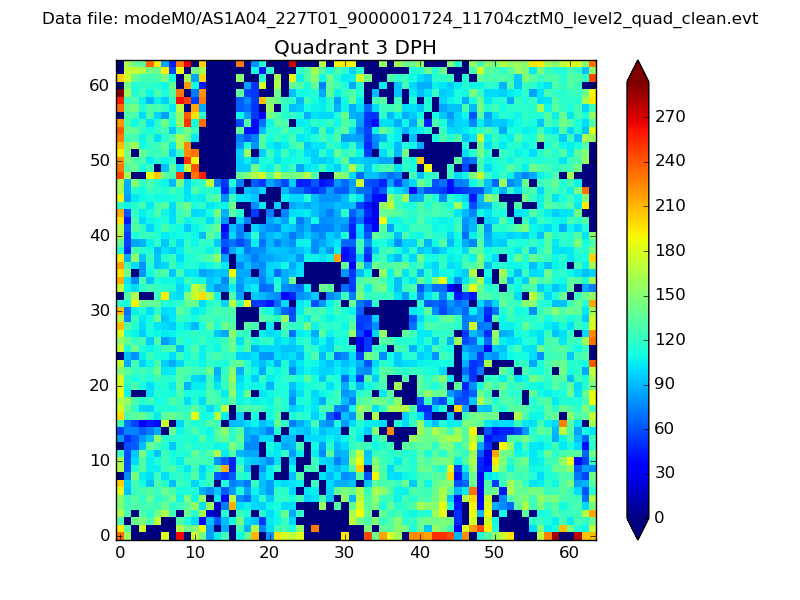 |
 |
Quadrant C |
| Plot type | Count rate plots | Images |
|---|---|---|
| Comparison with Poisson distribution Blue bars denote a histogram of data divided into 1 sec bins. Red curve is a Poisson curve with rate = median count rate of data. |
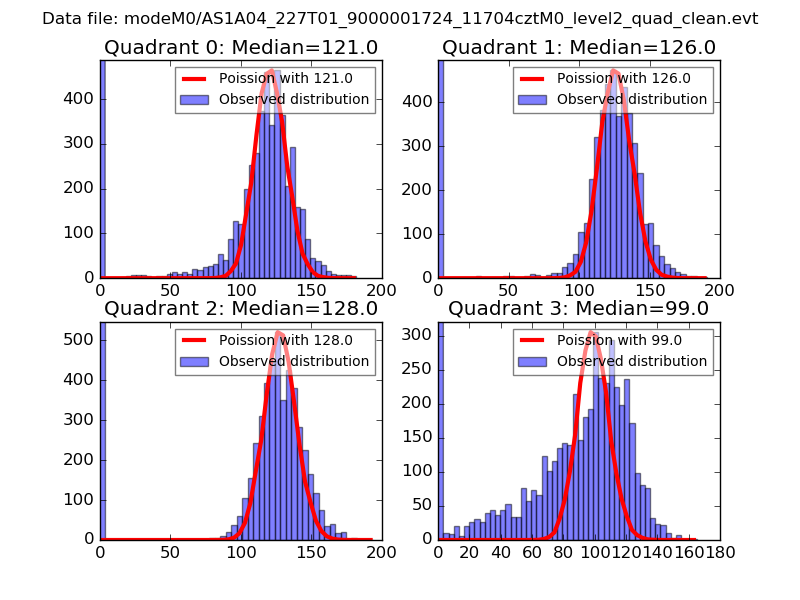 |
 |
| Quadrant-wise count rates Data is divided into 100 sec bins |
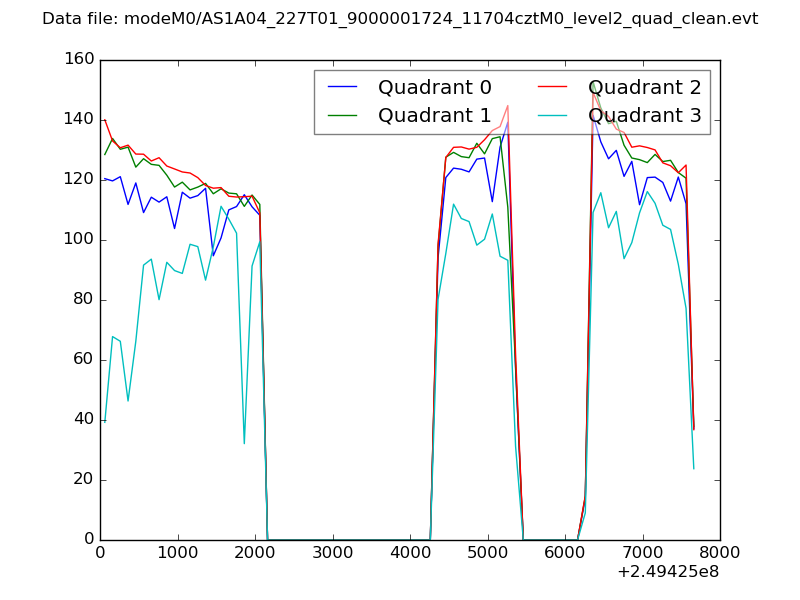 |
|
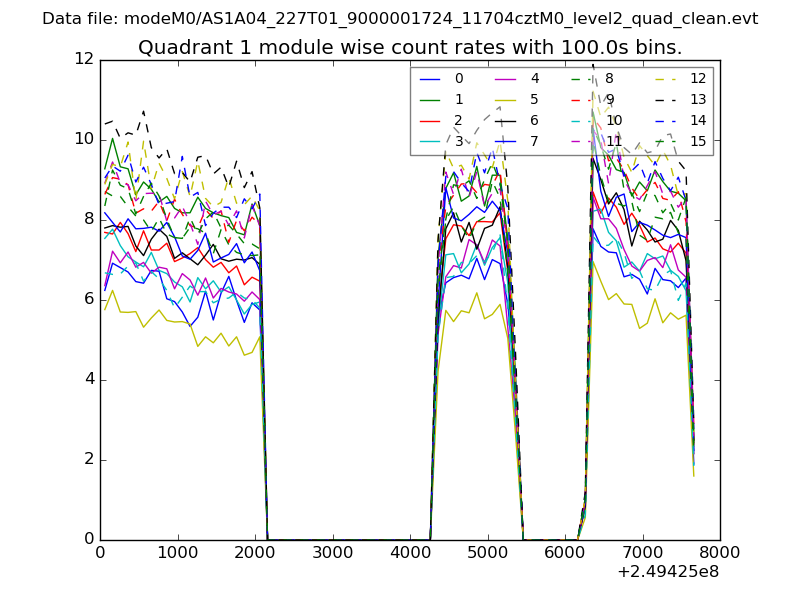
| Module-wise count rates for Quadrant A Data is divided into 100 sec bins |
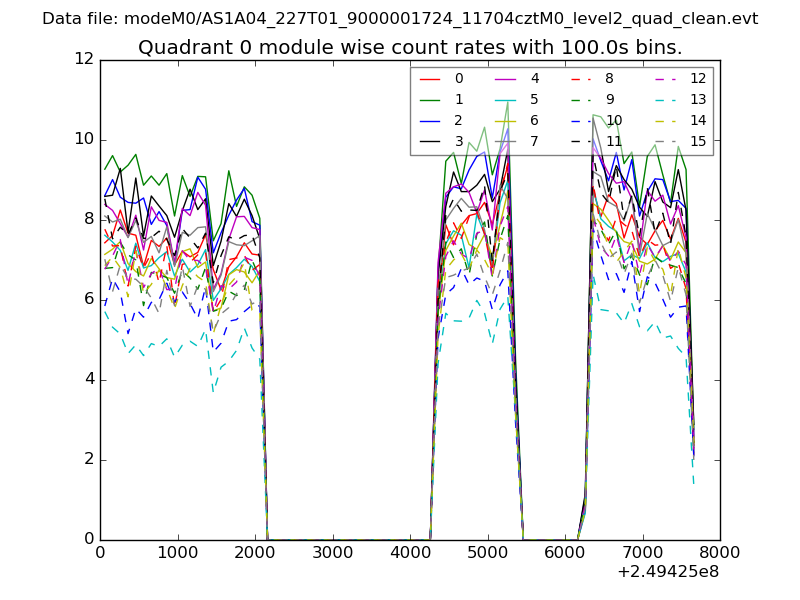 |
 |
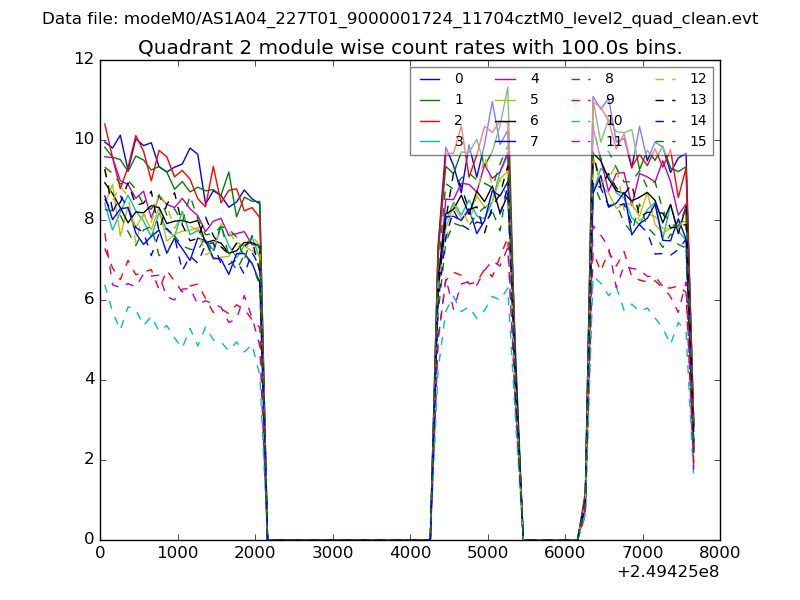
| Module-wise count rates for Quadrant B Data is divided into 100 sec bins |
 |
 |
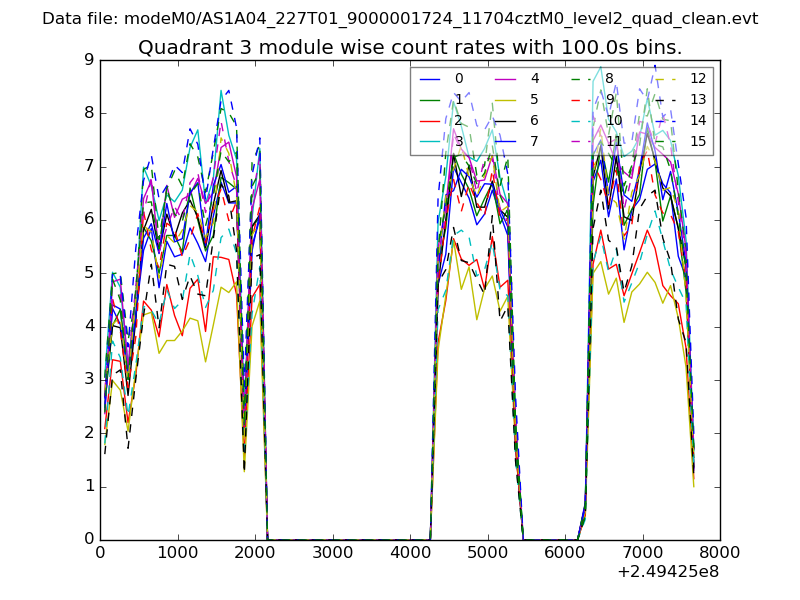
| Module-wise count rates for Quadrant C Data is divided into 100 sec bins |
 |
 |
| Module-wise count rates for Quadrant D Data is divided into 100 sec bins |
 |
 |
| Parameter | Plot |
|---|---|
| CZT HV Monitor | 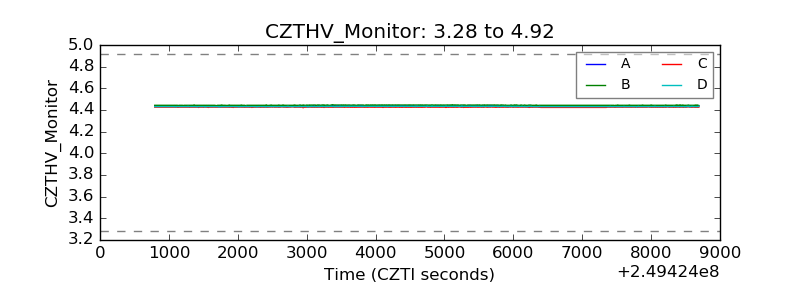 |
| D_VDD | 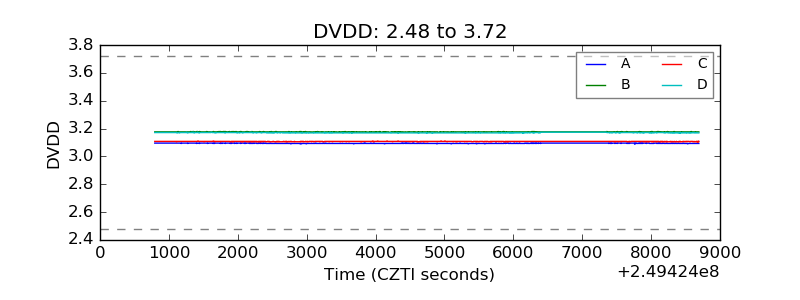 |
| Temperature 1 | 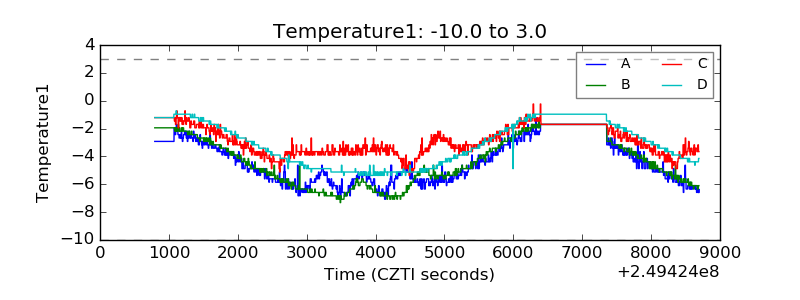 |
| Veto HV Monitor | 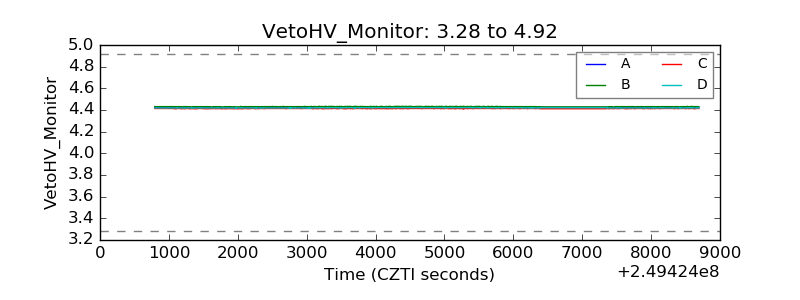 |
| Veto LLD | 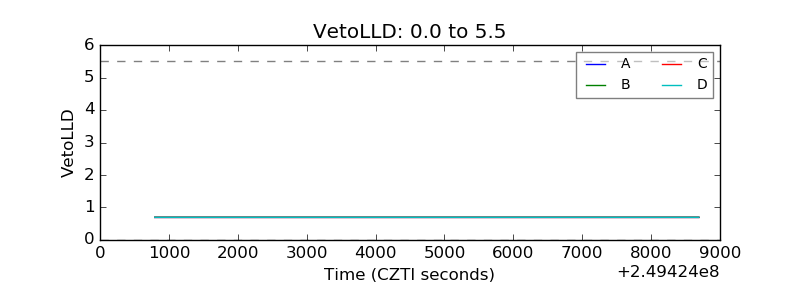 |
| Alpha Counter | 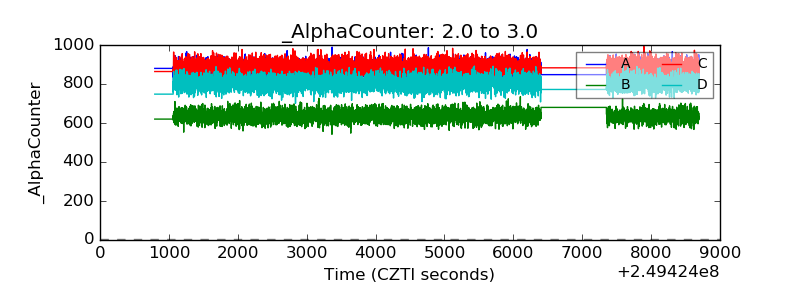 |
| _CPM_Rate | 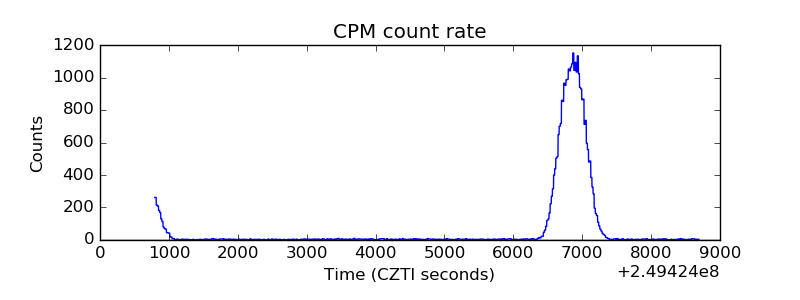 |
| CZT Counter | 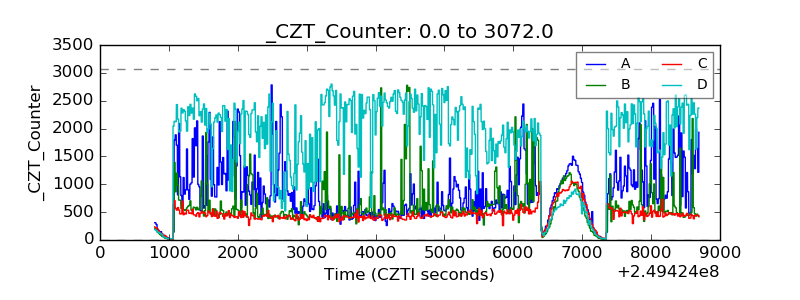 |
| +2.5 Volts monitor |  |
| +5 Volts monitor | 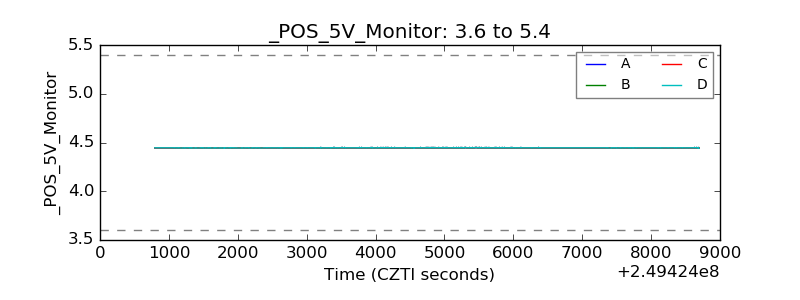 |
| _ROLL_ROT | 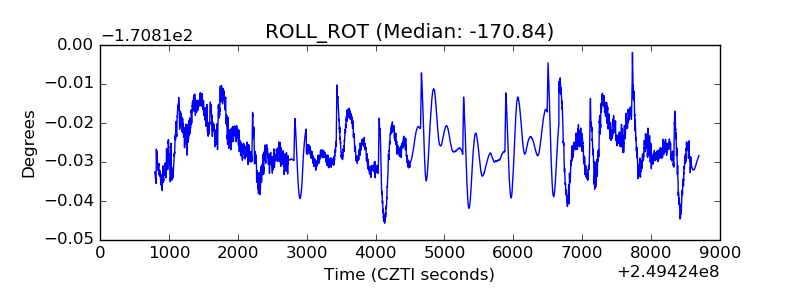 |
| _Roll_DEC | 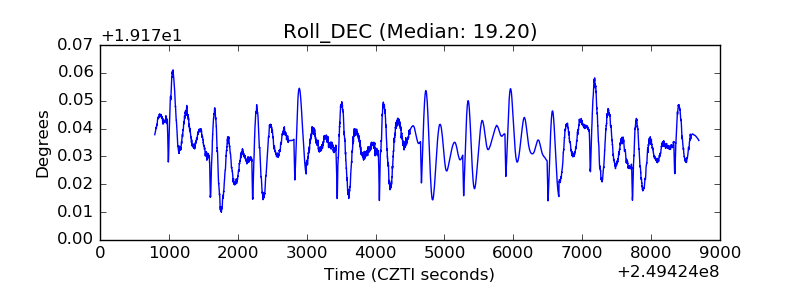 |
| _Roll_RA | 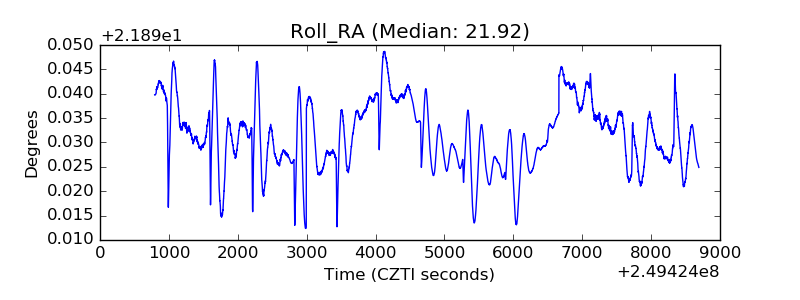 |
| Veto Counter | 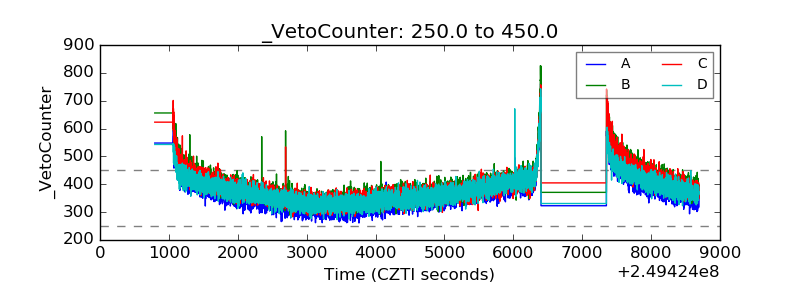 |