| Param | Original file | Final file |
|---|---|---|
| Filename | modeM0/AS1A04_227T01_9000001724_11706cztM0_level2.evt | modeM0/AS1A04_227T01_9000001724_11706cztM0_level2_quad_clean.evt |
| Size (bytes) | 830,543,040 | 85,826,880 |
| Size | 792.1 MB | 81.9 MB |
| Events in quadrant A | 6,715,203 | 548,952 |
| Events in quadrant B | 4,309,024 | 569,958 |
| Events in quadrant C | 3,064,102 | 579,890 |
| Events in quadrant D | 10,618,638 | 437,727 |
| Mode M0 | |||
|---|---|---|---|
| Quadrant | BADHDUFLAG | Total packets | Discarded packets |
| A | 0 | 24602 | 3 |
| B | 0 | 17112 | 2 |
| C | 0 | 13502 | 2 |
| D | 0 | 36113 | 2 |
| Mode SS | |||
|---|---|---|---|
| Quadrant | BADHDUFLAG | Total packets | Discarded packets |
| A | 0 | 138 | 0 |
| B | 0 | 138 | 0 |
| C | 0 | 138 | 0 |
| D | 0 | 138 | 0 |
| Mode M9 | |||
|---|---|---|---|
| Quadrant | BADHDUFLAG | Total packets | Discarded packets |
| A | 0 | 20 | 0 |
| B | 0 | 20 | 0 |
| C | 0 | 20 | 0 |
| D | 0 | 20 | 0 |
| Quadrant | Total seconds | Saturated seconds | Saturation percentage |
|---|---|---|---|
| A | 6609 | 703 | 10.637010% |
| B | 6609 | 305 | 4.614919% |
| C | 6609 | 28 | 0.423665% |
| D | 6609 | 2686 | 40.641549% |
Noise dominated data is calculated using 1-second bins in cleaned event files. If a bin has >2000 counts, and if more than 50% of those come from <1% of pixels, then it is considered to be noise-dominated and hence unusable.
| Quadrant | # 1 sec bins | Bins with >0 counts | Bins with >2000 counts | High rate bins dominated by noise | Noise dominated (total time) | Noise dominated (detector-on time) | Marked lightcurve |
|---|---|---|---|---|---|---|---|
| A | 8660 | 6612 | 526 | 526 | 6.07% | 7.96% | 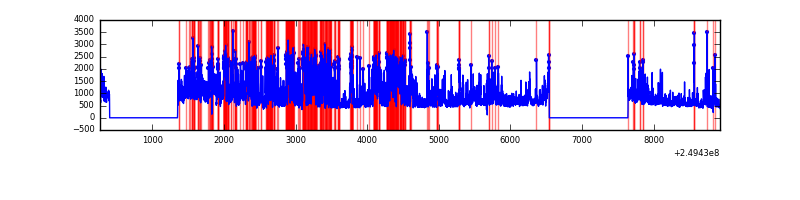 |
| B | 8660 | 6612 | 137 | 137 | 1.58% | 2.07% | 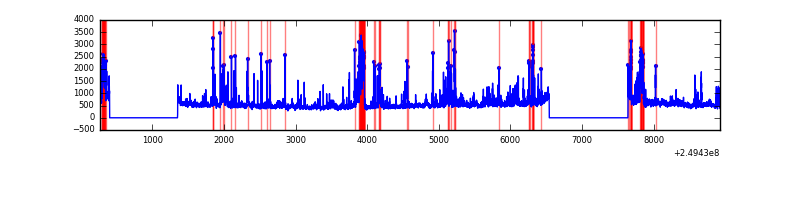 |
| C | 8660 | 6612 | 0 | 0 | 0.00% | 0.00% | 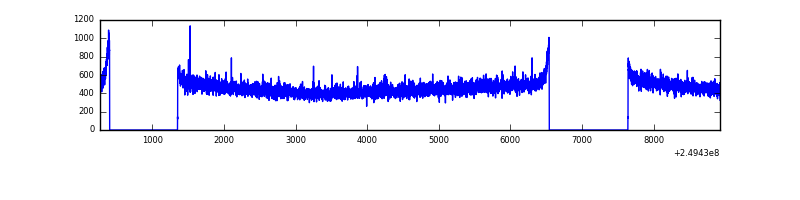 |
| D | 8660 | 6612 | 2528 | 2528 | 29.19% | 38.23% | 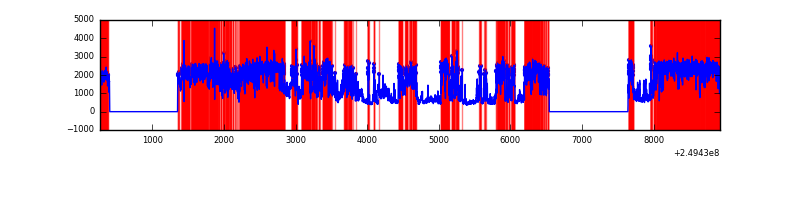 |
Top three noisy pixels from each quadrant. If the there are fewer than three noisy pixels in the level2.evt file, extra rows are filled as -1
| Pixel properties | Quadrant properties | ||||||
|---|---|---|---|---|---|---|---|
| Quadrant | DetID | PixID | Counts | Sigma | Mean | Median | Sigma |
| A | 8 | 5 | 3145084 | 19934.96 | 778 | 761 | 157.7 |
| A | 1 | 162 | 162677 | 1026.55 | 778 | 761 | 157.7 |
| A | 1 | 178 | 89262 | 561.1 | 778 | 761 | 157.7 |
| B | 4 | 239 | 533536 | 3522.35 | 791 | 772 | 151.3 |
| B | 3 | 64 | 289888 | 1911.48 | 791 | 772 | 151.3 |
| B | 0 | 85 | 117058 | 768.82 | 791 | 772 | 151.3 |
| C | 13 | 61 | 5738 | 27.13 | 785 | 790 | 182.3 |
| C | 8 | 222 | 2989 | 12.06 | 785 | 790 | 182.3 |
| C | 3 | 202 | 1846 | 5.79 | 785 | 790 | 182.3 |
| D | 13 | 152 | 7462744 | 45524.05 | 678 | 661 | 163.9 |
| D | 10 | 157 | 229745 | 1397.58 | 678 | 661 | 163.9 |
| D | 13 | 104 | 102646 | 622.18 | 678 | 661 | 163.9 |
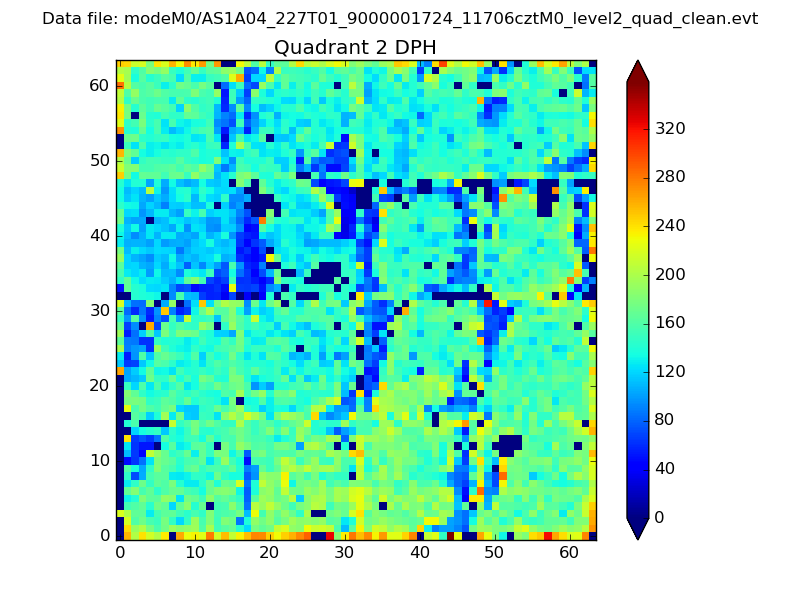
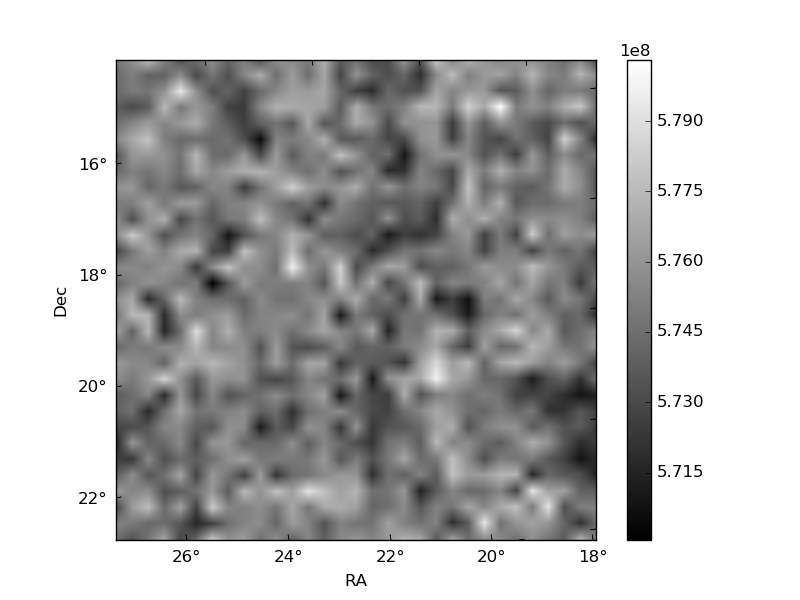
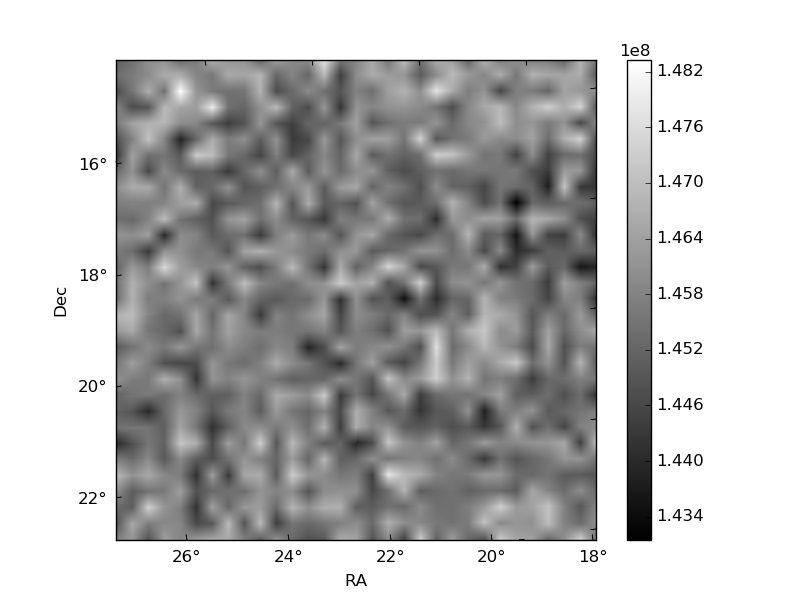
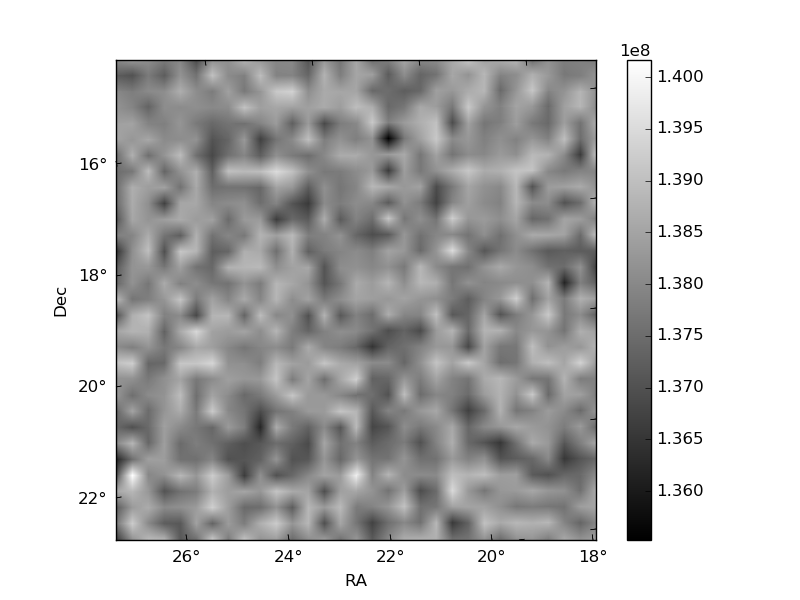
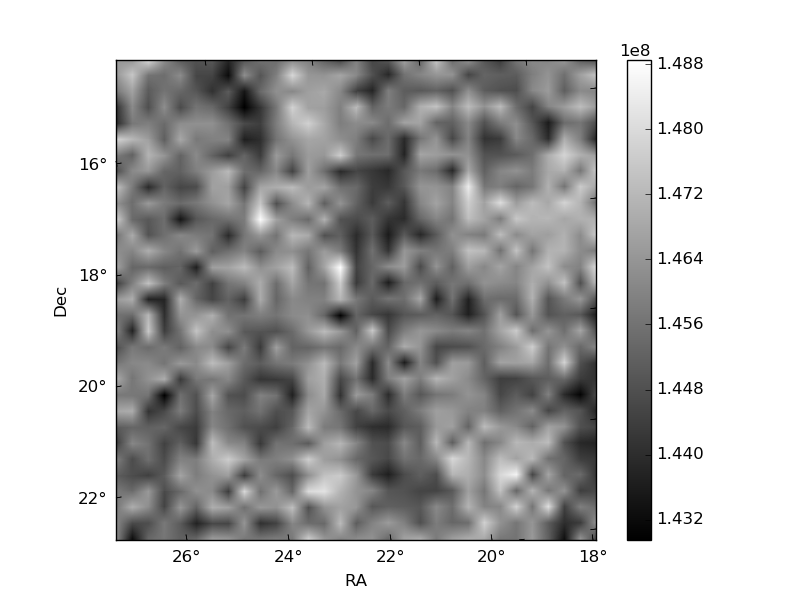
Histogram calculated using DETX and DETY for each event in the final _common_clean file
| Quadrant A | 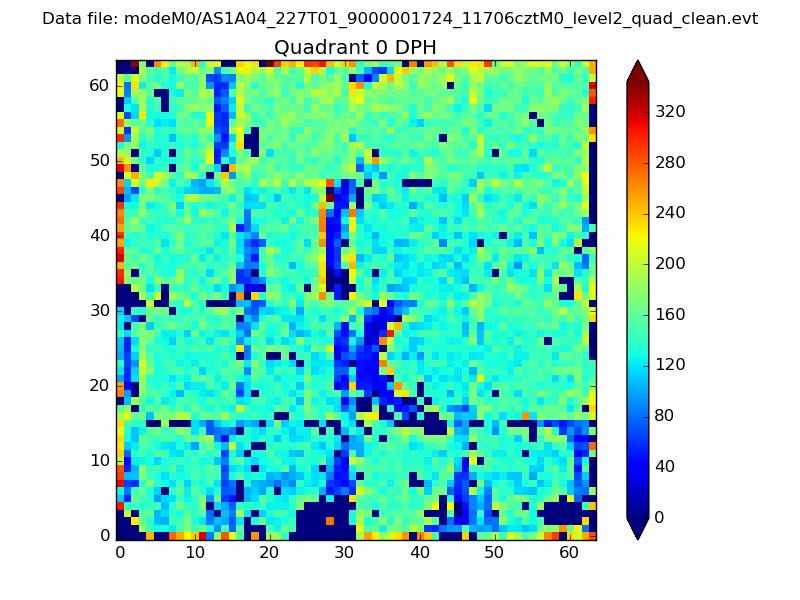 |
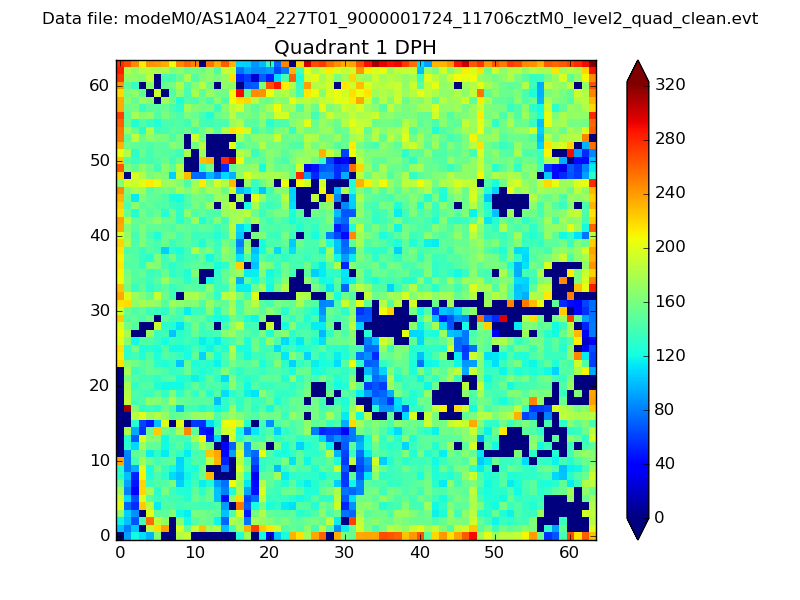 |
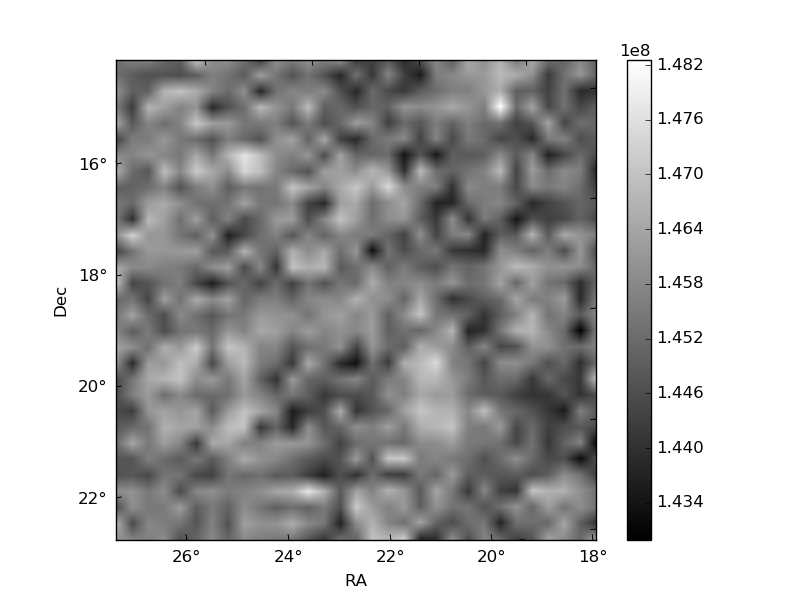
Quadrant B |
|---|---|---|---|
| Quadrant D | 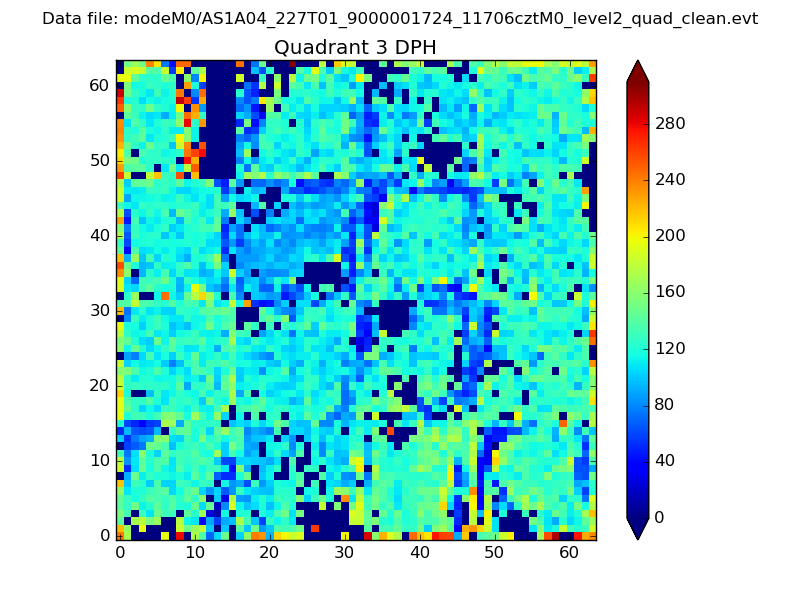 |
 |
Quadrant C |
| Plot type | Count rate plots | Images |
|---|---|---|
| Comparison with Poisson distribution Blue bars denote a histogram of data divided into 1 sec bins. Red curve is a Poisson curve with rate = median count rate of data. |
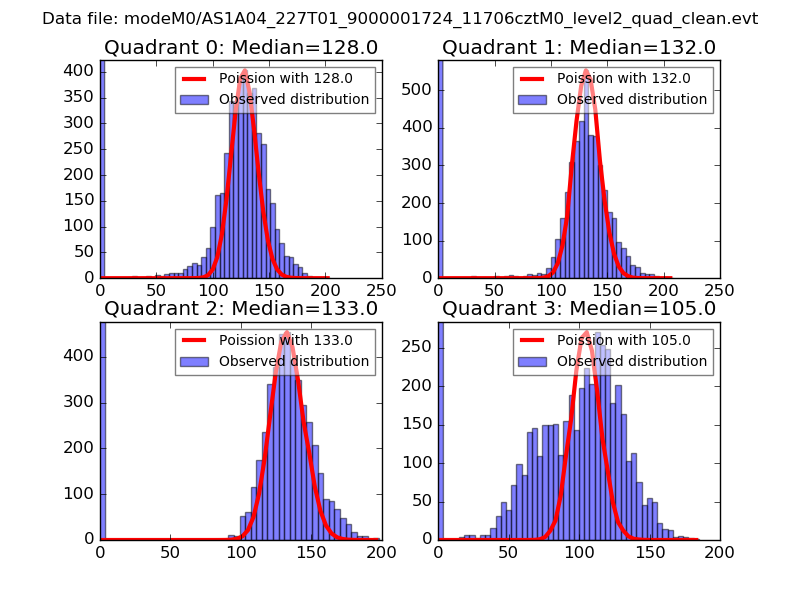 |
 |
| Quadrant-wise count rates Data is divided into 100 sec bins |
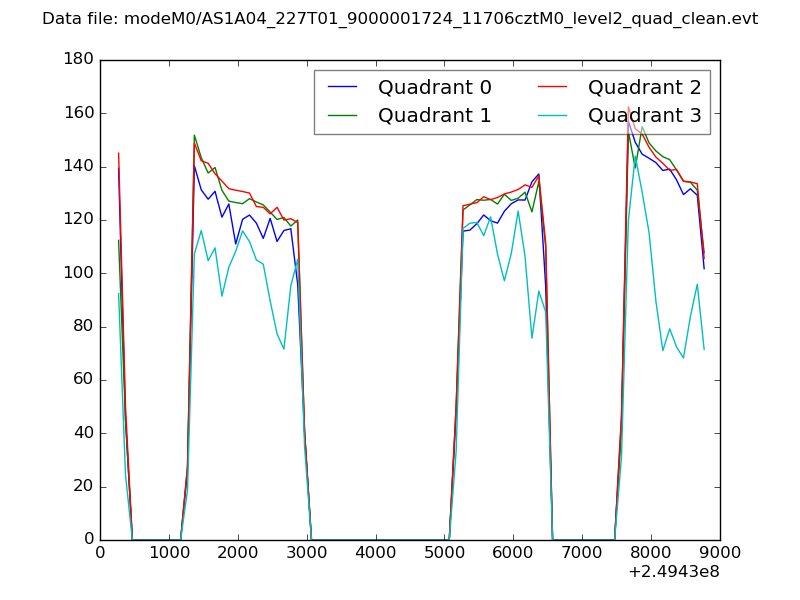 |
|
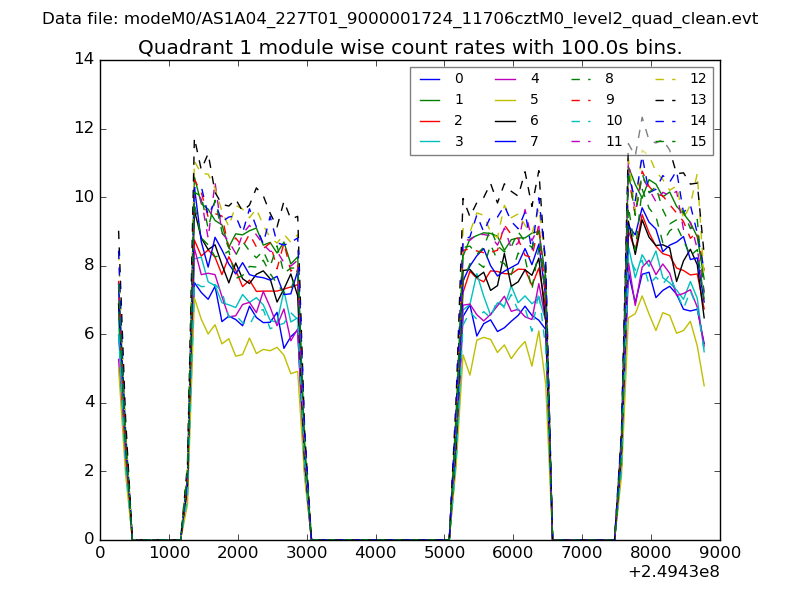
| Module-wise count rates for Quadrant A Data is divided into 100 sec bins |
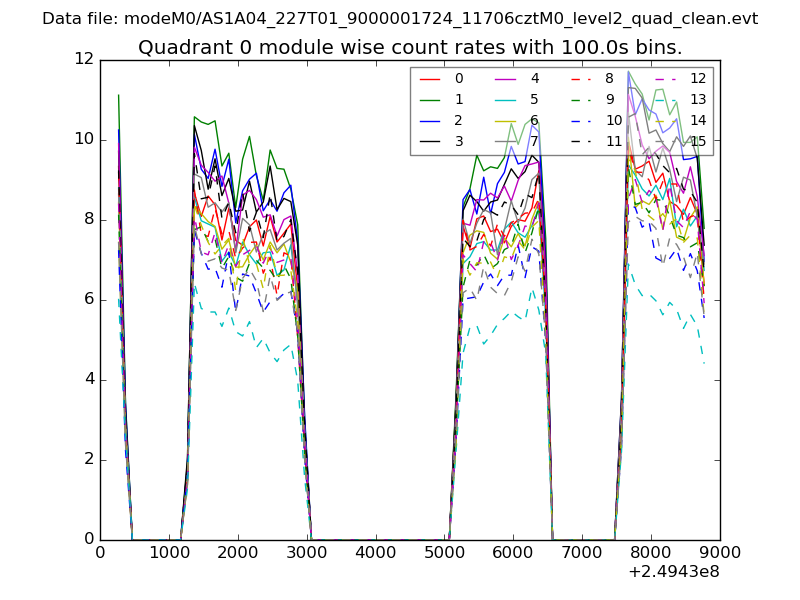 |
 |
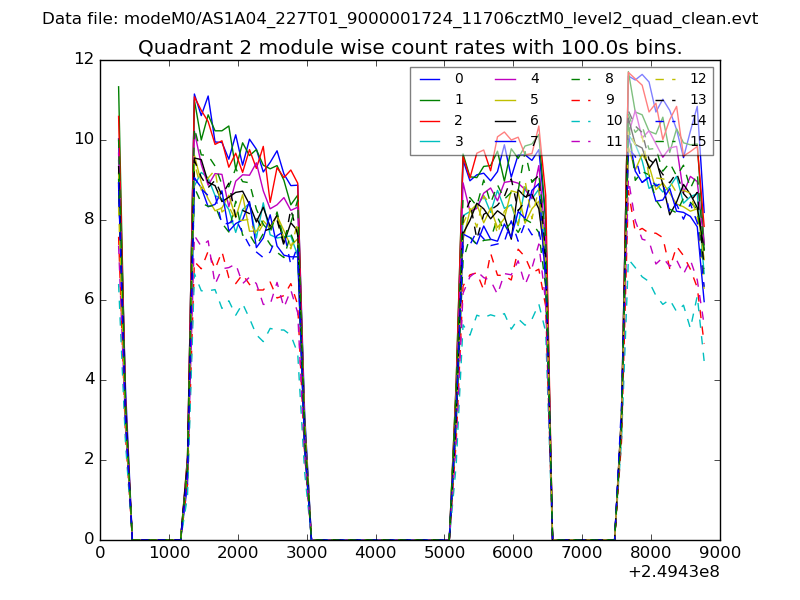
| Module-wise count rates for Quadrant B Data is divided into 100 sec bins |
 |
 |
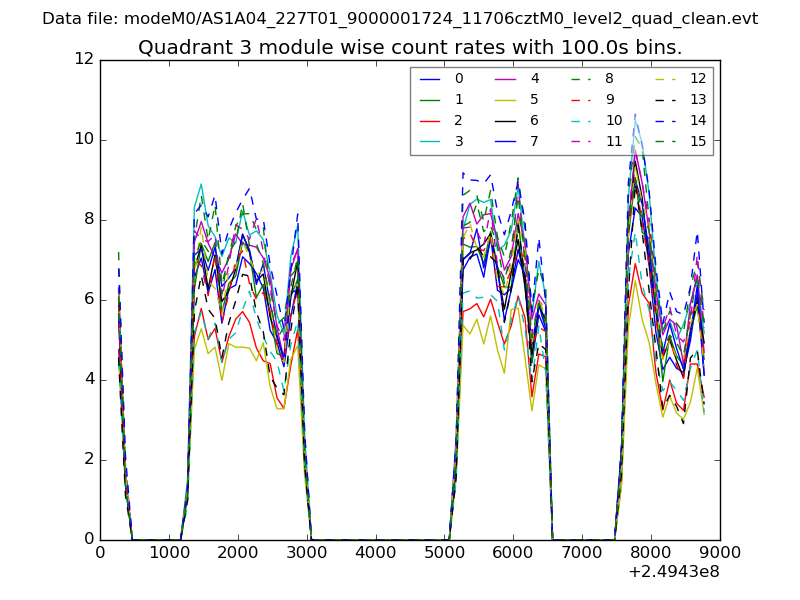
| Module-wise count rates for Quadrant C Data is divided into 100 sec bins |
 |
 |
| Module-wise count rates for Quadrant D Data is divided into 100 sec bins |
 |
 |
| Parameter | Plot |
|---|---|
| CZT HV Monitor | 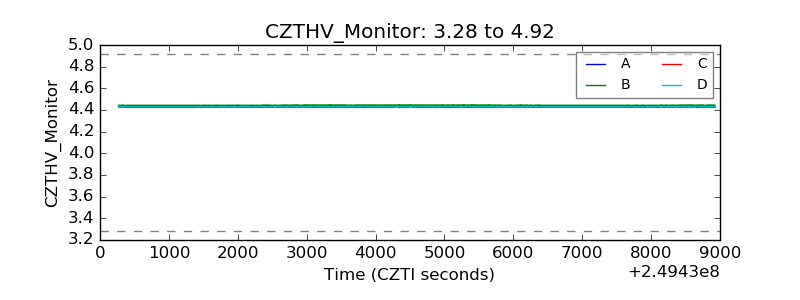 |
| D_VDD | 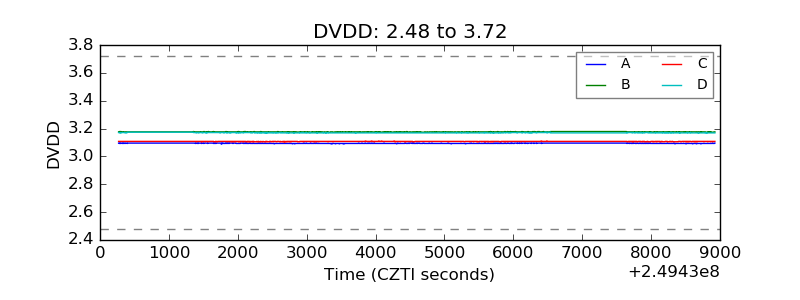 |
| Temperature 1 | 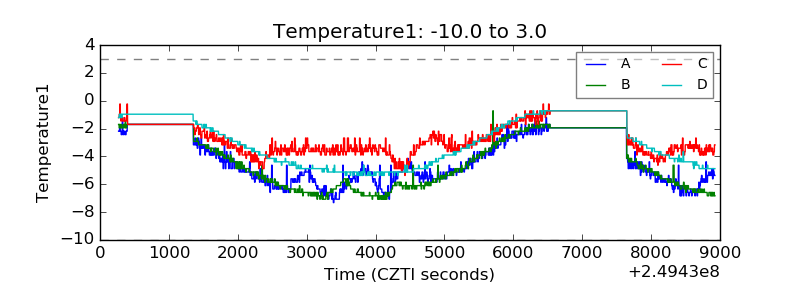 |
| Veto HV Monitor | 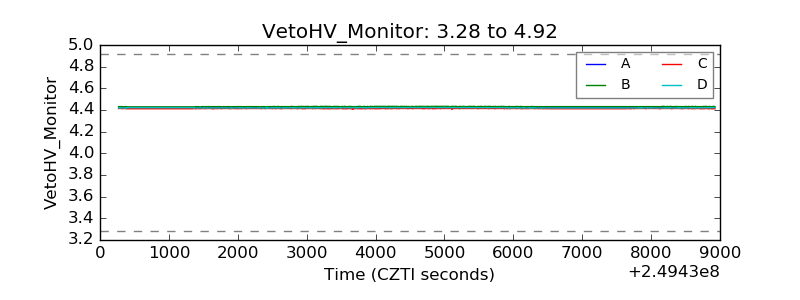 |
| Veto LLD | 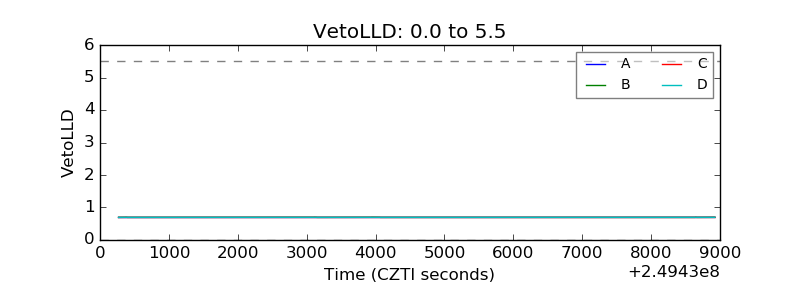 |
| Alpha Counter | 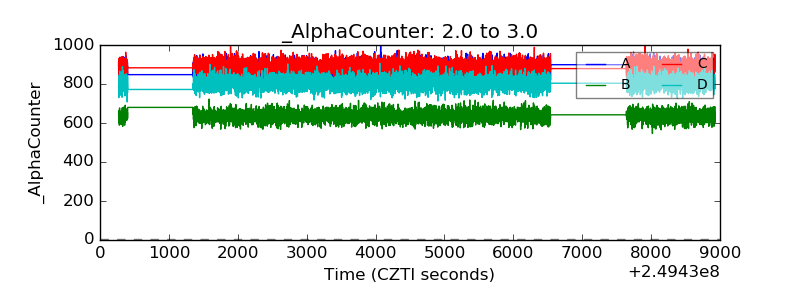 |
| _CPM_Rate | 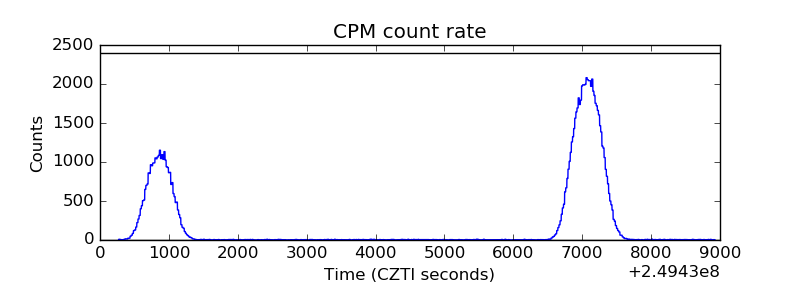 |
| CZT Counter | 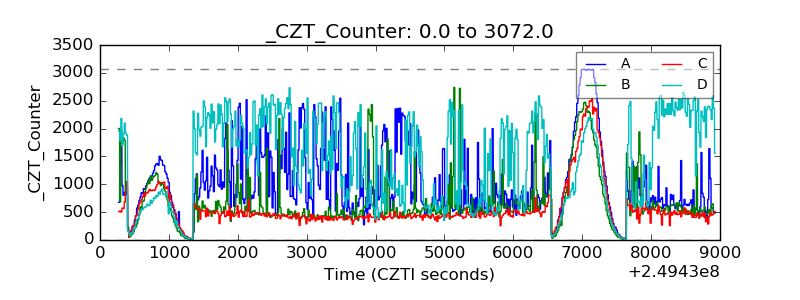 |
| +2.5 Volts monitor |  |
| +5 Volts monitor |  |
| _ROLL_ROT | 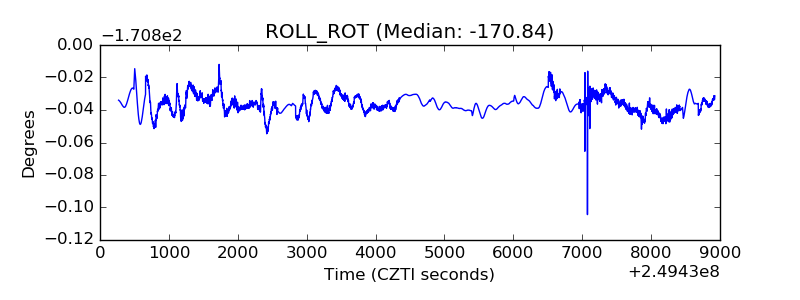 |
| _Roll_DEC | 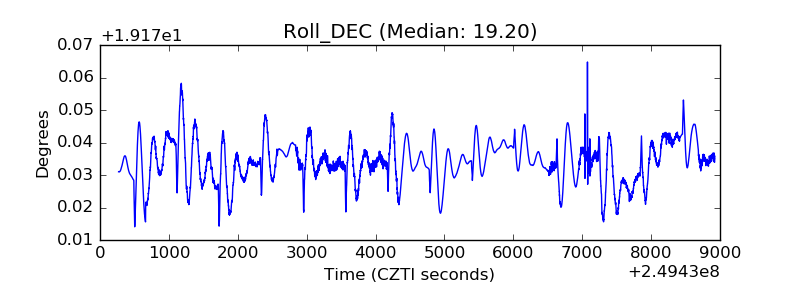 |
| _Roll_RA | 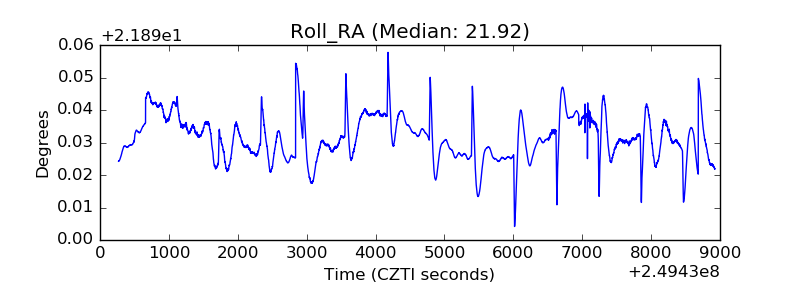 |
| Veto Counter | 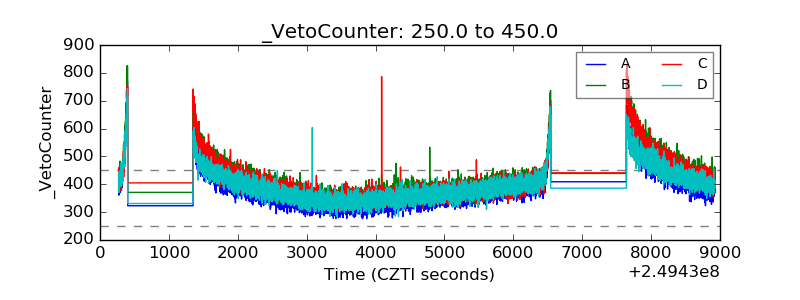 |