| Param | Original file | Final file |
|---|---|---|
| Filename | modeM0/AS1A04_227T01_9000001724_11707cztM0_level2.evt | modeM0/AS1A04_227T01_9000001724_11707cztM0_level2_quad_clean.evt |
| Size (bytes) | 644,863,680 | 78,644,160 |
| Size | 615.0 MB | 75.0 MB |
| Events in quadrant A | 4,386,976 | 491,938 |
| Events in quadrant B | 4,217,248 | 507,587 |
| Events in quadrant C | 2,993,914 | 509,591 |
| Events in quadrant D | 7,502,349 | 428,604 |
| Mode M0 | |||
|---|---|---|---|
| Quadrant | BADHDUFLAG | Total packets | Discarded packets |
| A | 0 | 17283 | 3 |
| B | 0 | 16725 | 2 |
| C | 0 | 12973 | 2 |
| D | 0 | 26543 | 2 |
| Mode SS | |||
|---|---|---|---|
| Quadrant | BADHDUFLAG | Total packets | Discarded packets |
| A | 0 | 128 | 0 |
| B | 0 | 128 | 0 |
| C | 0 | 128 | 0 |
| D | 0 | 128 | 0 |
| Mode M9 | |||
|---|---|---|---|
| Quadrant | BADHDUFLAG | Total packets | Discarded packets |
| A | 0 | 15 | 0 |
| B | 0 | 15 | 0 |
| C | 0 | 15 | 0 |
| D | 0 | 16 | 0 |
| Quadrant | Total seconds | Saturated seconds | Saturation percentage |
|---|---|---|---|
| A | 6351 | 170 | 2.676744% |
| B | 6351 | 184 | 2.897182% |
| C | 6351 | 5 | 0.078728% |
| D | 6351 | 1226 | 19.304047% |
Noise dominated data is calculated using 1-second bins in cleaned event files. If a bin has >2000 counts, and if more than 50% of those come from <1% of pixels, then it is considered to be noise-dominated and hence unusable.
| Quadrant | # 1 sec bins | Bins with >0 counts | Bins with >2000 counts | High rate bins dominated by noise | Noise dominated (total time) | Noise dominated (detector-on time) | Marked lightcurve |
|---|---|---|---|---|---|---|---|
| A | 7587 | 6353 | 86 | 86 | 1.13% | 1.35% | 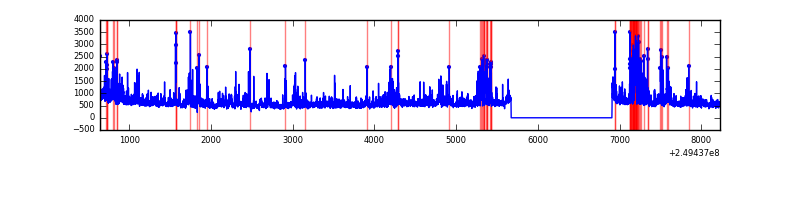 |
| B | 7587 | 6353 | 107 | 107 | 1.41% | 1.68% | 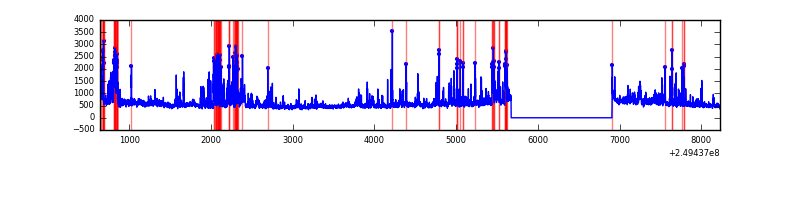 |
| C | 7587 | 6353 | 0 | 0 | 0.00% | 0.00% | 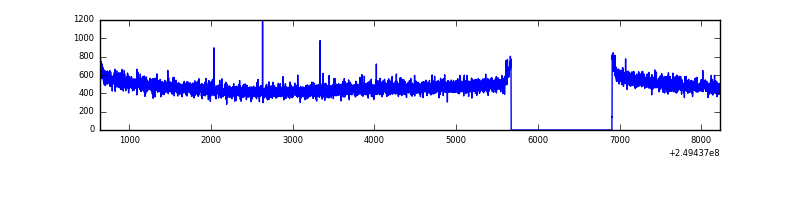 |
| D | 7587 | 6353 | 1253 | 1253 | 16.52% | 19.72% | 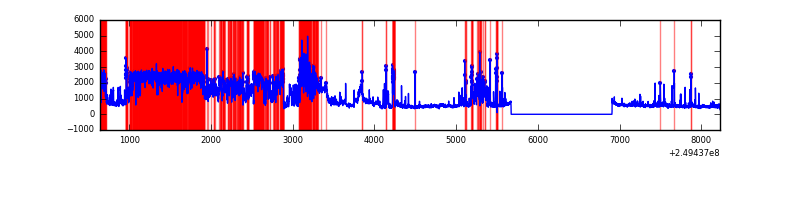 |
Top three noisy pixels from each quadrant. If the there are fewer than three noisy pixels in the level2.evt file, extra rows are filled as -1
| Pixel properties | Quadrant properties | ||||||
|---|---|---|---|---|---|---|---|
| Quadrant | DetID | PixID | Counts | Sigma | Mean | Median | Sigma |
| A | 8 | 5 | 797988 | 5085.67 | 775 | 760 | 156.8 |
| A | 14 | 63 | 166041 | 1054.36 | 775 | 760 | 156.8 |
| A | 1 | 162 | 141061 | 895.01 | 775 | 760 | 156.8 |
| B | 4 | 239 | 425422 | 2878.46 | 782 | 765 | 147.5 |
| B | 10 | 245 | 369869 | 2501.9 | 782 | 765 | 147.5 |
| B | 3 | 64 | 148919 | 1004.23 | 782 | 765 | 147.5 |
| C | 13 | 61 | 5583 | 27.15 | 767 | 773 | 177.2 |
| C | 8 | 222 | 2468 | 9.57 | 767 | 773 | 177.2 |
| C | 12 | 4 | 2024 | 7.06 | 767 | 773 | 177.2 |
| D | 13 | 152 | 4048250 | 23899.65 | 703 | 684 | 169.4 |
| D | 10 | 119 | 299160 | 1762.41 | 703 | 684 | 169.4 |
| D | 7 | 80 | 139985 | 822.53 | 703 | 684 | 169.4 |
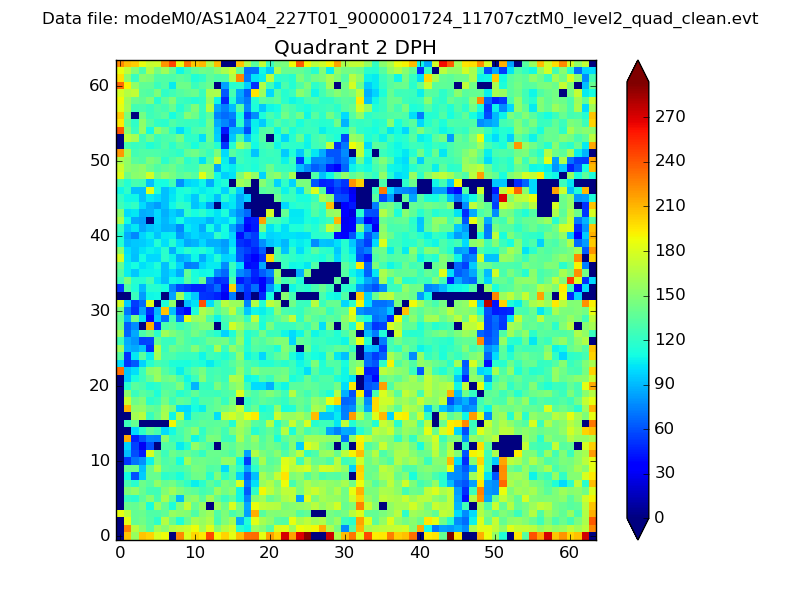
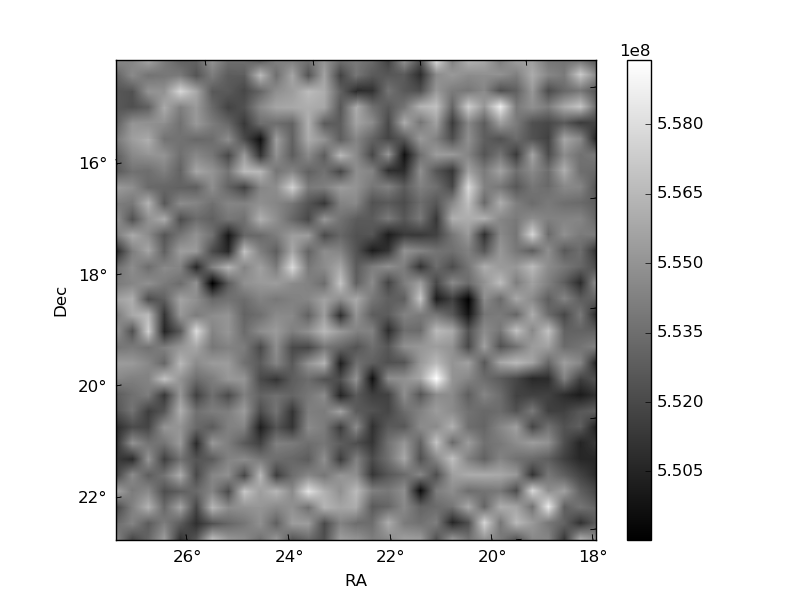
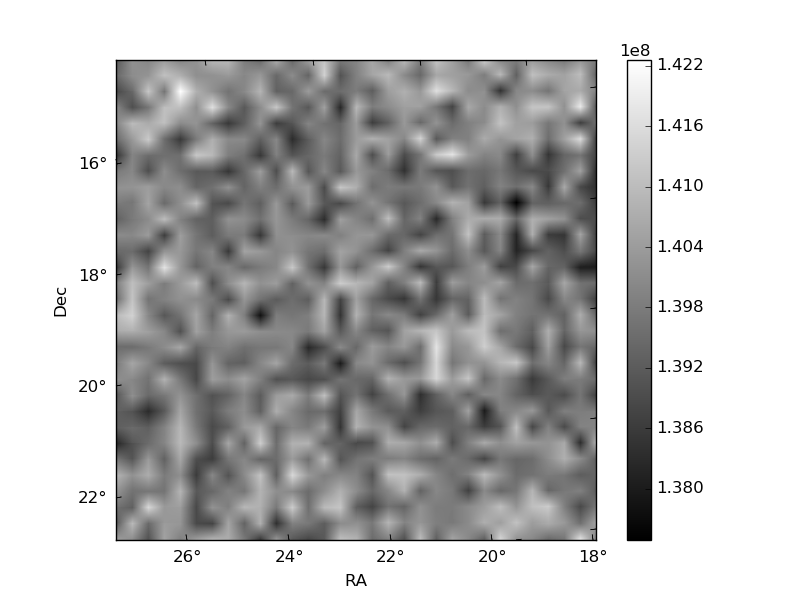
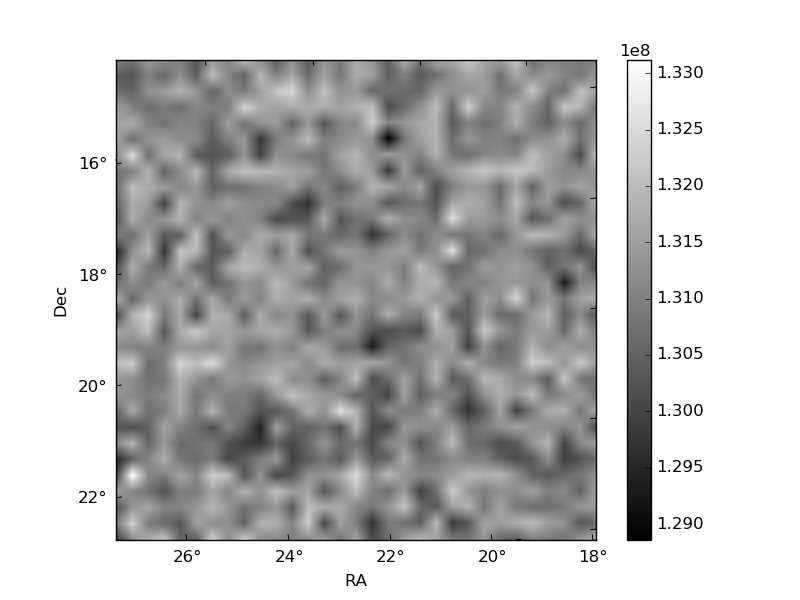
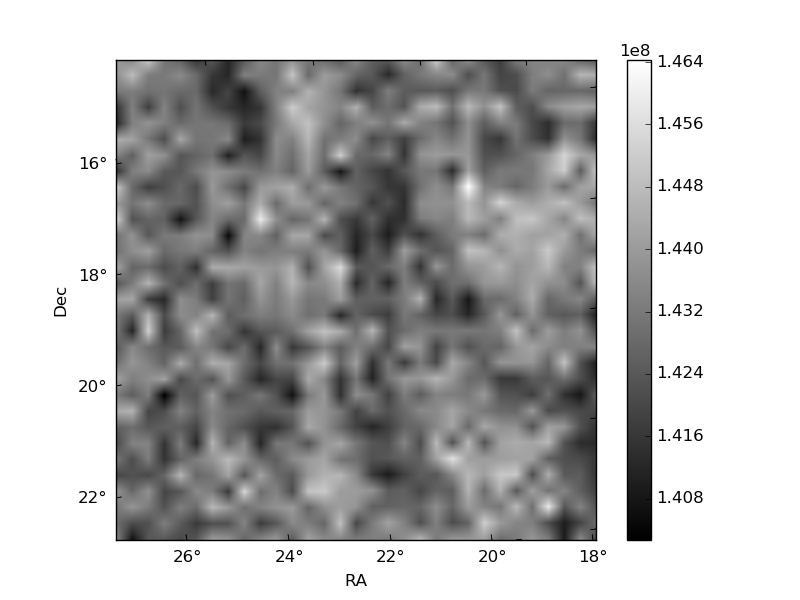
Histogram calculated using DETX and DETY for each event in the final _common_clean file
| Quadrant A | 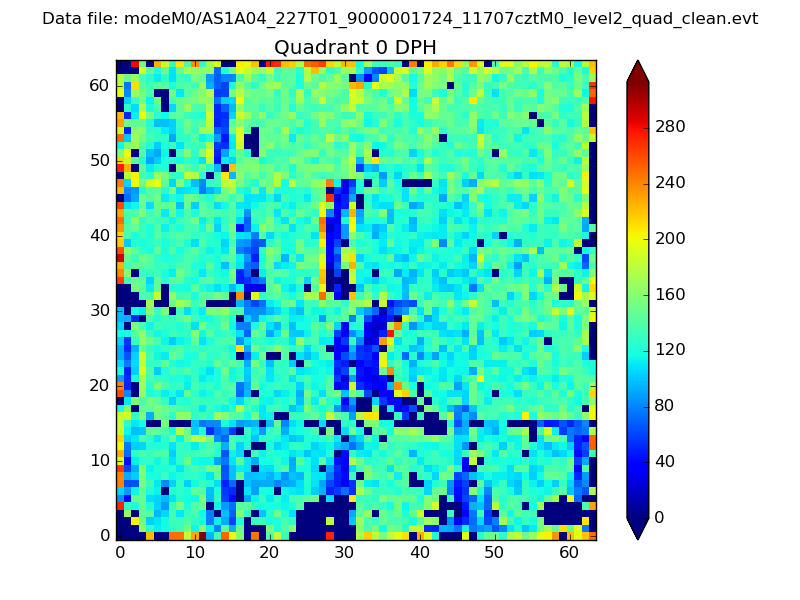 |
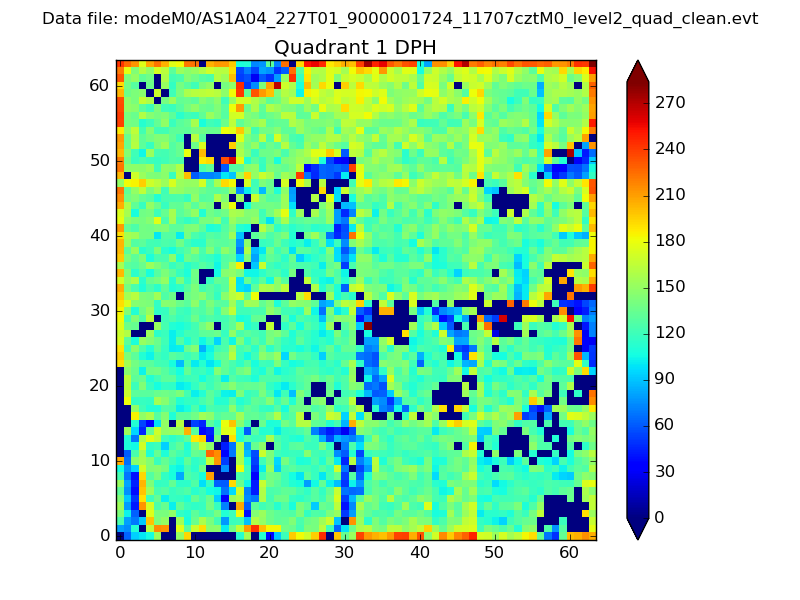 |
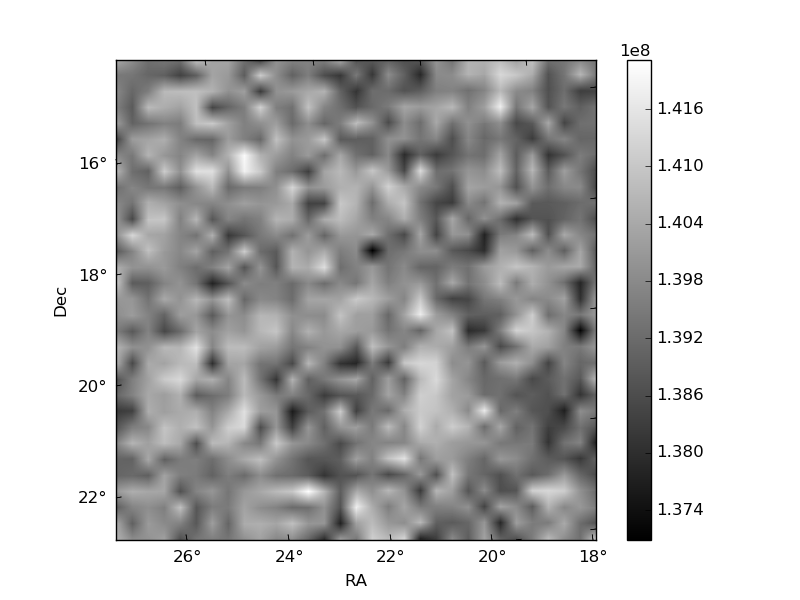
Quadrant B |
|---|---|---|---|
| Quadrant D | 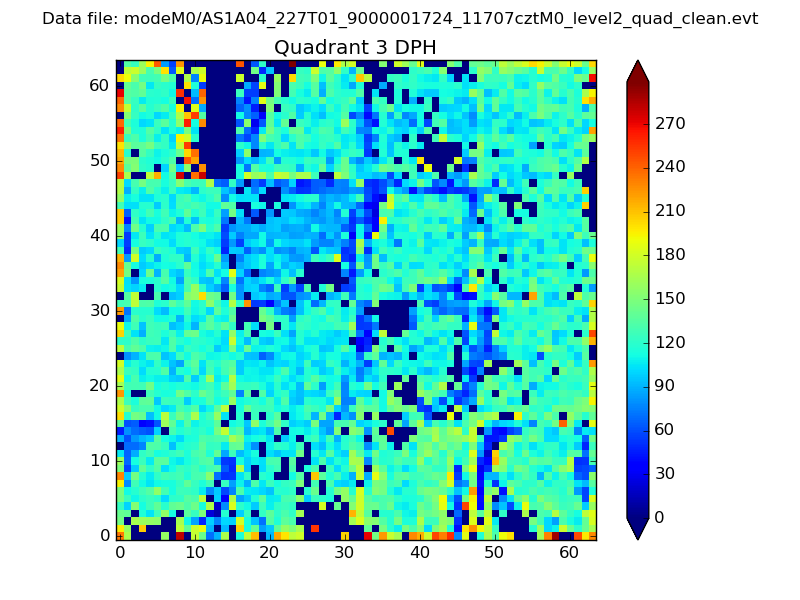 |
 |
Quadrant C |
| Plot type | Count rate plots | Images |
|---|---|---|
| Comparison with Poisson distribution Blue bars denote a histogram of data divided into 1 sec bins. Red curve is a Poisson curve with rate = median count rate of data. |
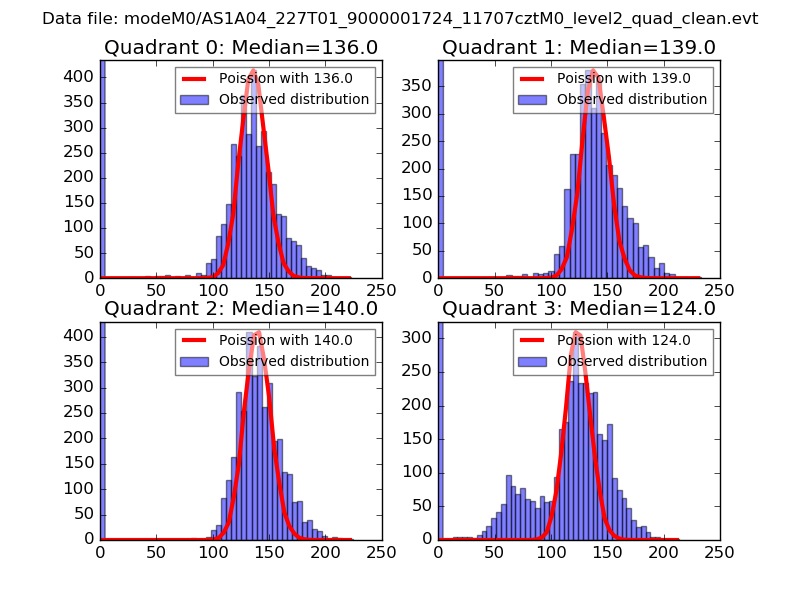 |
 |
| Quadrant-wise count rates Data is divided into 100 sec bins |
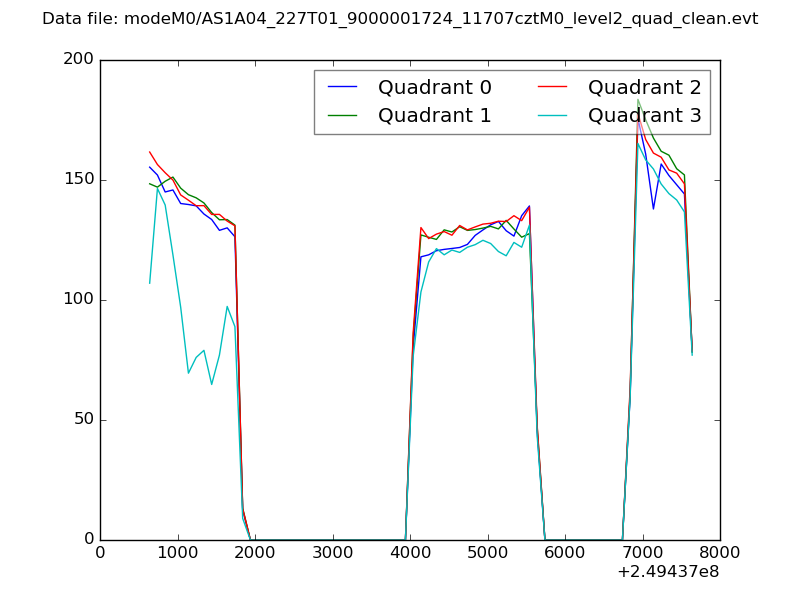 |
|
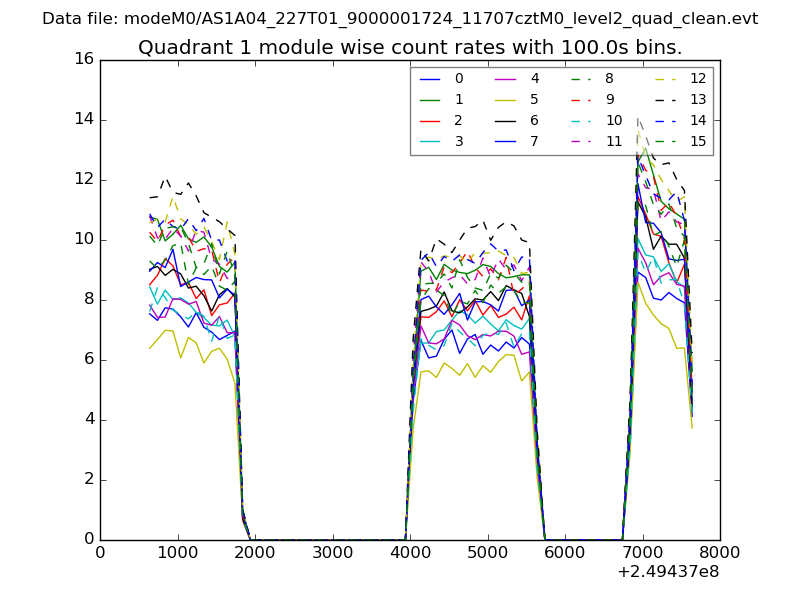
| Module-wise count rates for Quadrant A Data is divided into 100 sec bins |
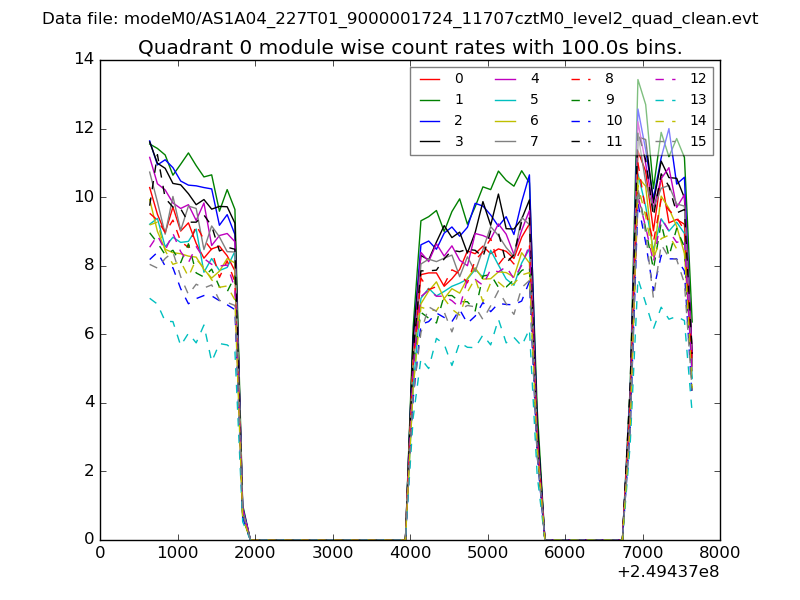 |
 |
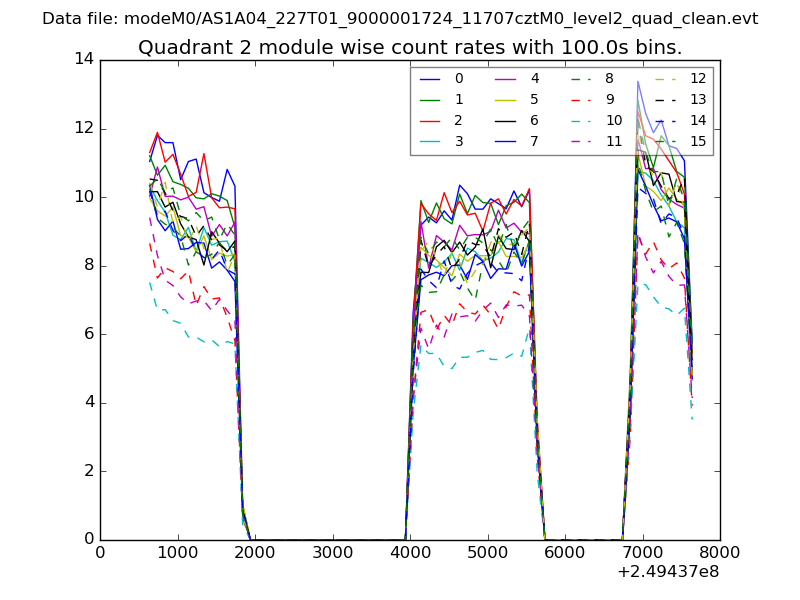
| Module-wise count rates for Quadrant B Data is divided into 100 sec bins |
 |
 |
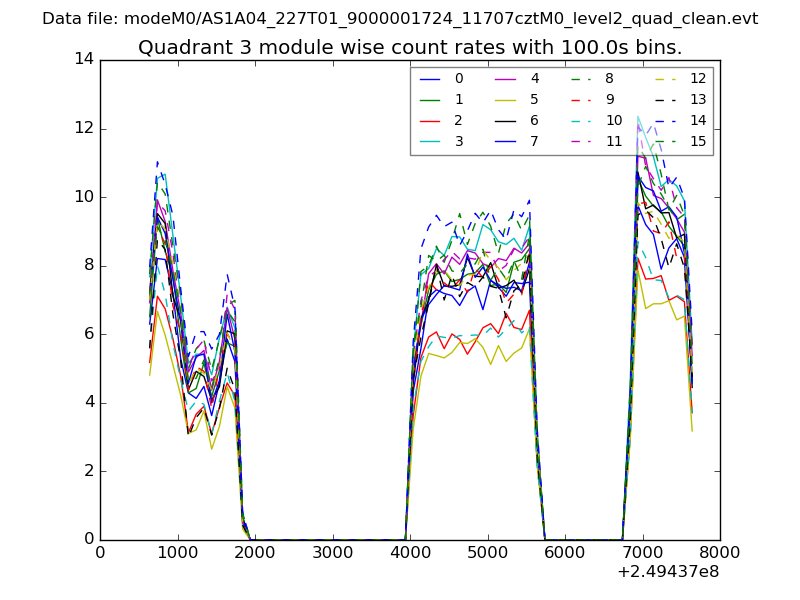
| Module-wise count rates for Quadrant C Data is divided into 100 sec bins |
 |
 |
| Module-wise count rates for Quadrant D Data is divided into 100 sec bins |
 |
 |
| Parameter | Plot |
|---|---|
| CZT HV Monitor | 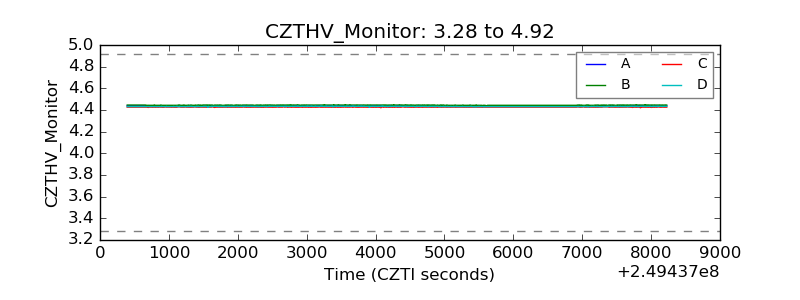 |
| D_VDD | 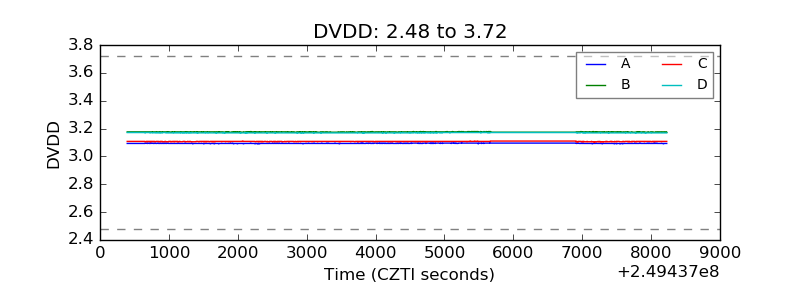 |
| Temperature 1 |  |
| Veto HV Monitor | 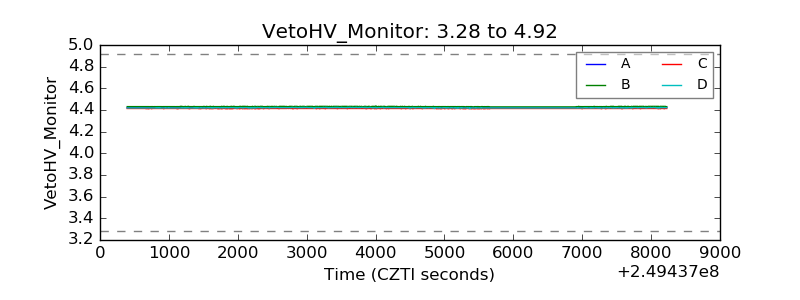 |
| Veto LLD | 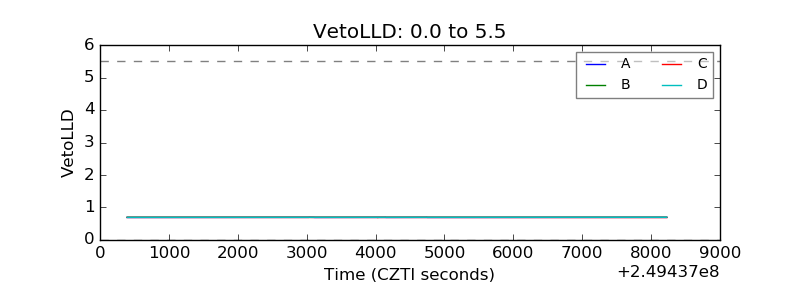 |
| Alpha Counter | 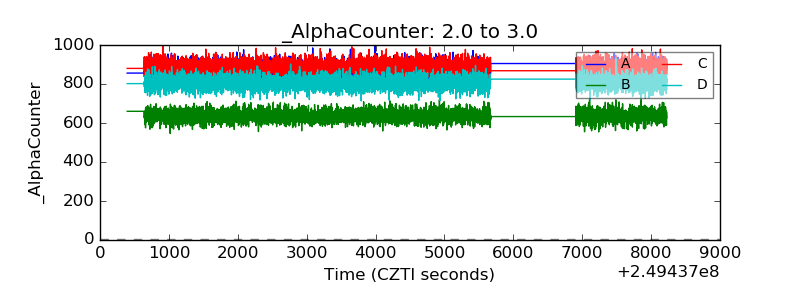 |
| _CPM_Rate | 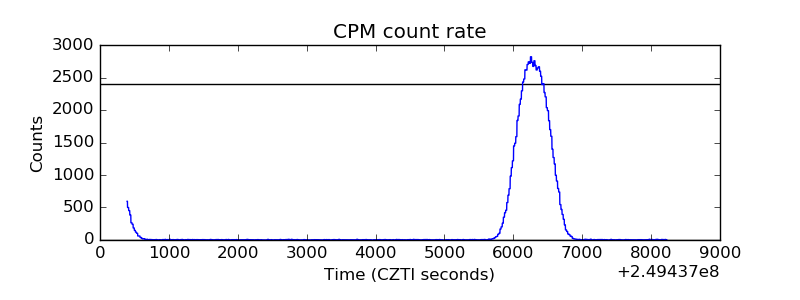 |
| CZT Counter | 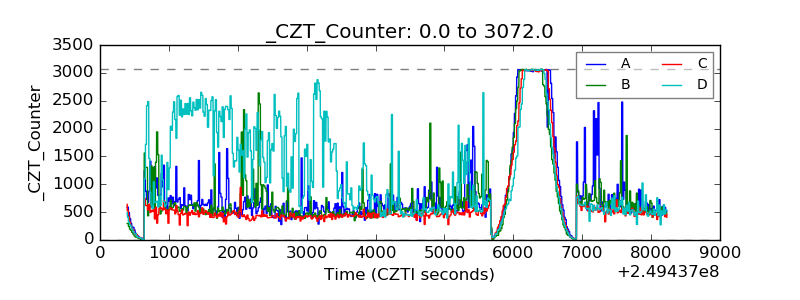 |
| +2.5 Volts monitor |  |
| +5 Volts monitor |  |
| _ROLL_ROT | 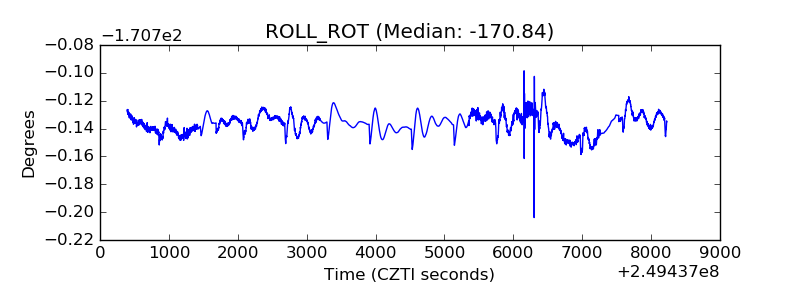 |
| _Roll_DEC |  |
| _Roll_RA | 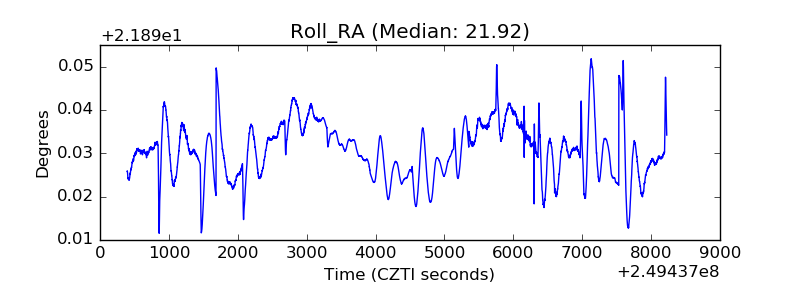 |
| Veto Counter | 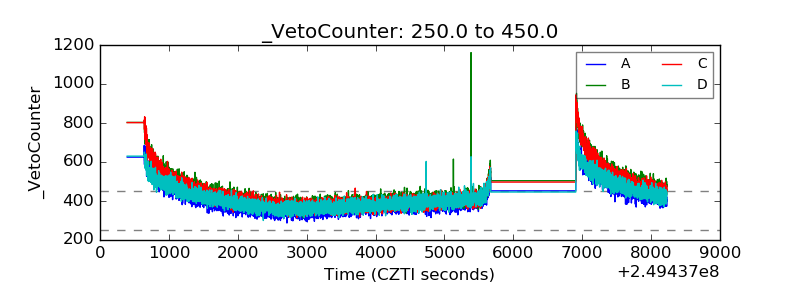 |