| Param | Original file | Final file |
|---|---|---|
| Filename | modeM0/AS1A04_227T01_9000001724_11709cztM0_level2.evt | modeM0/AS1A04_227T01_9000001724_11709cztM0_level2_quad_clean.evt |
| Size (bytes) | 535,063,680 | 64,117,440 |
| Size | 510.3 MB | 61.1 MB |
| Events in quadrant A | 4,373,660 | 376,391 |
| Events in quadrant B | 4,126,275 | 381,378 |
| Events in quadrant C | 3,158,593 | 381,622 |
| Events in quadrant D | 4,117,032 | 360,166 |
| Mode M0 | |||
|---|---|---|---|
| Quadrant | BADHDUFLAG | Total packets | Discarded packets |
| A | 0 | 17227 | 3 |
| B | 0 | 16202 | 2 |
| C | 0 | 13182 | 2 |
| D | 0 | 16306 | 2 |
| Mode SS | |||
|---|---|---|---|
| Quadrant | BADHDUFLAG | Total packets | Discarded packets |
| A | 0 | 130 | 0 |
| B | 0 | 130 | 0 |
| C | 0 | 130 | 0 |
| D | 0 | 130 | 0 |
| Mode M9 | |||
|---|---|---|---|
| Quadrant | BADHDUFLAG | Total packets | Discarded packets |
| A | 0 | 16 | 0 |
| B | 0 | 16 | 0 |
| C | 0 | 16 | 0 |
| D | 0 | 17 | 0 |
| Quadrant | Total seconds | Saturated seconds | Saturation percentage |
|---|---|---|---|
| A | 6326 | 108 | 1.707240% |
| B | 6326 | 250 | 3.951944% |
| C | 6326 | 18 | 0.284540% |
| D | 6326 | 116 | 1.833702% |
Noise dominated data is calculated using 1-second bins in cleaned event files. If a bin has >2000 counts, and if more than 50% of those come from <1% of pixels, then it is considered to be noise-dominated and hence unusable.
| Quadrant | # 1 sec bins | Bins with >0 counts | Bins with >2000 counts | High rate bins dominated by noise | Noise dominated (total time) | Noise dominated (detector-on time) | Marked lightcurve |
|---|---|---|---|---|---|---|---|
| A | 7662 | 6328 | 36 | 36 | 0.47% | 0.57% | 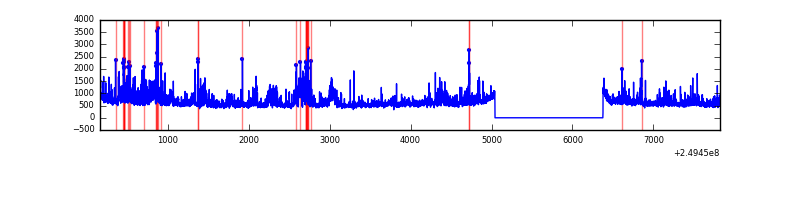 |
| B | 7662 | 6328 | 122 | 122 | 1.59% | 1.93% | 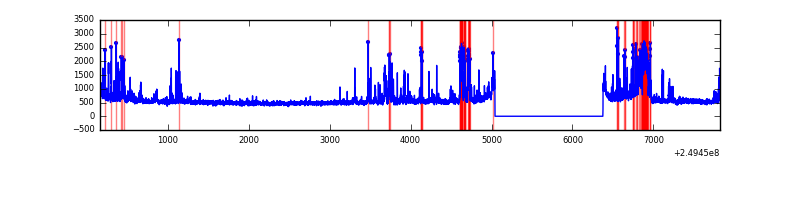 |
| C | 7662 | 6328 | 0 | 0 | 0.00% | 0.00% | 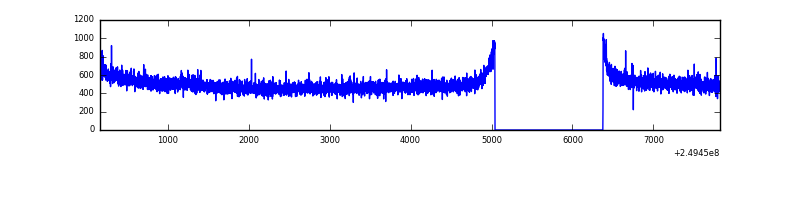 |
| D | 7662 | 6328 | 82 | 82 | 1.07% | 1.30% | 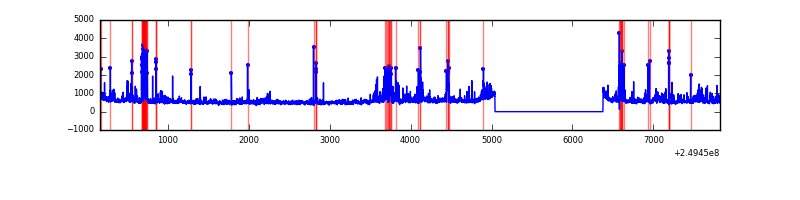 |
Top three noisy pixels from each quadrant. If the there are fewer than three noisy pixels in the level2.evt file, extra rows are filled as -1
| Pixel properties | Quadrant properties | ||||||
|---|---|---|---|---|---|---|---|
| Quadrant | DetID | PixID | Counts | Sigma | Mean | Median | Sigma |
| A | 8 | 5 | 870695 | 5226.83 | 827 | 813 | 166.4 |
| A | 1 | 162 | 111081 | 662.56 | 827 | 813 | 166.4 |
| A | 1 | 178 | 60194 | 356.8 | 827 | 813 | 166.4 |
| B | 4 | 239 | 391636 | 2517.54 | 832 | 815 | 155.2 |
| B | 3 | 64 | 337988 | 2171.96 | 832 | 815 | 155.2 |
| B | 15 | 204 | 46518 | 294.4 | 832 | 815 | 155.2 |
| C | 13 | 61 | 6047 | 28.17 | 808 | 814 | 185.8 |
| C | 4 | 175 | 4903 | 22.01 | 808 | 814 | 185.8 |
| C | 12 | 4 | 2424 | 8.67 | 808 | 814 | 185.8 |
| D | 7 | 80 | 293779 | 1564.08 | 790 | 770 | 187.3 |
| D | 8 | 195 | 226768 | 1206.37 | 790 | 770 | 187.3 |
| D | 1 | 52 | 184094 | 978.58 | 790 | 770 | 187.3 |
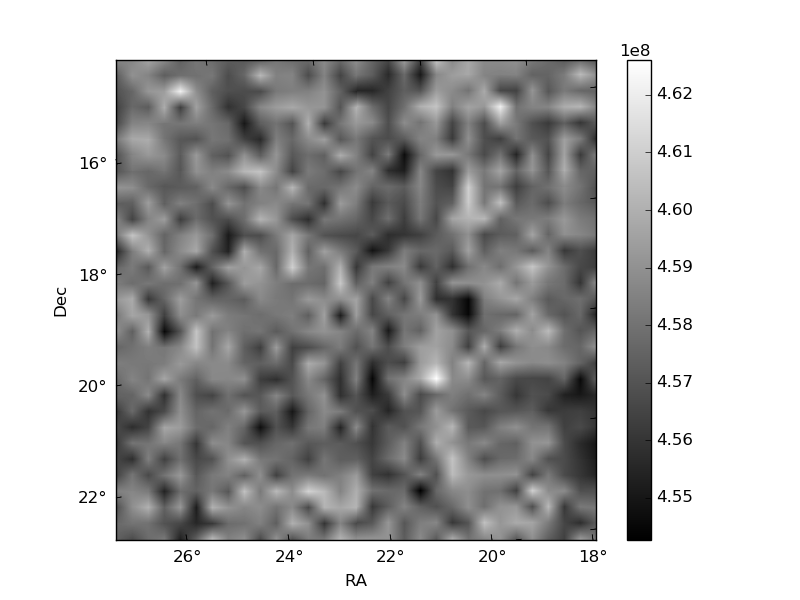
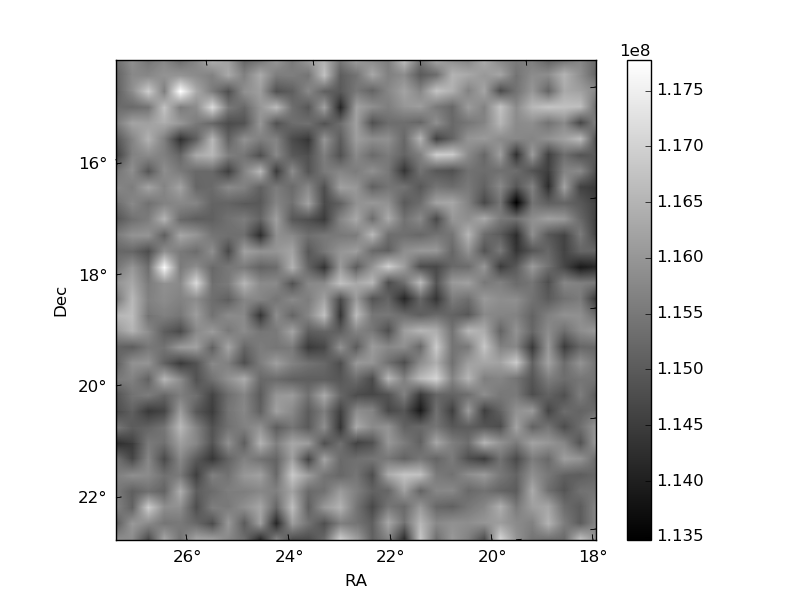
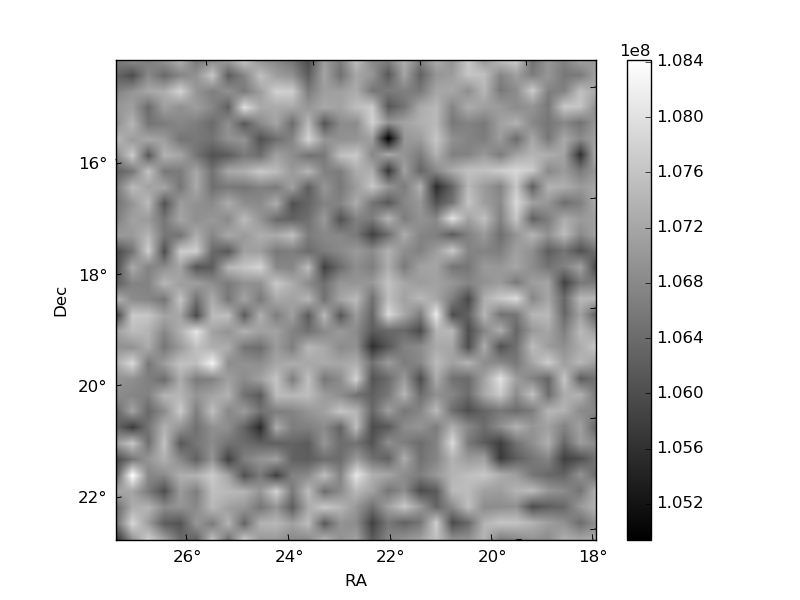
Histogram calculated using DETX and DETY for each event in the final _common_clean file
| Quadrant A | 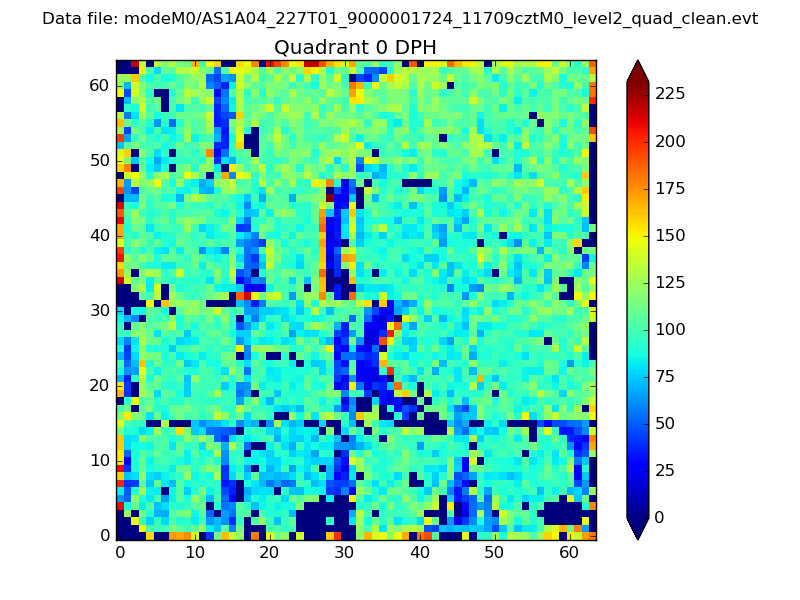 |
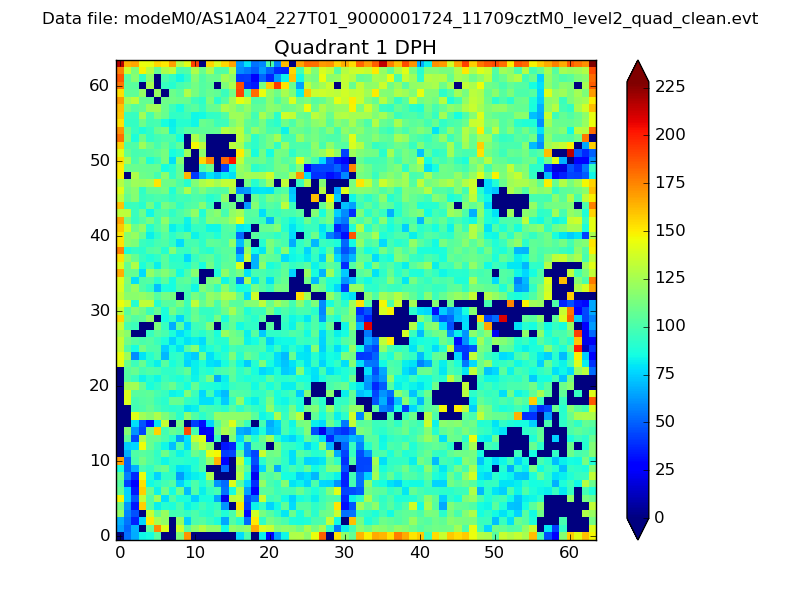 |
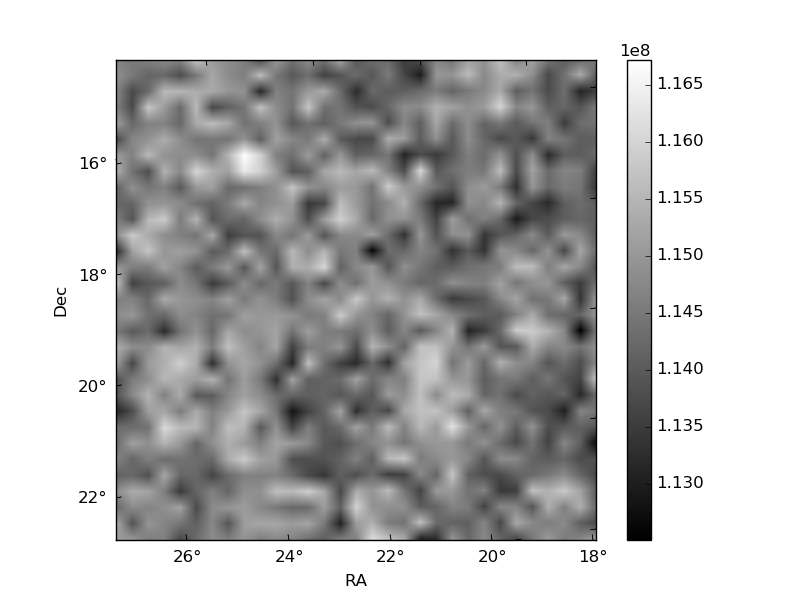
Quadrant B |
|---|---|---|---|
| Quadrant D | 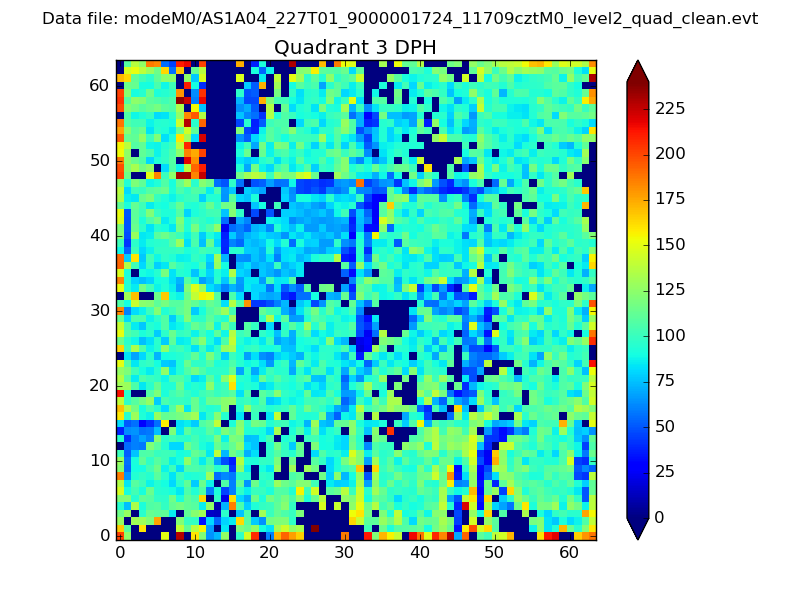 |
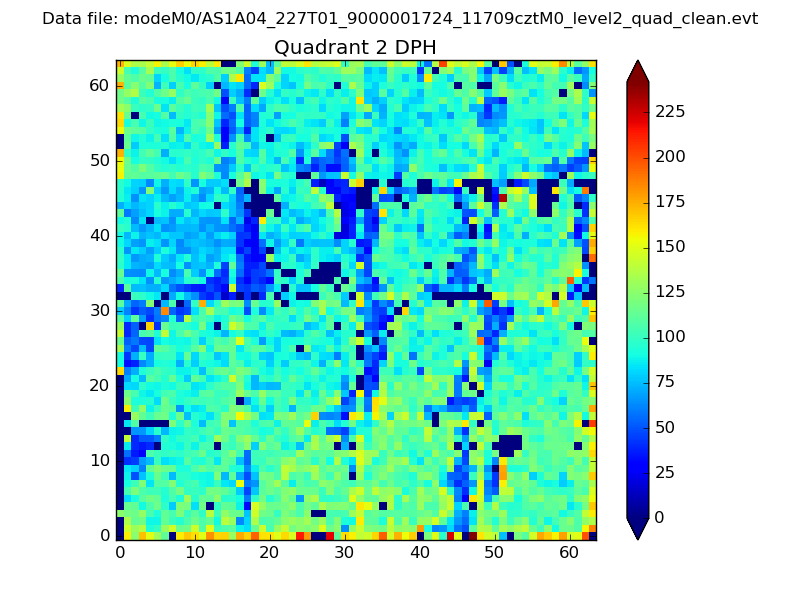 |
Quadrant C |
| Plot type | Count rate plots | Images |
|---|---|---|
| Comparison with Poisson distribution Blue bars denote a histogram of data divided into 1 sec bins. Red curve is a Poisson curve with rate = median count rate of data. |
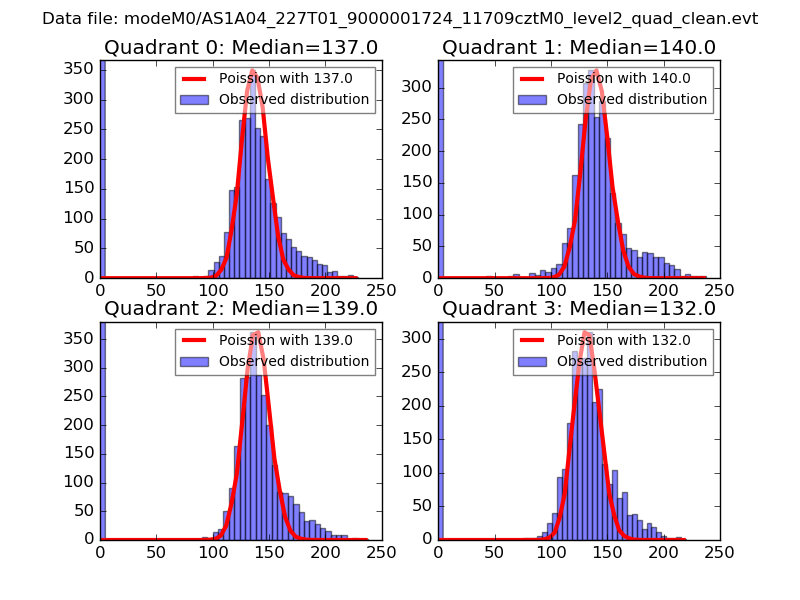 |
 |
| Quadrant-wise count rates Data is divided into 100 sec bins |
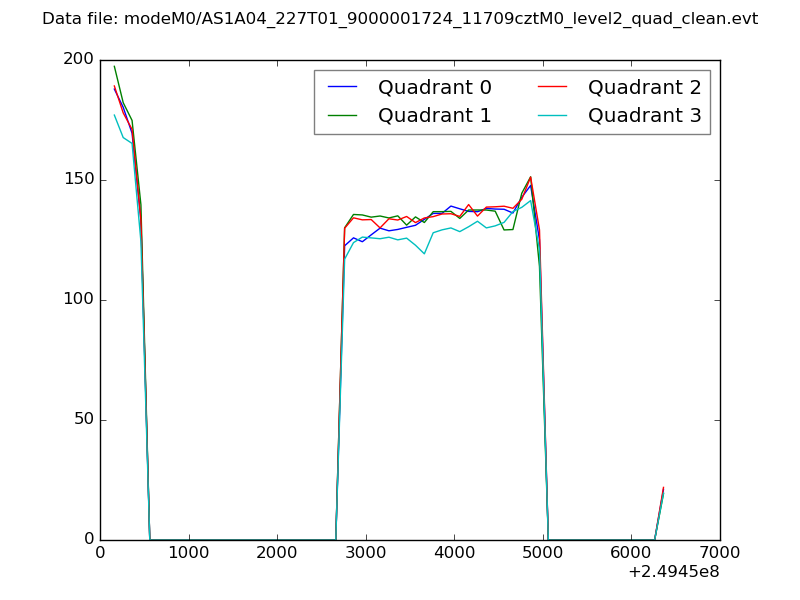 |
|
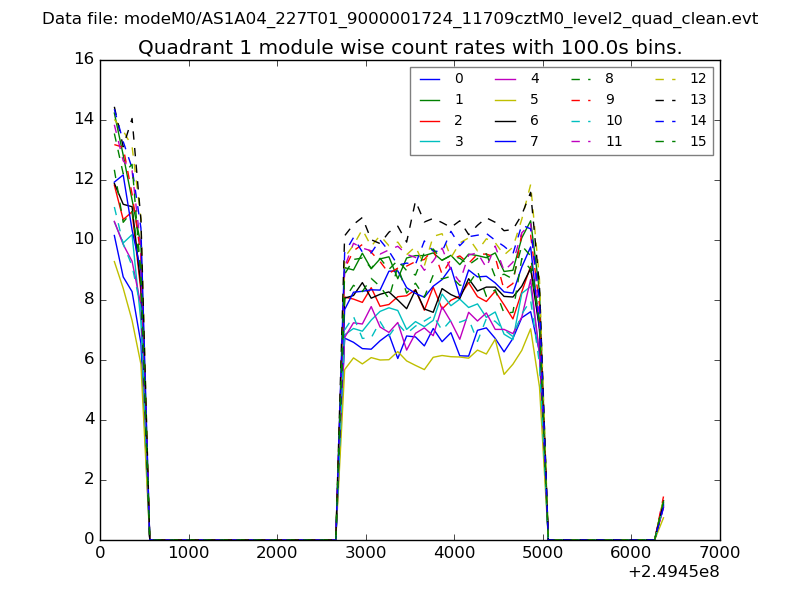
| Module-wise count rates for Quadrant A Data is divided into 100 sec bins |
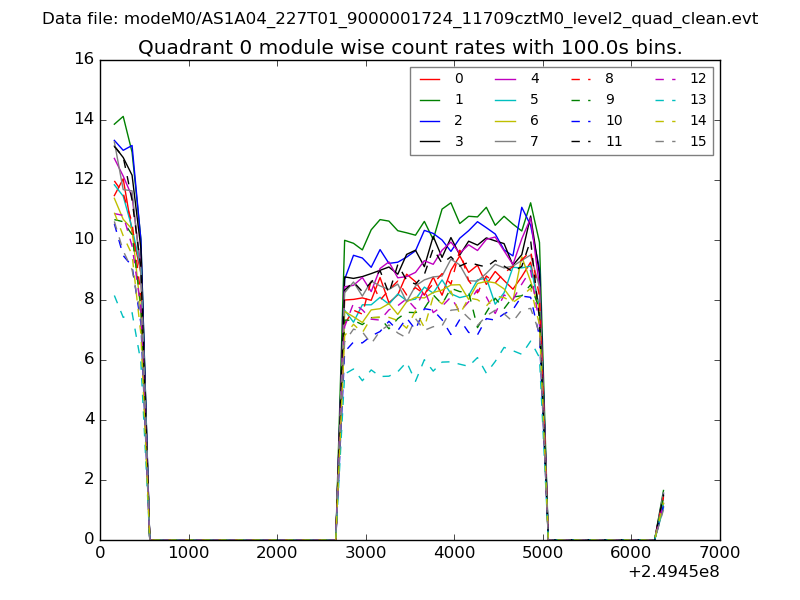 |
 |
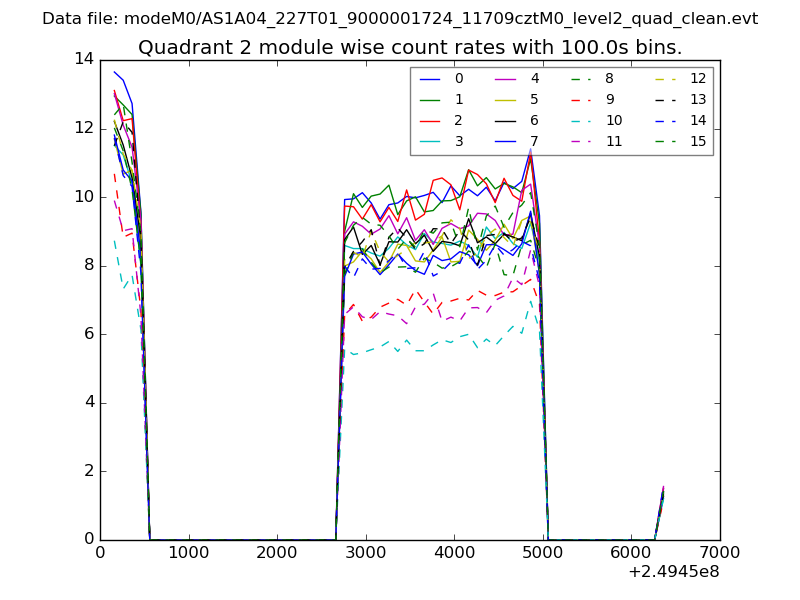
| Module-wise count rates for Quadrant B Data is divided into 100 sec bins |
 |
 |
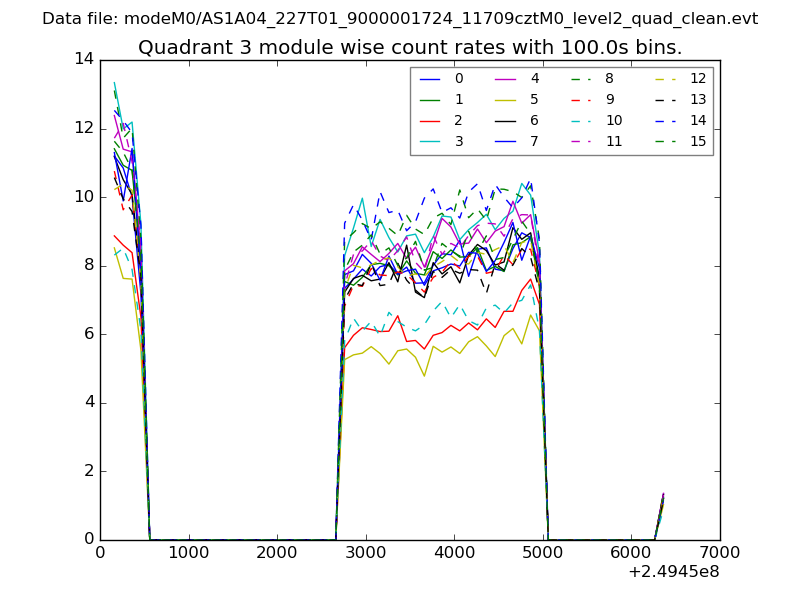
| Module-wise count rates for Quadrant C Data is divided into 100 sec bins |
 |
 |
| Module-wise count rates for Quadrant D Data is divided into 100 sec bins |
 |
 |
| Parameter | Plot |
|---|---|
| CZT HV Monitor | 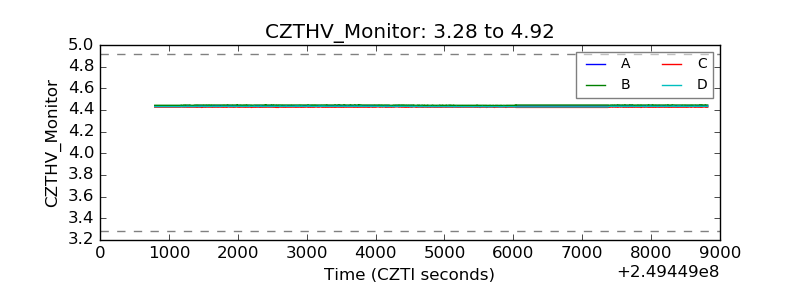 |
| D_VDD | 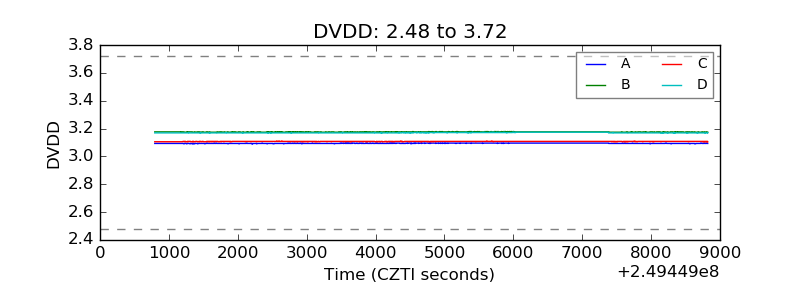 |
| Temperature 1 | 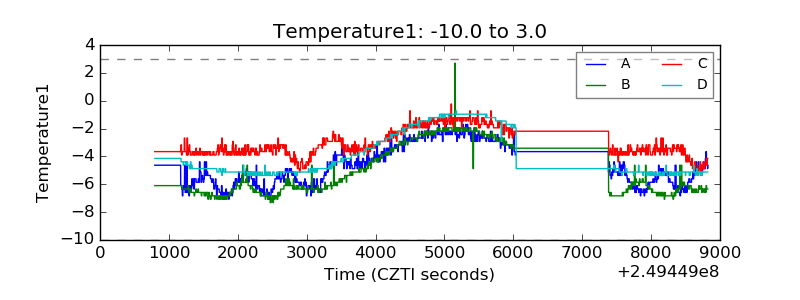 |
| Veto HV Monitor | 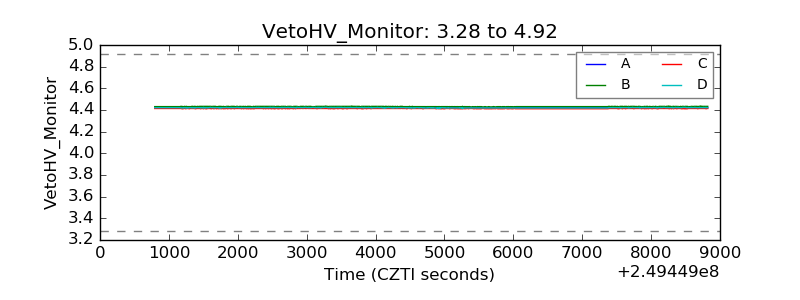 |
| Veto LLD | 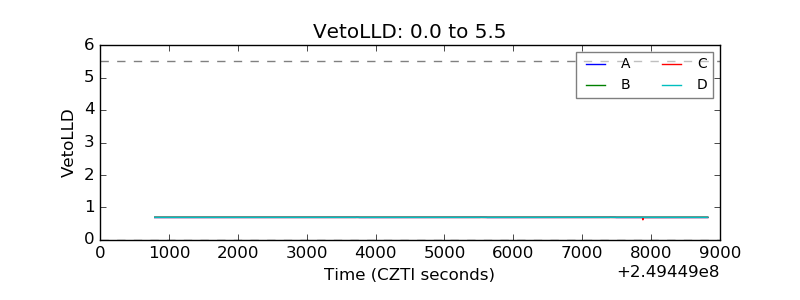 |
| Alpha Counter | 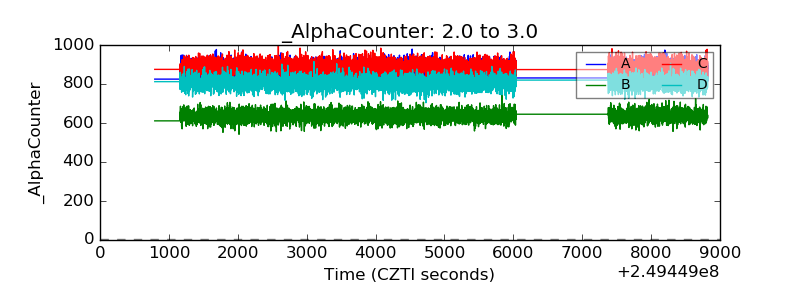 |
| _CPM_Rate | 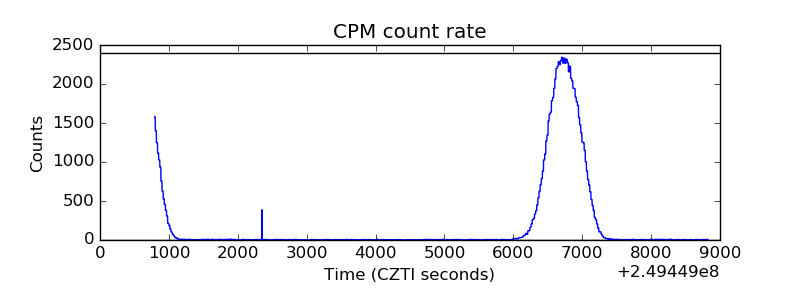 |
| CZT Counter | 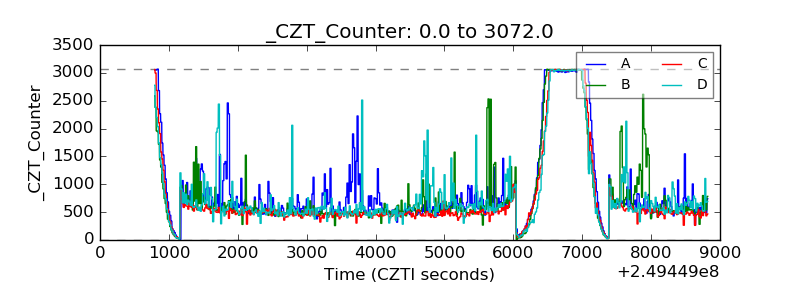 |
| +2.5 Volts monitor |  |
| +5 Volts monitor | 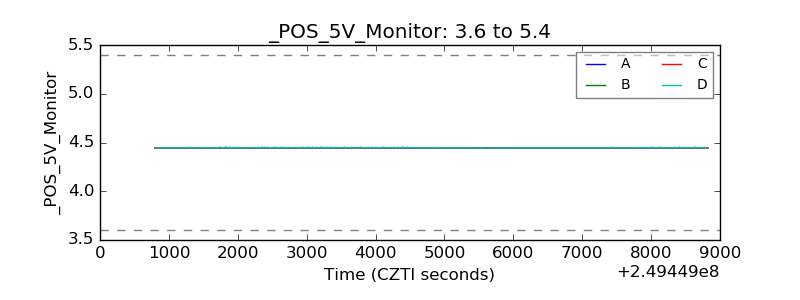 |
| _ROLL_ROT | 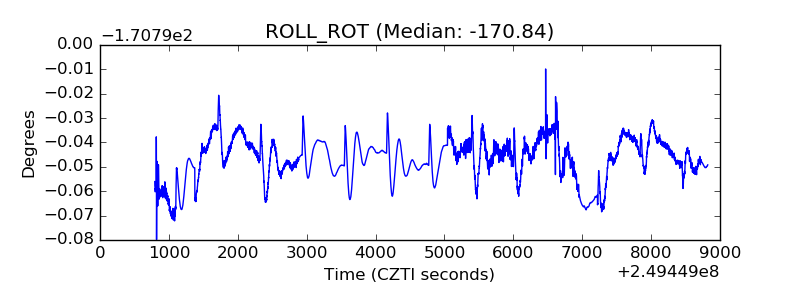 |
| _Roll_DEC | 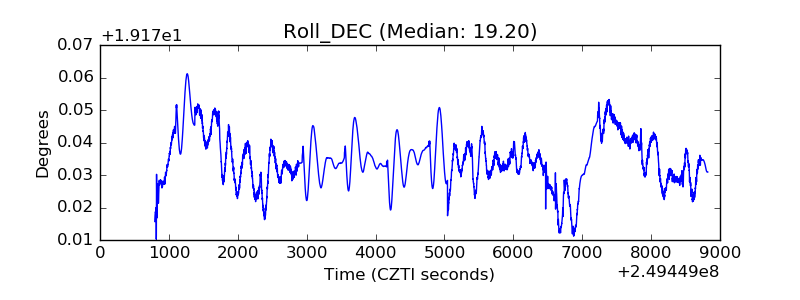 |
| _Roll_RA | 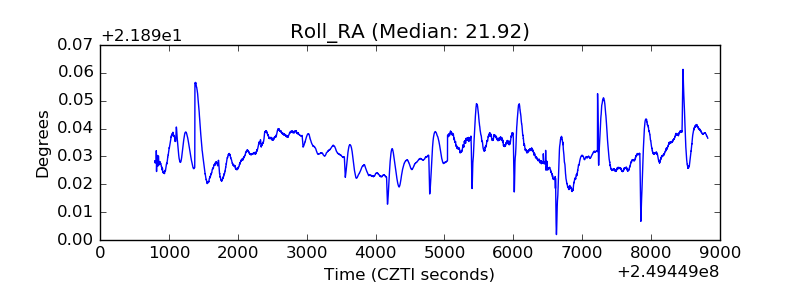 |
| Veto Counter | 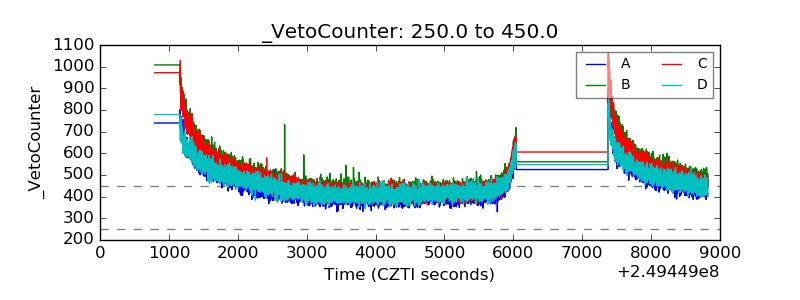 |