| Param | Original file | Final file |
|---|---|---|
| Filename | modeM0/AS1A04_227T01_9000001724_11710cztM0_level2.evt | modeM0/AS1A04_227T01_9000001724_11710cztM0_level2_quad_clean.evt |
| Size (bytes) | 577,563,840 | 61,862,400 |
| Size | 550.8 MB | 59.0 MB |
| Events in quadrant A | 4,663,882 | 362,077 |
| Events in quadrant B | 4,189,096 | 373,565 |
| Events in quadrant C | 3,146,894 | 375,424 |
| Events in quadrant D | 5,063,291 | 319,979 |
| Mode M0 | |||
|---|---|---|---|
| Quadrant | BADHDUFLAG | Total packets | Discarded packets |
| A | 0 | 18052 | 2 |
| B | 0 | 16338 | 2 |
| C | 0 | 13203 | 2 |
| D | 0 | 19241 | 2 |
| Mode SS | |||
|---|---|---|---|
| Quadrant | BADHDUFLAG | Total packets | Discarded packets |
| A | 0 | 130 | 0 |
| B | 0 | 130 | 0 |
| C | 0 | 130 | 0 |
| D | 0 | 130 | 0 |
| Mode M9 | |||
|---|---|---|---|
| Quadrant | BADHDUFLAG | Total packets | Discarded packets |
| A | 0 | 15 | 0 |
| B | 0 | 15 | 0 |
| C | 0 | 15 | 0 |
| D | 0 | 16 | 0 |
| Quadrant | Total seconds | Saturated seconds | Saturation percentage |
|---|---|---|---|
| A | 6311 | 235 | 3.723657% |
| B | 6327 | 276 | 4.362257% |
| C | 6327 | 37 | 0.584795% |
| D | 6327 | 515 | 8.139719% |
Noise dominated data is calculated using 1-second bins in cleaned event files. If a bin has >2000 counts, and if more than 50% of those come from <1% of pixels, then it is considered to be noise-dominated and hence unusable.
| Quadrant | # 1 sec bins | Bins with >0 counts | Bins with >2000 counts | High rate bins dominated by noise | Noise dominated (total time) | Noise dominated (detector-on time) | Marked lightcurve |
|---|---|---|---|---|---|---|---|
| A | 7627 | 6313 | 98 | 98 | 1.28% | 1.55% | 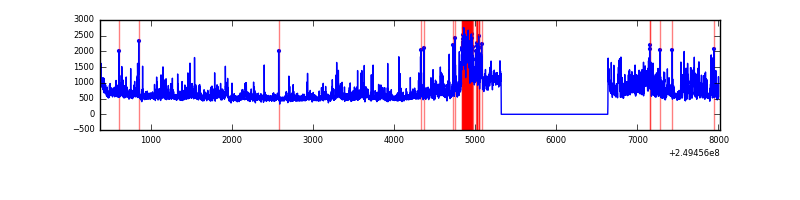 |
| B | 7643 | 6329 | 120 | 120 | 1.57% | 1.90% | 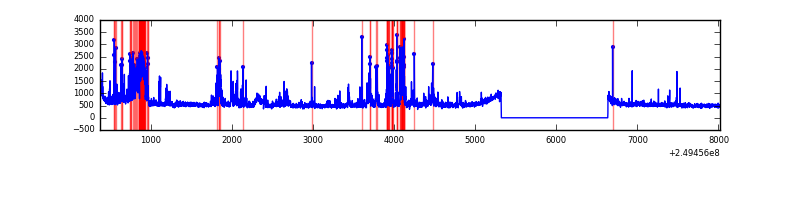 |
| C | 7643 | 6329 | 0 | 0 | 0.00% | 0.00% | 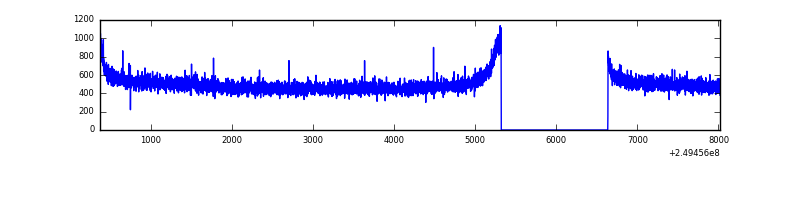 |
| D | 7643 | 6329 | 434 | 434 | 5.68% | 6.86% | 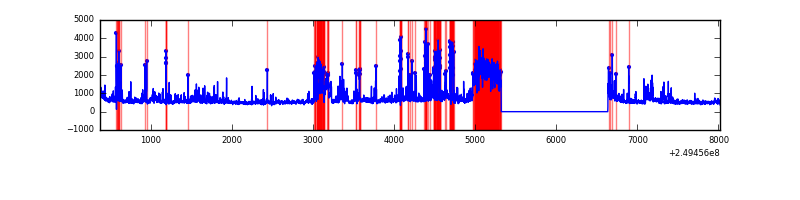 |
Top three noisy pixels from each quadrant. If the there are fewer than three noisy pixels in the level2.evt file, extra rows are filled as -1
| Pixel properties | Quadrant properties | ||||||
|---|---|---|---|---|---|---|---|
| Quadrant | DetID | PixID | Counts | Sigma | Mean | Median | Sigma |
| A | 8 | 5 | 807146 | 4844.75 | 823 | 809 | 166.4 |
| A | 8 | 15 | 431068 | 2585.14 | 823 | 809 | 166.4 |
| A | 1 | 162 | 81401 | 484.22 | 823 | 809 | 166.4 |
| B | 3 | 64 | 518661 | 3297.71 | 830 | 813 | 157.0 |
| B | 4 | 239 | 308868 | 1961.73 | 830 | 813 | 157.0 |
| B | 15 | 204 | 39012 | 243.26 | 830 | 813 | 157.0 |
| C | 13 | 61 | 5862 | 27.13 | 806 | 813 | 186.1 |
| C | 8 | 222 | 3512 | 14.51 | 806 | 813 | 186.1 |
| C | 3 | 202 | 1986 | 6.3 | 806 | 813 | 186.1 |
| D | 7 | 80 | 1263866 | 6919.32 | 762 | 741 | 182.6 |
| D | 8 | 195 | 312148 | 1705.87 | 762 | 741 | 182.6 |
| D | 1 | 52 | 301565 | 1647.89 | 762 | 741 | 182.6 |
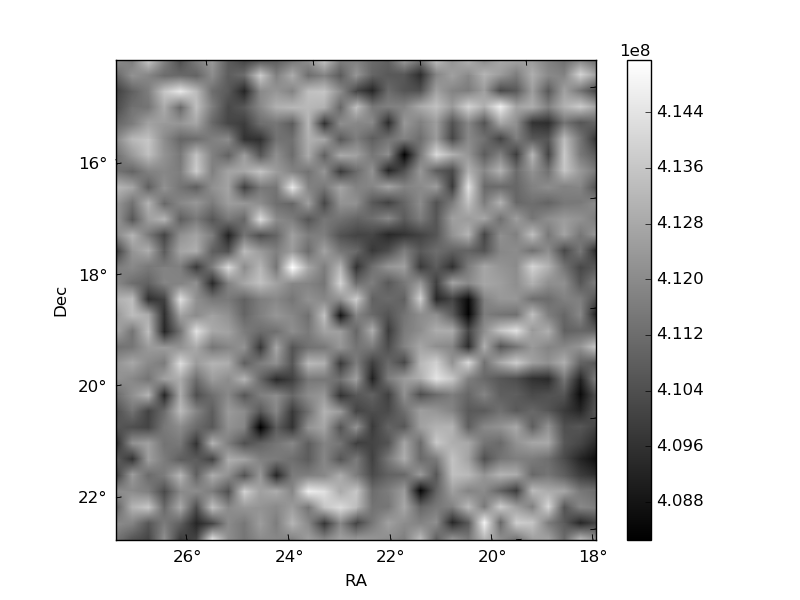
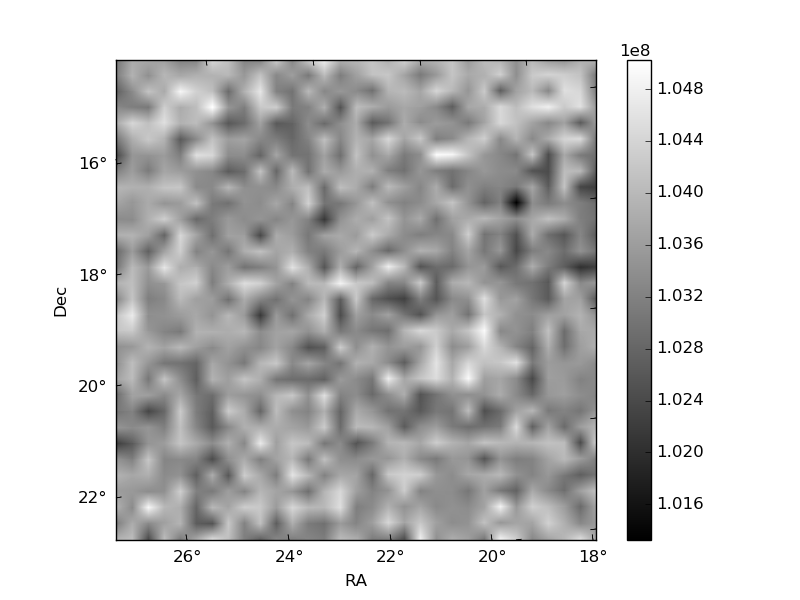
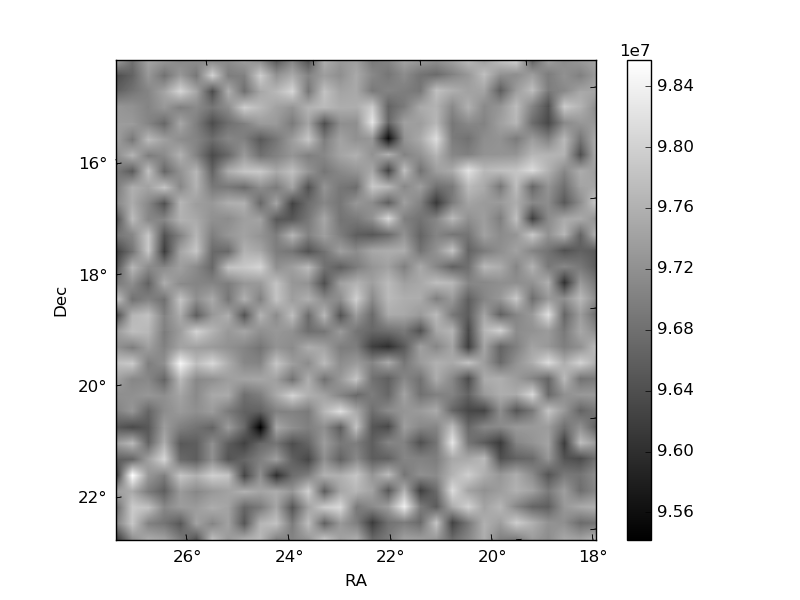
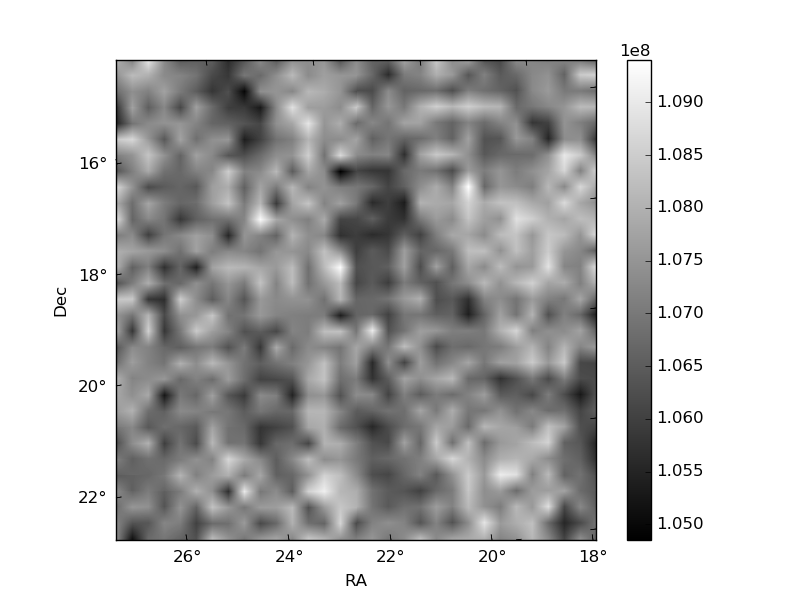
Histogram calculated using DETX and DETY for each event in the final _common_clean file
| Quadrant A | 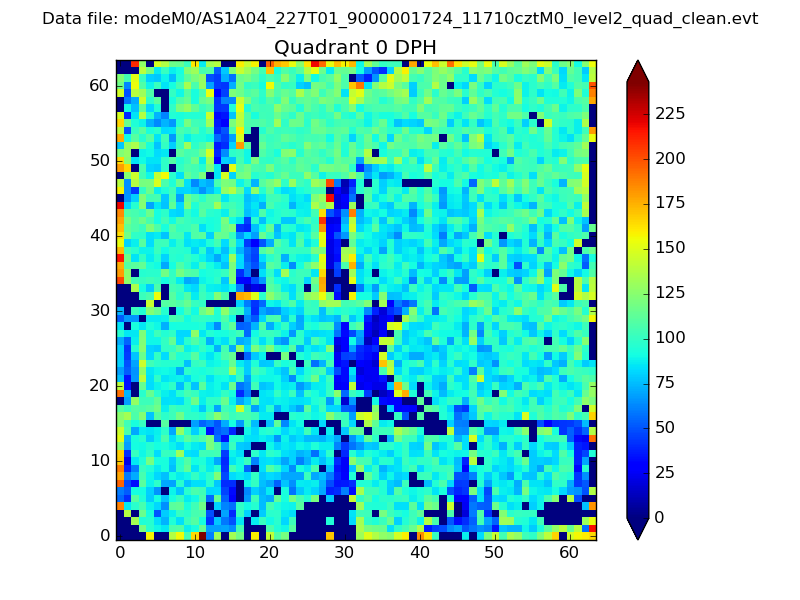 |
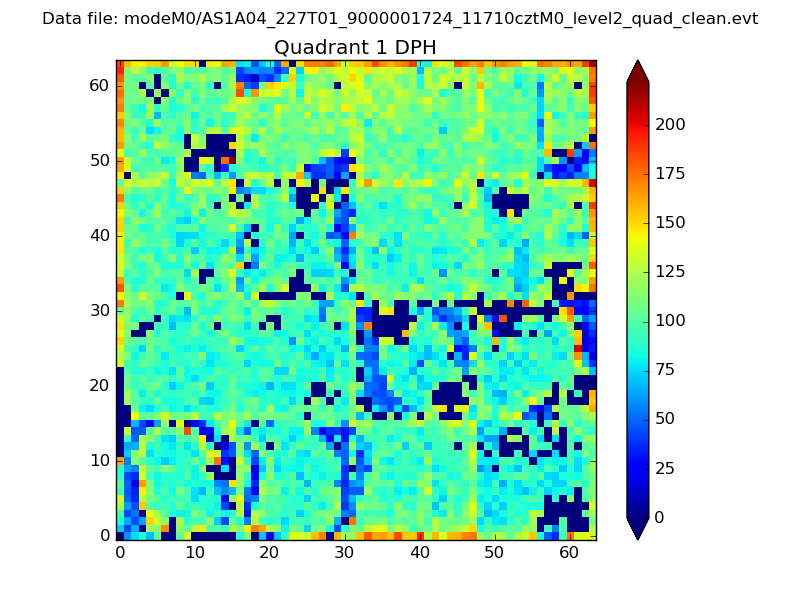 |
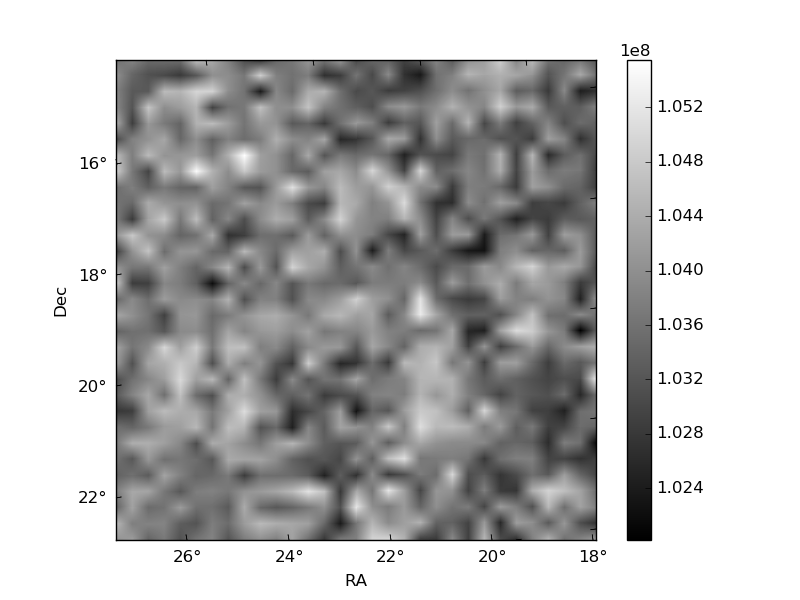
Quadrant B |
|---|---|---|---|
| Quadrant D | 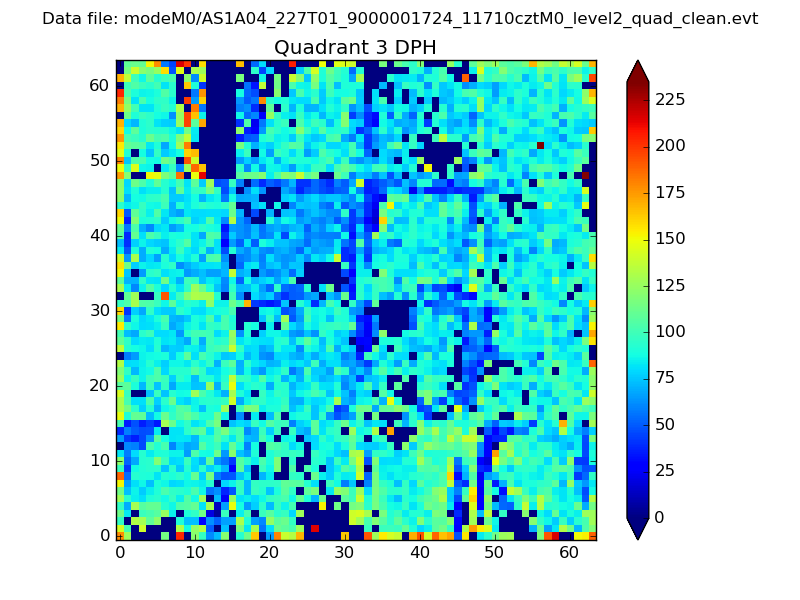 |
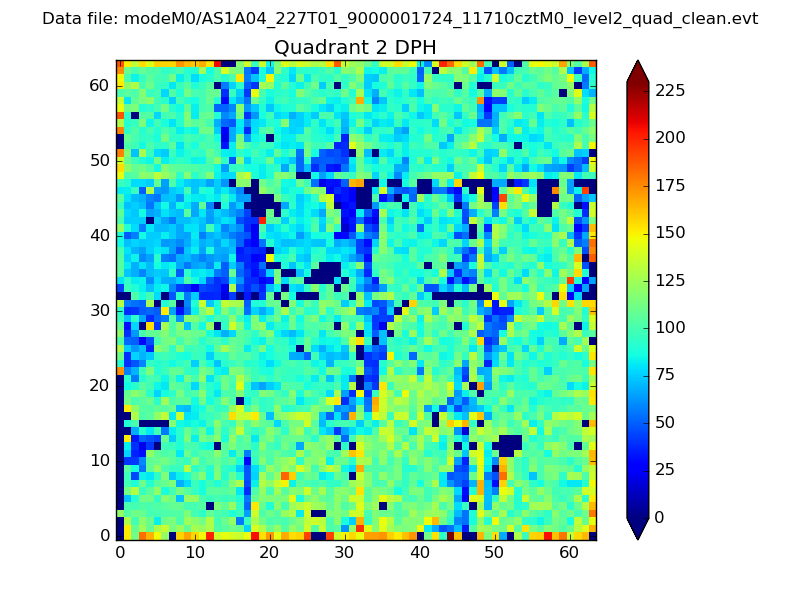 |
Quadrant C |
| Plot type | Count rate plots | Images |
|---|---|---|
| Comparison with Poisson distribution Blue bars denote a histogram of data divided into 1 sec bins. Red curve is a Poisson curve with rate = median count rate of data. |
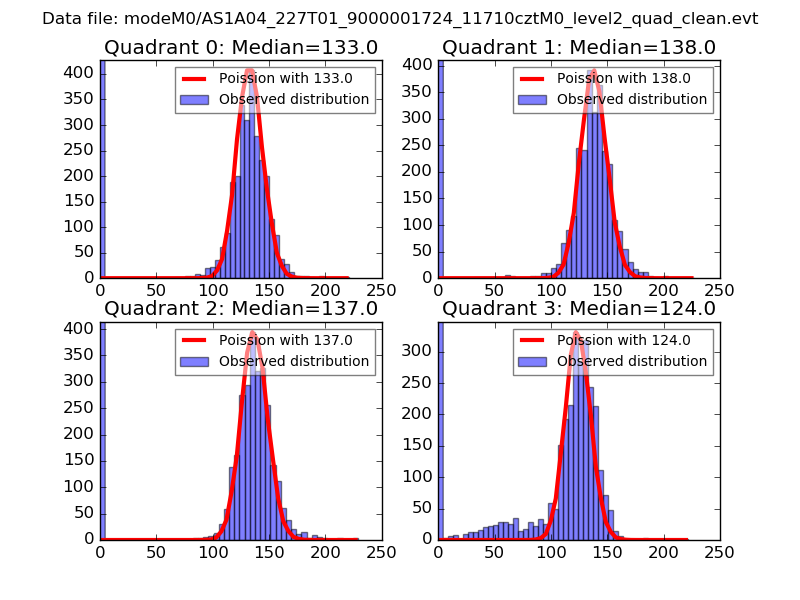 |
 |
| Quadrant-wise count rates Data is divided into 100 sec bins |
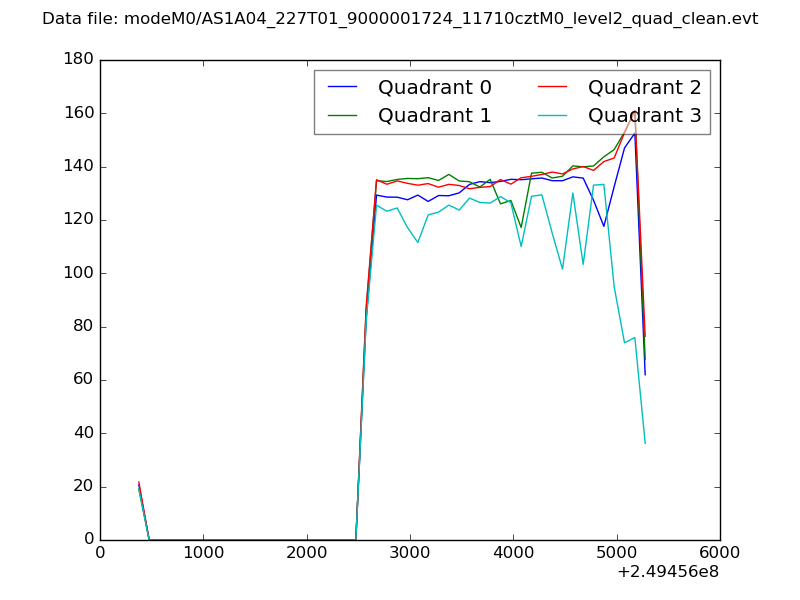 |
|
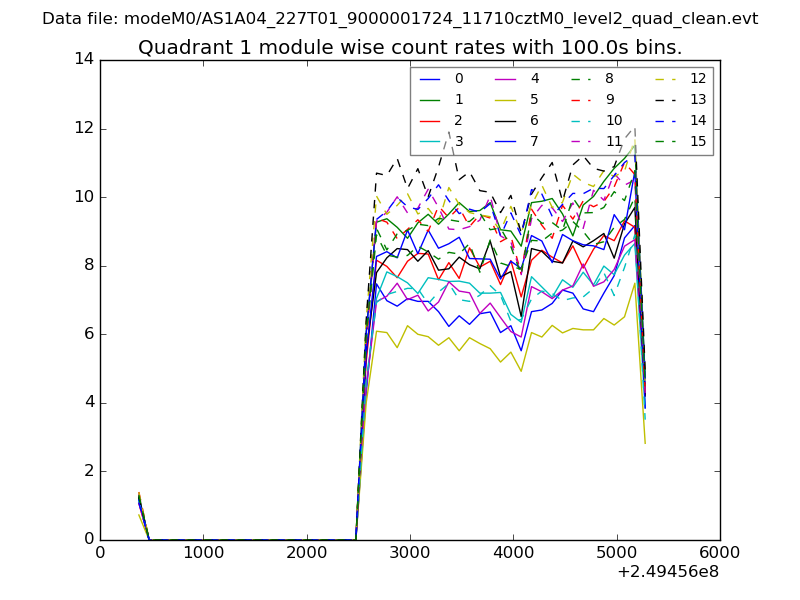
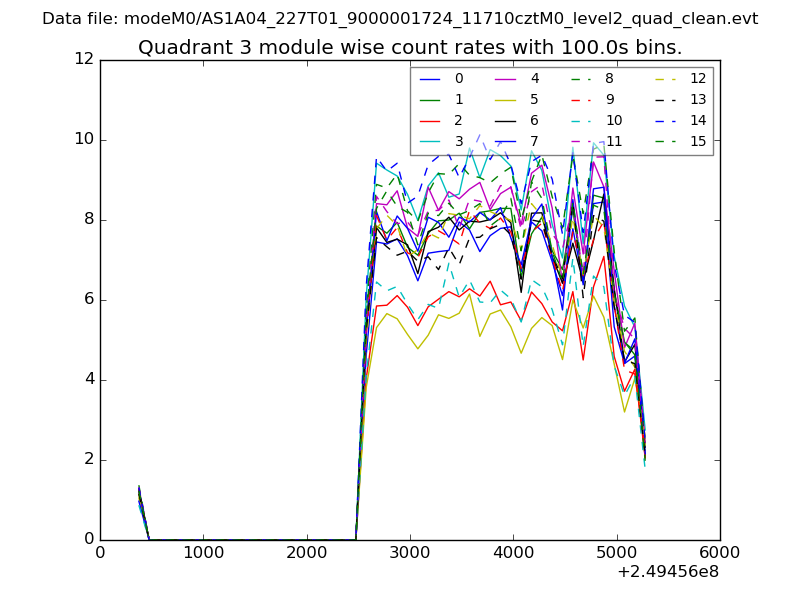
| Module-wise count rates for Quadrant A Data is divided into 100 sec bins |
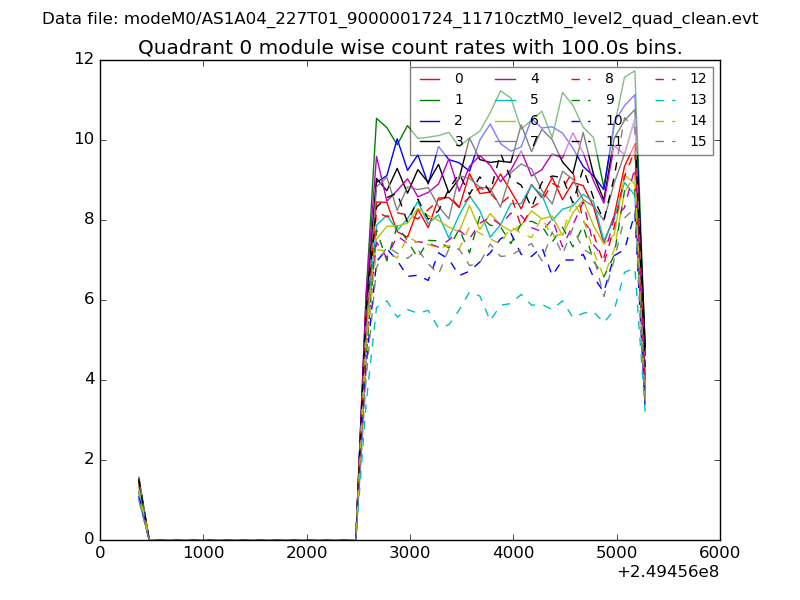 |
 |
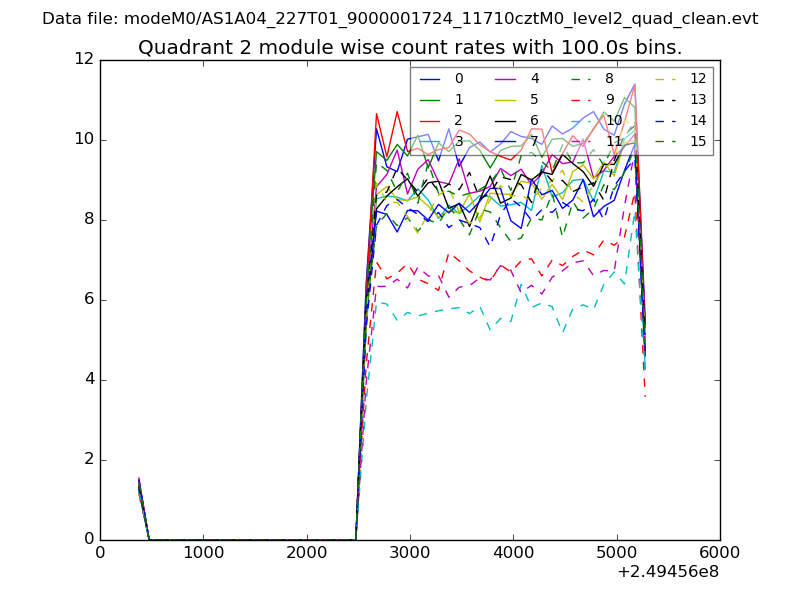
| Module-wise count rates for Quadrant B Data is divided into 100 sec bins |
 |
 |
| Module-wise count rates for Quadrant C Data is divided into 100 sec bins |
 |
 |
| Module-wise count rates for Quadrant D Data is divided into 100 sec bins |
 |
 |
| Parameter | Plot |
|---|---|
| CZT HV Monitor | 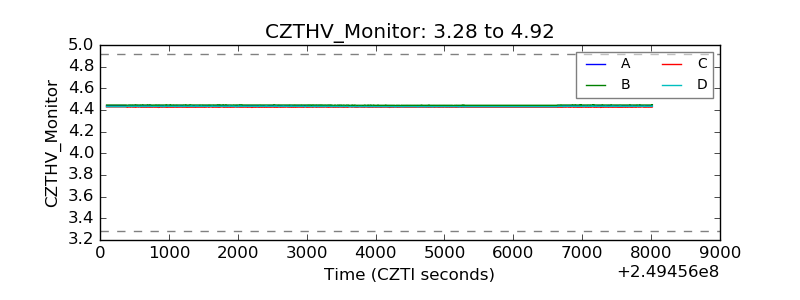 |
| D_VDD | 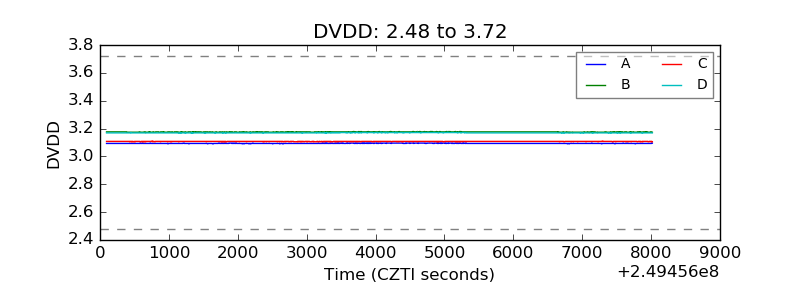 |
| Temperature 1 | 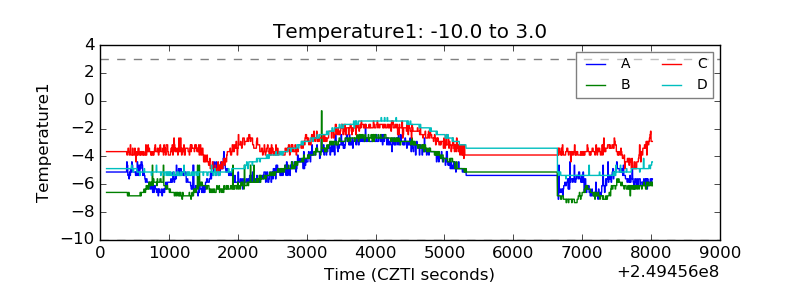 |
| Veto HV Monitor | 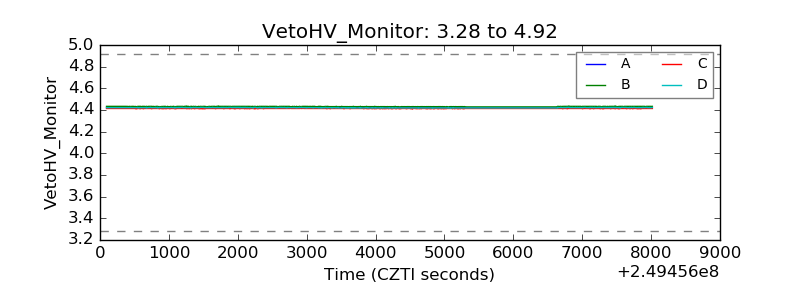 |
| Veto LLD | 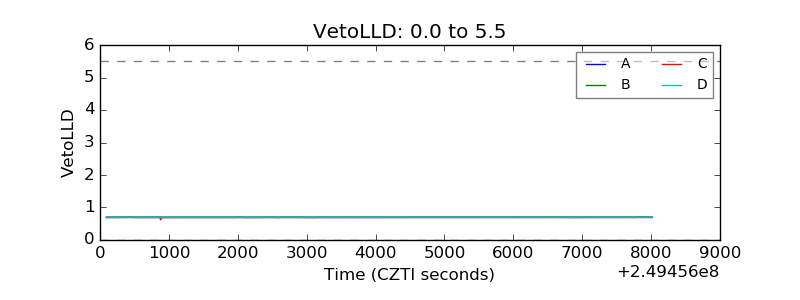 |
| Alpha Counter | 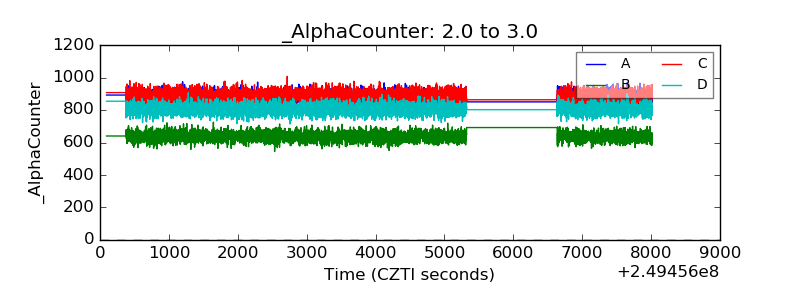 |
| _CPM_Rate | 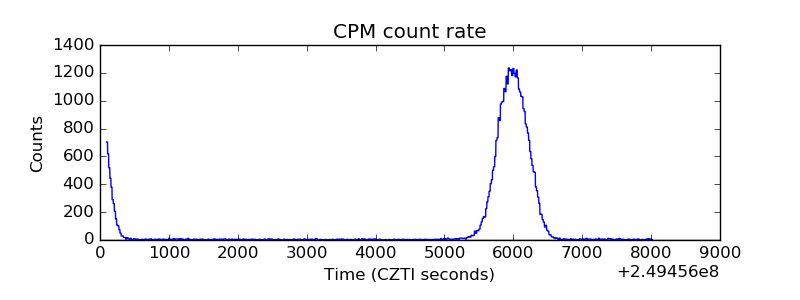 |
| CZT Counter | 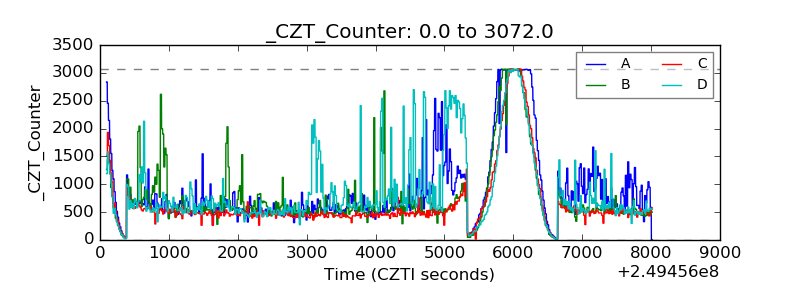 |
| +2.5 Volts monitor |  |
| +5 Volts monitor | 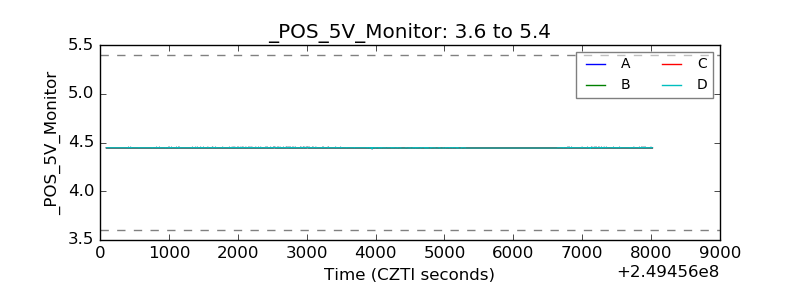 |
| _ROLL_ROT | 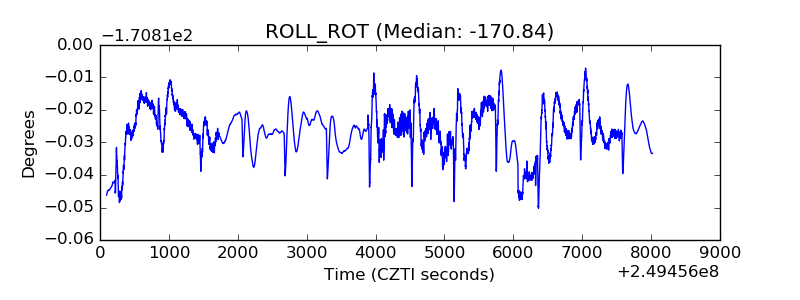 |
| _Roll_DEC | 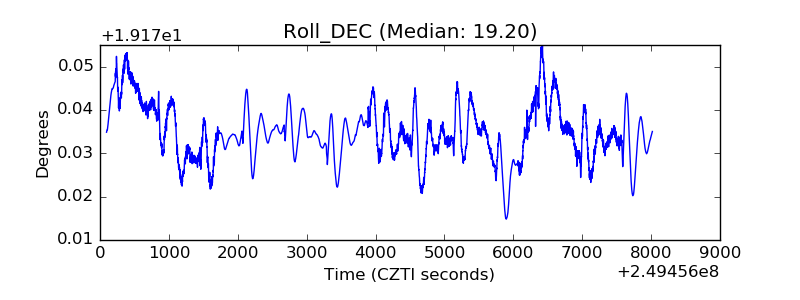 |
| _Roll_RA | 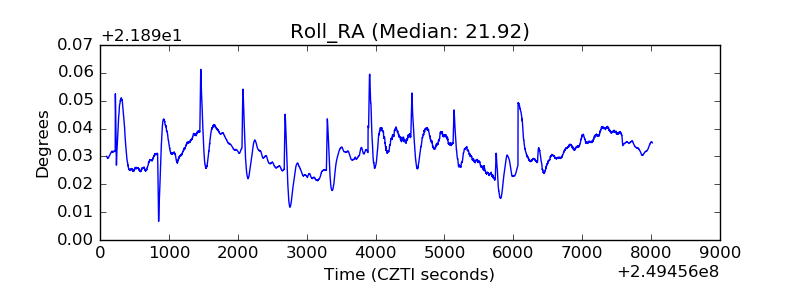 |
| Veto Counter | 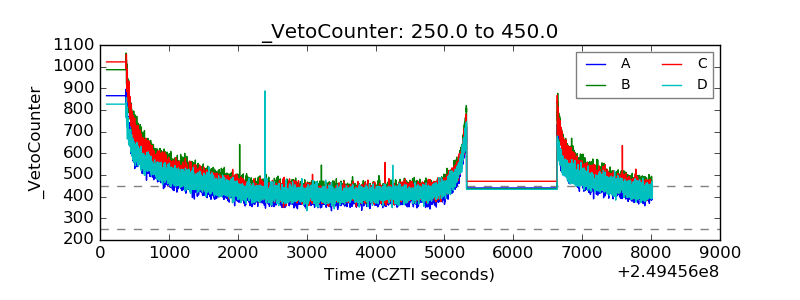 |