| Param | Original file | Final file |
|---|---|---|
| Filename | modeM0/AS1A04_227T01_9000001724_11711cztM0_level2.evt | modeM0/AS1A04_227T01_9000001724_11711cztM0_level2_quad_clean.evt |
| Size (bytes) | 549,613,440 | 71,305,920 |
| Size | 524.2 MB | 68.0 MB |
| Events in quadrant A | 4,490,717 | 430,732 |
| Events in quadrant B | 4,046,223 | 429,011 |
| Events in quadrant C | 3,134,684 | 436,415 |
| Events in quadrant D | 4,535,004 | 411,263 |
| Mode M0 | |||
|---|---|---|---|
| Quadrant | BADHDUFLAG | Total packets | Discarded packets |
| A | 0 | 17690 | 3 |
| B | 0 | 15955 | 2 |
| C | 0 | 13443 | 2 |
| D | 0 | 17826 | 2 |
| Mode SS | |||
|---|---|---|---|
| Quadrant | BADHDUFLAG | Total packets | Discarded packets |
| A | 0 | 132 | 0 |
| B | 0 | 132 | 0 |
| C | 0 | 132 | 0 |
| D | 0 | 132 | 0 |
| Mode M9 | |||
|---|---|---|---|
| Quadrant | BADHDUFLAG | Total packets | Discarded packets |
| A | 0 | 11 | 0 |
| B | 0 | 11 | 0 |
| C | 0 | 11 | 0 |
| D | 0 | 12 | 0 |
| Quadrant | Total seconds | Saturated seconds | Saturation percentage |
|---|---|---|---|
| A | 6460 | 162 | 2.507740% |
| B | 6482 | 235 | 3.625424% |
| C | 6482 | 43 | 0.663376% |
| D | 6458 | 135 | 2.090430% |
Noise dominated data is calculated using 1-second bins in cleaned event files. If a bin has >2000 counts, and if more than 50% of those come from <1% of pixels, then it is considered to be noise-dominated and hence unusable.
| Quadrant | # 1 sec bins | Bins with >0 counts | Bins with >2000 counts | High rate bins dominated by noise | Noise dominated (total time) | Noise dominated (detector-on time) | Marked lightcurve |
|---|---|---|---|---|---|---|---|
| A | 7613 | 6464 | 13 | 13 | 0.17% | 0.20% | 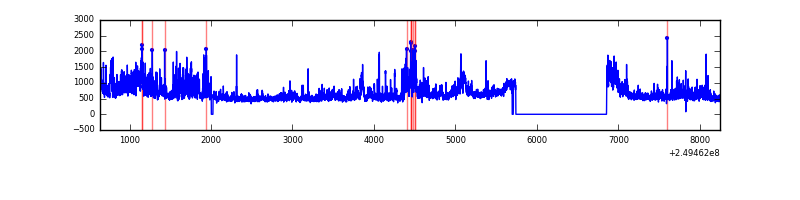 |
| B | 7613 | 6485 | 103 | 103 | 1.35% | 1.59% |  |
| C | 7613 | 6485 | 0 | 0 | 0.00% | 0.00% | 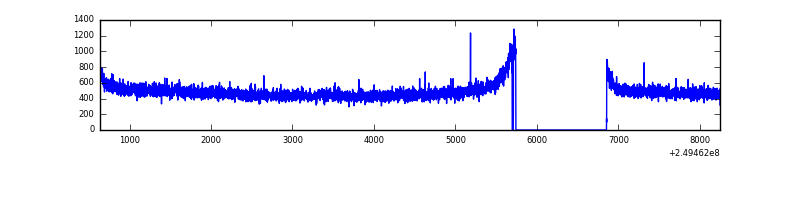 |
| D | 7613 | 6462 | 72 | 72 | 0.95% | 1.11% | 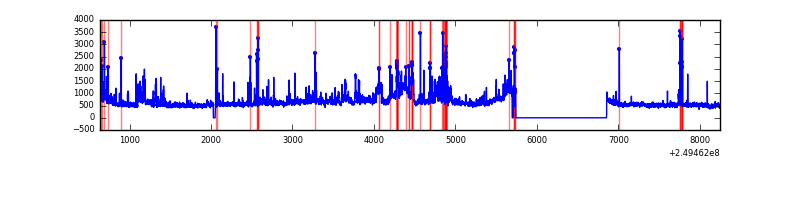 |
Top three noisy pixels from each quadrant. If the there are fewer than three noisy pixels in the level2.evt file, extra rows are filled as -1
| Pixel properties | Quadrant properties | ||||||
|---|---|---|---|---|---|---|---|
| Quadrant | DetID | PixID | Counts | Sigma | Mean | Median | Sigma |
| A | 8 | 15 | 673034 | 4018.02 | 821 | 803 | 167.3 |
| A | 8 | 5 | 377437 | 2251.2 | 821 | 803 | 167.3 |
| A | 1 | 162 | 110747 | 657.15 | 821 | 803 | 167.3 |
| B | 4 | 239 | 628448 | 3998.71 | 825 | 805 | 157.0 |
| B | 15 | 204 | 52170 | 327.25 | 825 | 805 | 157.0 |
| B | 3 | 64 | 47745 | 299.05 | 825 | 805 | 157.0 |
| C | 13 | 61 | 5824 | 27.07 | 802 | 809 | 185.3 |
| C | 12 | 4 | 3408 | 14.03 | 802 | 809 | 185.3 |
| C | 8 | 222 | 2530 | 9.29 | 802 | 809 | 185.3 |
| D | 8 | 195 | 518382 | 2721.31 | 789 | 768 | 190.2 |
| D | 10 | 119 | 502047 | 2635.43 | 789 | 768 | 190.2 |
| D | 7 | 80 | 252180 | 1321.78 | 789 | 768 | 190.2 |
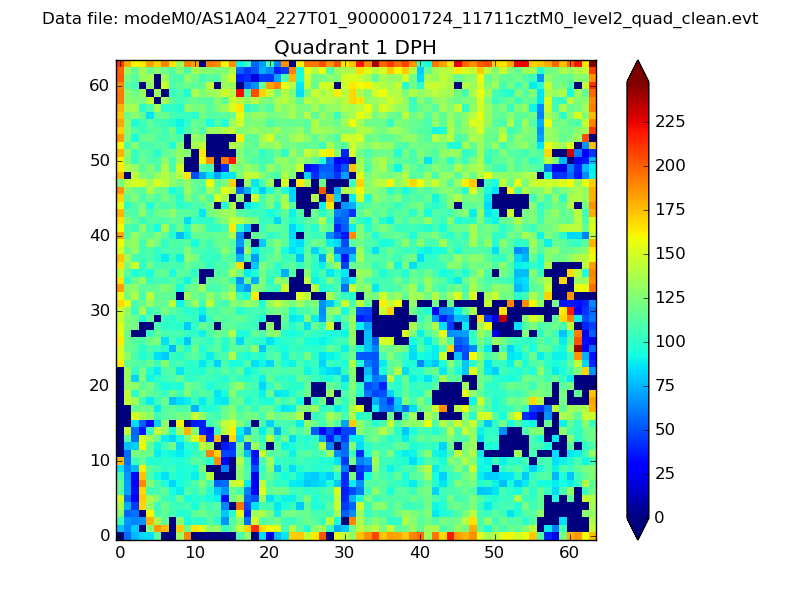
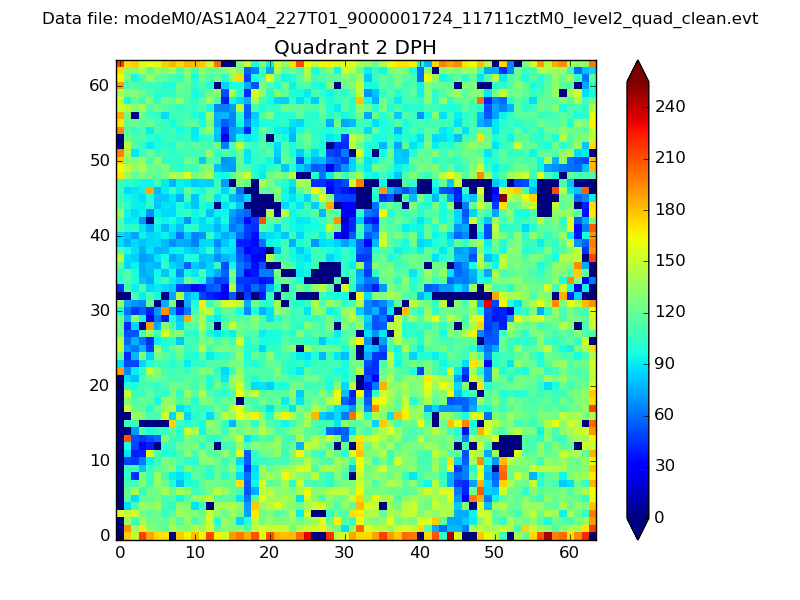
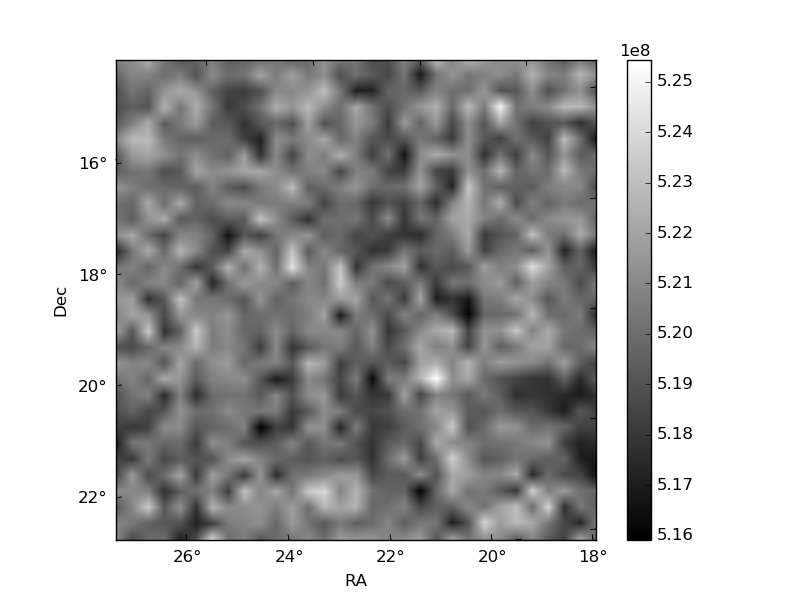
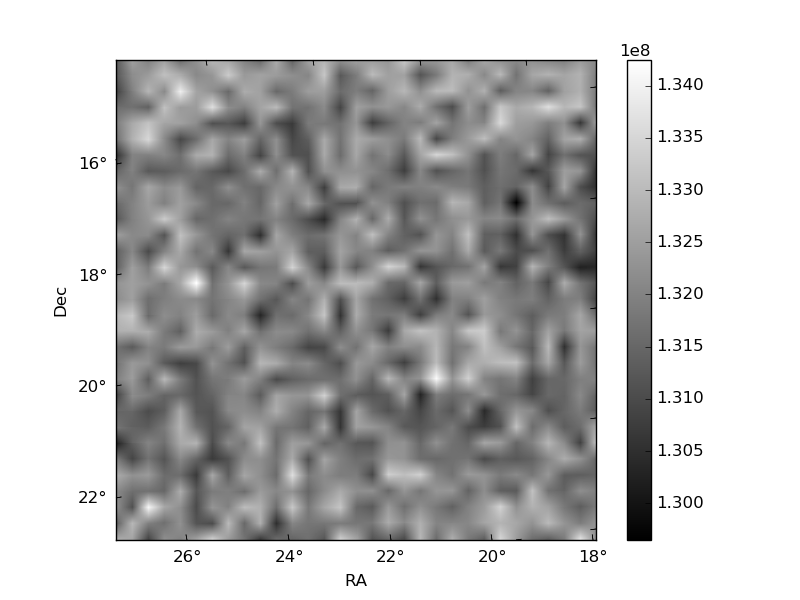
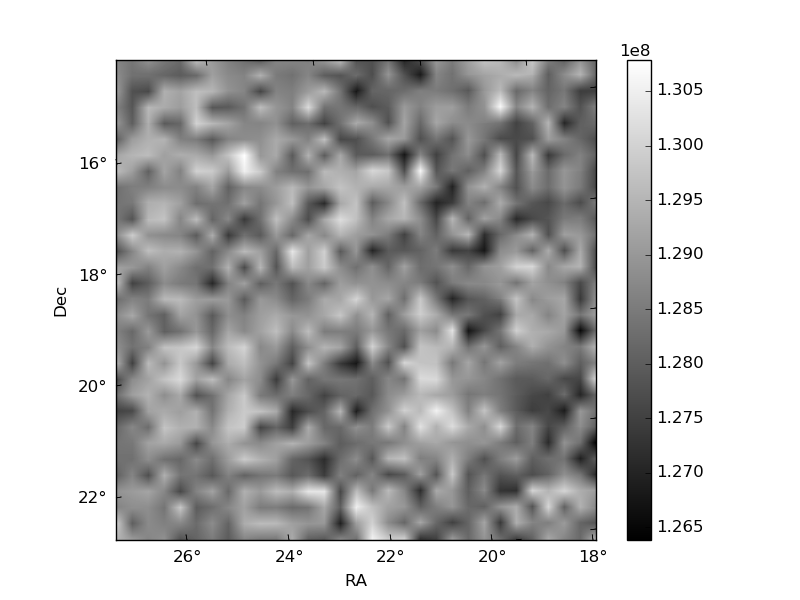
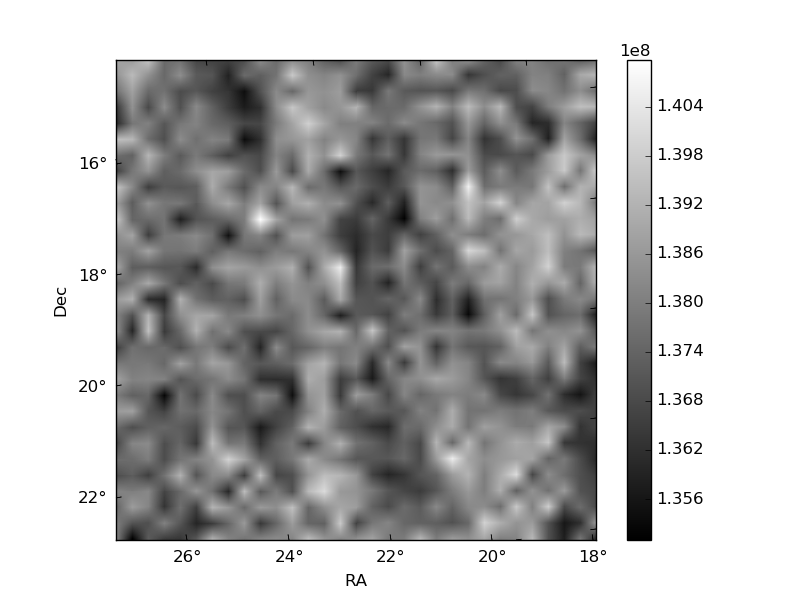
Histogram calculated using DETX and DETY for each event in the final _common_clean file
| Quadrant A | 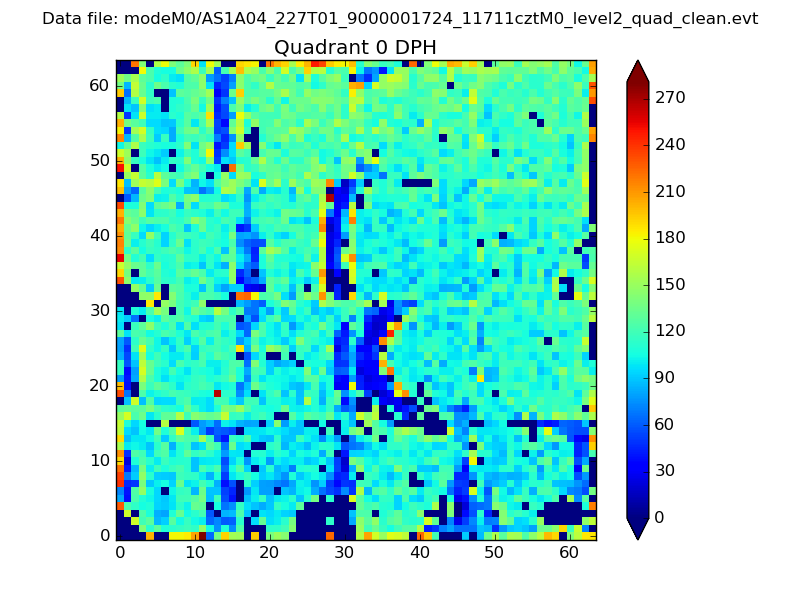 |
 |
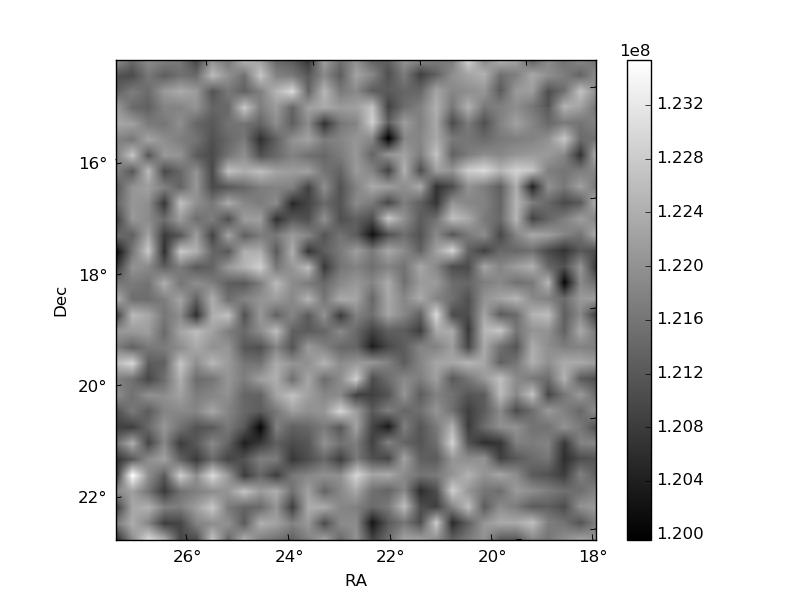
Quadrant B |
|---|---|---|---|
| Quadrant D | 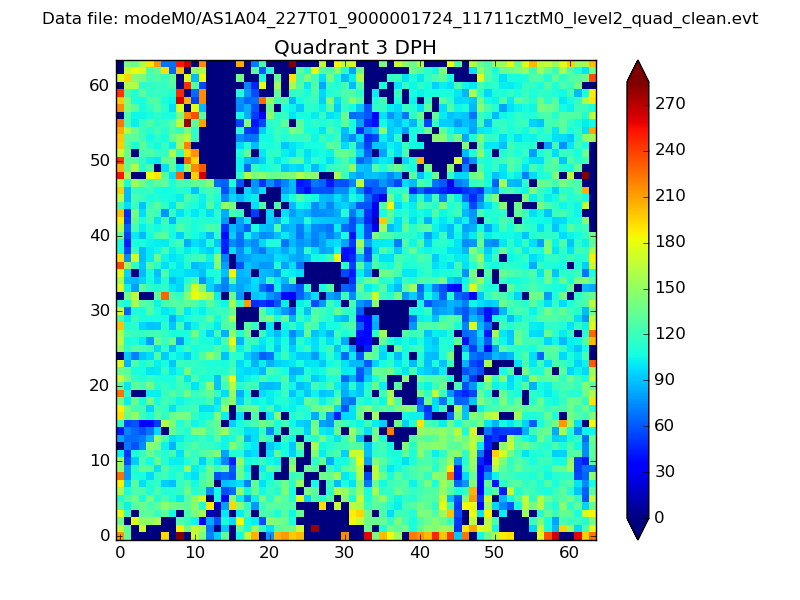 |
 |
Quadrant C |
| Plot type | Count rate plots | Images |
|---|---|---|
| Comparison with Poisson distribution Blue bars denote a histogram of data divided into 1 sec bins. Red curve is a Poisson curve with rate = median count rate of data. |
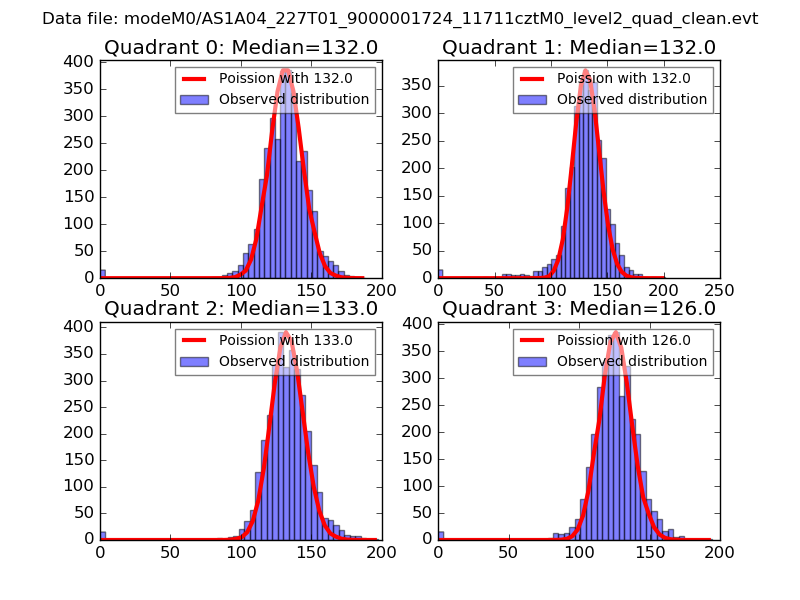 |
 |
| Quadrant-wise count rates Data is divided into 100 sec bins |
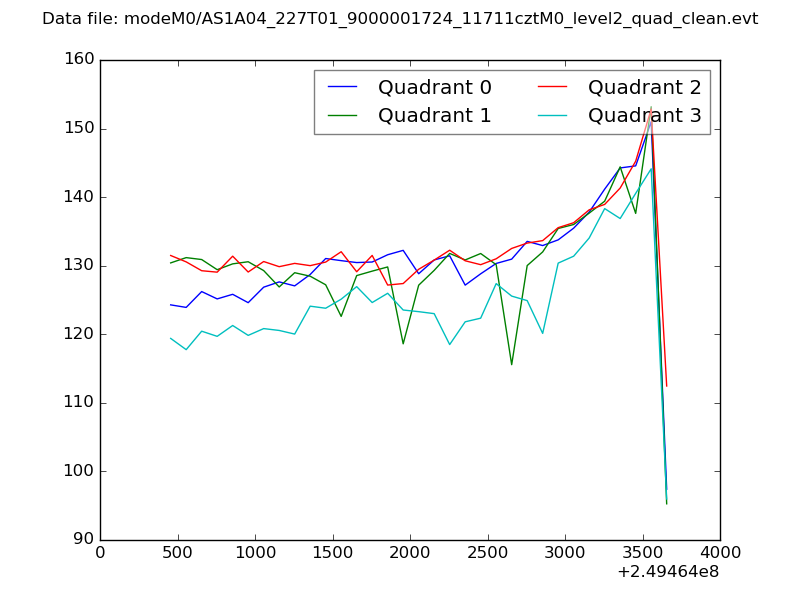 |
|
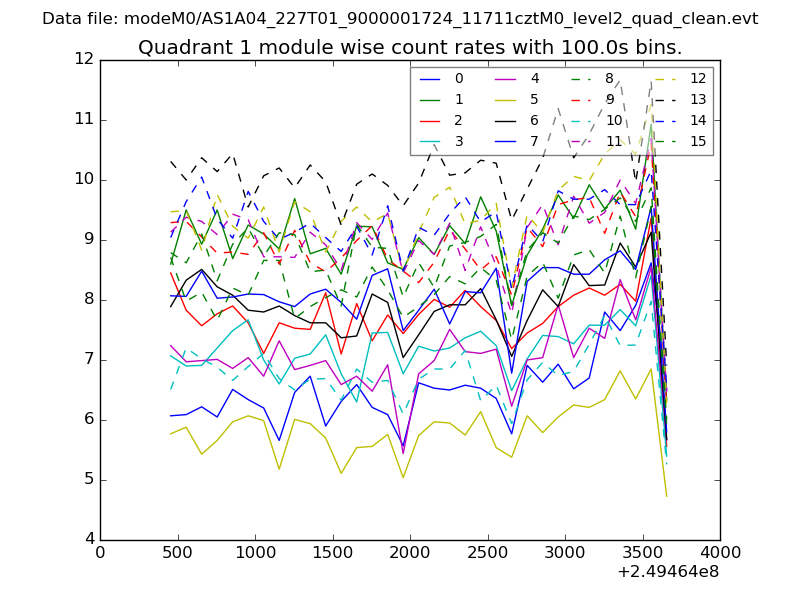
| Module-wise count rates for Quadrant A Data is divided into 100 sec bins |
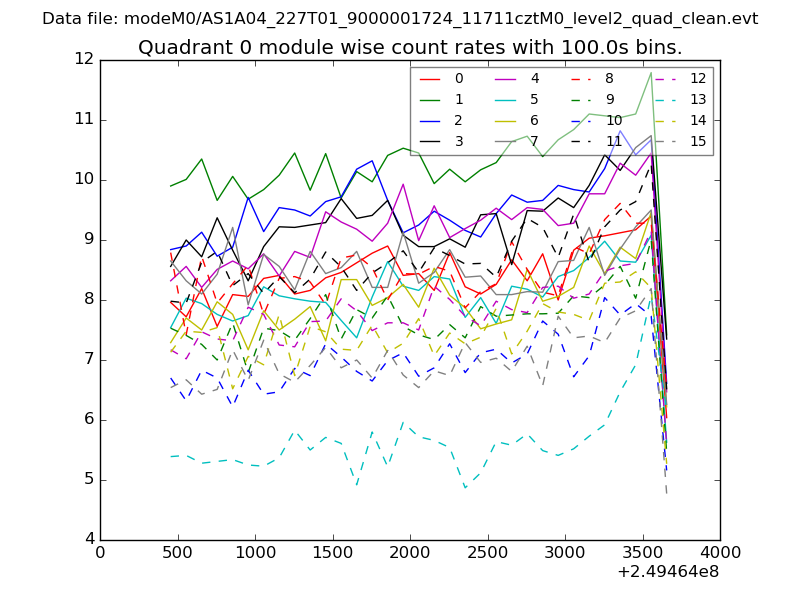 |
 |
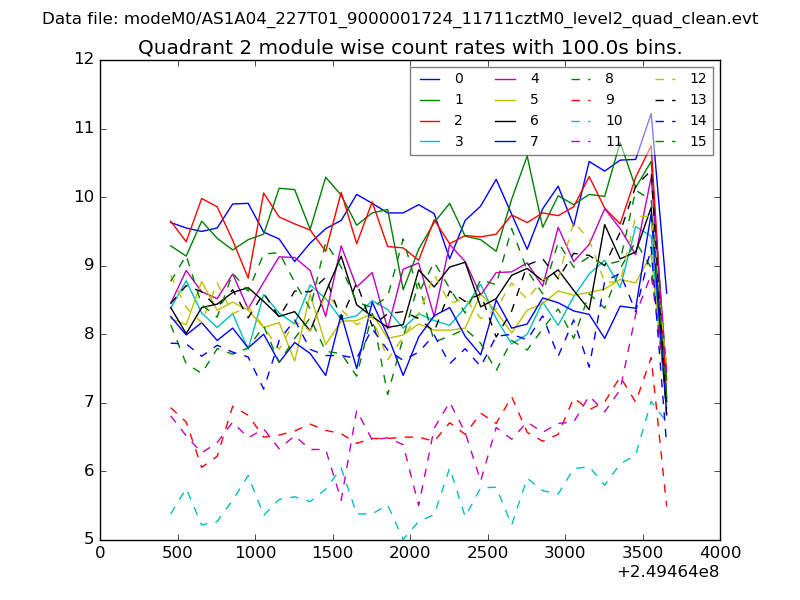
| Module-wise count rates for Quadrant B Data is divided into 100 sec bins |
 |
 |
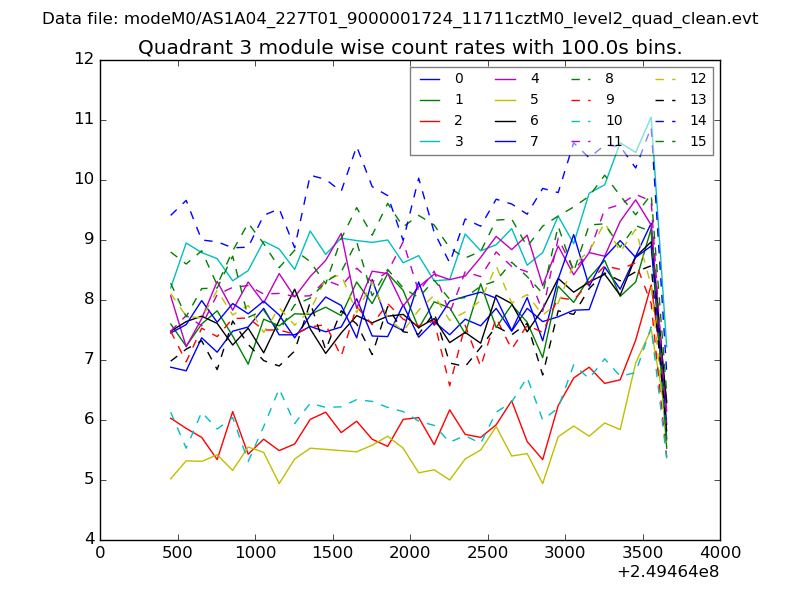
| Module-wise count rates for Quadrant C Data is divided into 100 sec bins |
 |
 |
| Module-wise count rates for Quadrant D Data is divided into 100 sec bins |
 |
 |
| Parameter | Plot |
|---|---|
| CZT HV Monitor | 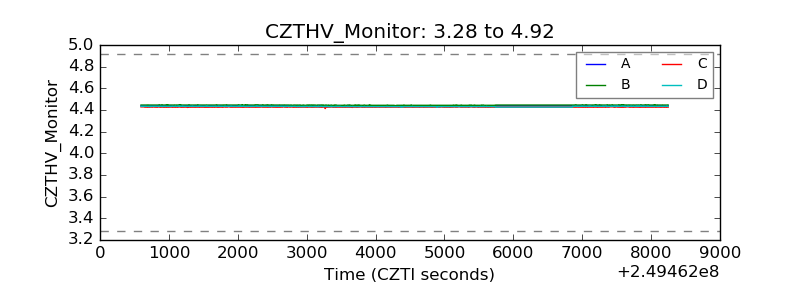 |
| D_VDD | 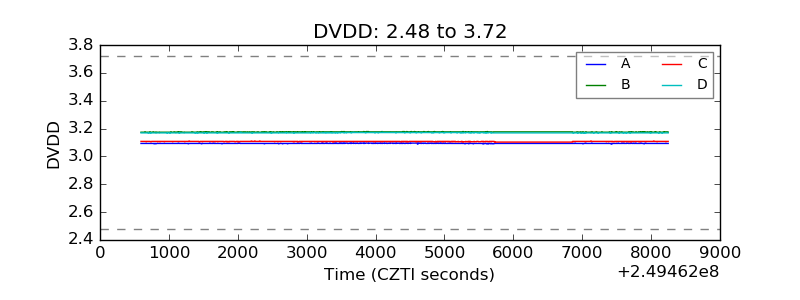 |
| Temperature 1 | 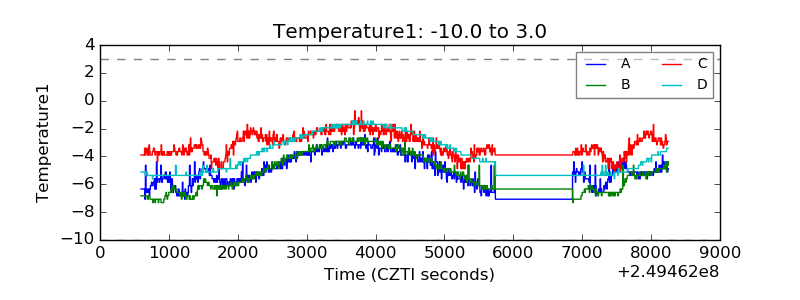 |
| Veto HV Monitor | 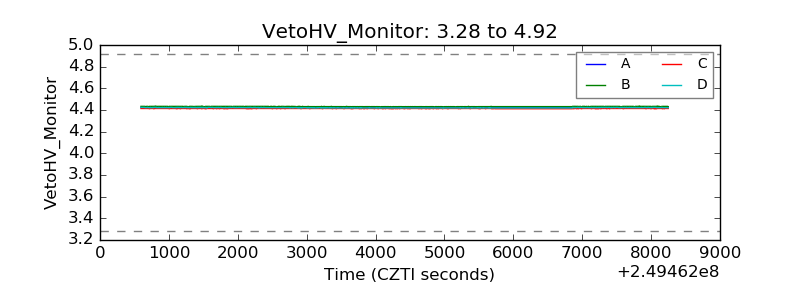 |
| Veto LLD | 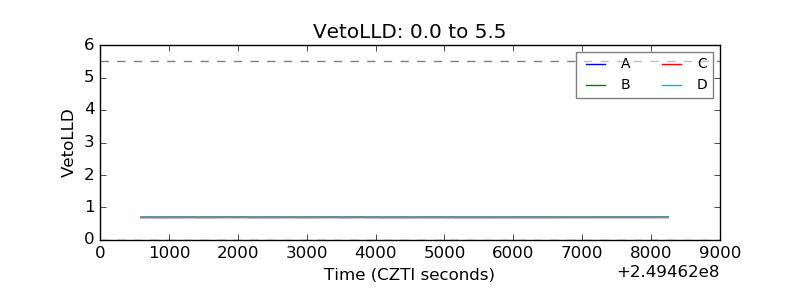 |
| Alpha Counter | 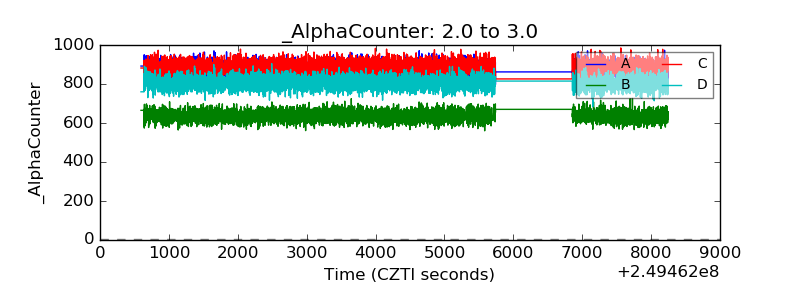 |
| _CPM_Rate | 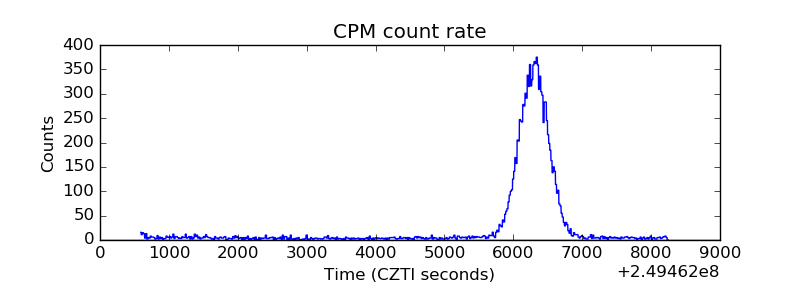 |
| CZT Counter | 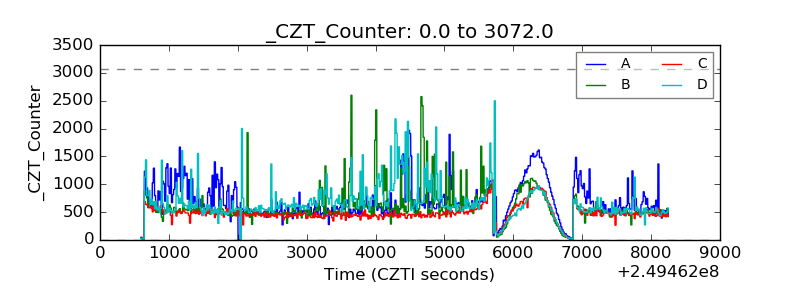 |
| +2.5 Volts monitor |  |
| +5 Volts monitor |  |
| _ROLL_ROT | 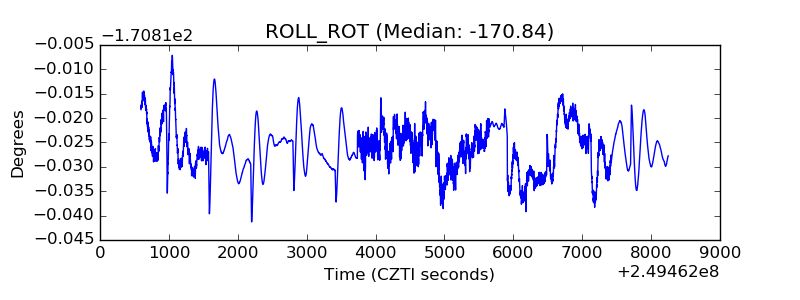 |
| _Roll_DEC | 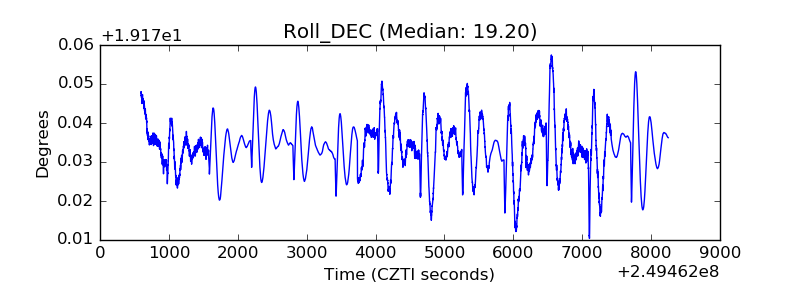 |
| _Roll_RA | 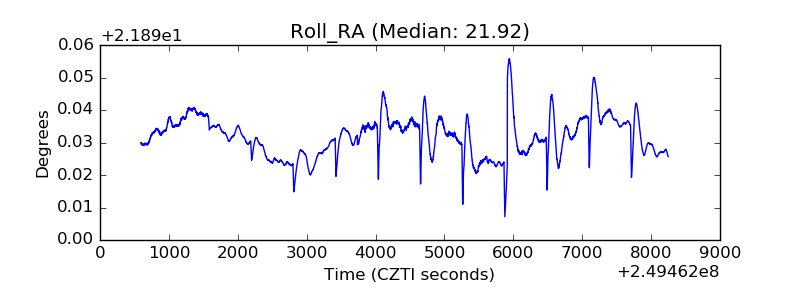 |
| Veto Counter | 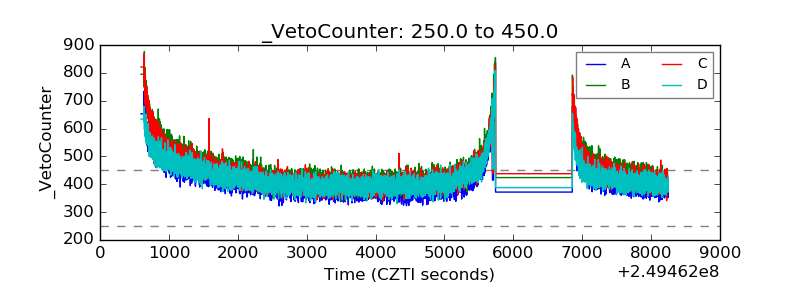 |