| Param | Original file | Final file |
|---|---|---|
| Filename | modeM0/AS1A04_227T01_9000001724_11712cztM0_level2.evt | modeM0/AS1A04_227T01_9000001724_11712cztM0_level2_quad_clean.evt |
| Size (bytes) | 380,983,680 | 65,275,200 |
| Size | 363.3 MB | 62.3 MB |
| Events in quadrant A | 2,783,684 | 415,466 |
| Events in quadrant B | 2,893,944 | 411,876 |
| Events in quadrant C | 2,197,425 | 422,223 |
| Events in quadrant D | 3,339,914 | 393,229 |
| Mode M0 | |||
|---|---|---|---|
| Quadrant | BADHDUFLAG | Total packets | Discarded packets |
| A | 0 | 11268 | 1 |
| B | 0 | 11531 | 1 |
| C | 0 | 9805 | 1 |
| D | 0 | 12839 | 1 |
| Mode SS | |||
|---|---|---|---|
| Quadrant | BADHDUFLAG | Total packets | Discarded packets |
| A | 0 | 98 | 0 |
| B | 0 | 98 | 0 |
| C | 0 | 98 | 0 |
| D | 0 | 98 | 0 |
| Mode M9 | |||
|---|---|---|---|
| Quadrant | BADHDUFLAG | Total packets | Discarded packets |
| A | 0 | 11 | 0 |
| B | 0 | 11 | 0 |
| C | 0 | 11 | 0 |
| D | 0 | 11 | 0 |
| Quadrant | Total seconds | Saturated seconds | Saturation percentage |
|---|---|---|---|
| A | 4747 | 127 | 2.675374% |
| B | 4747 | 215 | 4.529176% |
| C | 4747 | 41 | 0.863703% |
| D | 4747 | 184 | 3.876132% |
Noise dominated data is calculated using 1-second bins in cleaned event files. If a bin has >2000 counts, and if more than 50% of those come from <1% of pixels, then it is considered to be noise-dominated and hence unusable.
| Quadrant | # 1 sec bins | Bins with >0 counts | Bins with >2000 counts | High rate bins dominated by noise | Noise dominated (total time) | Noise dominated (detector-on time) | Marked lightcurve |
|---|---|---|---|---|---|---|---|
| A | 5878 | 4750 | 5 | 5 | 0.09% | 0.11% | 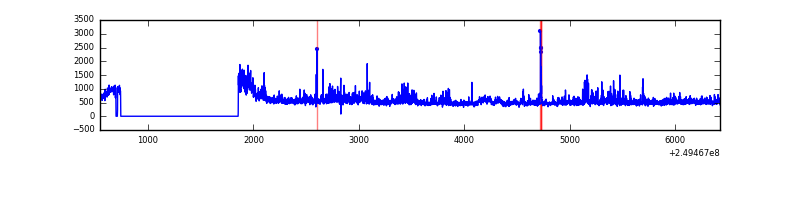 |
| B | 5878 | 4750 | 95 | 95 | 1.62% | 2.00% | 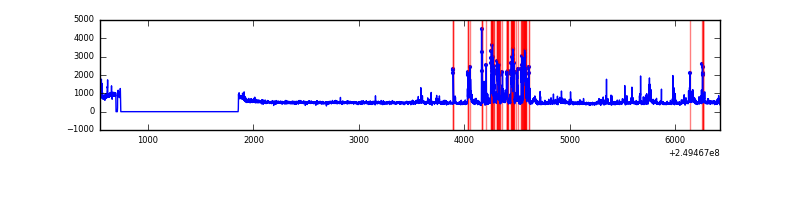 |
| C | 5878 | 4750 | 0 | 0 | 0.00% | 0.00% | 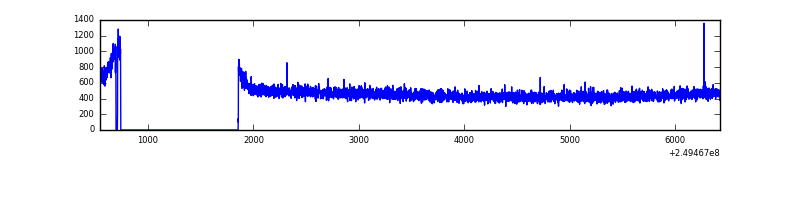 |
| D | 5878 | 4750 | 118 | 118 | 2.01% | 2.48% | 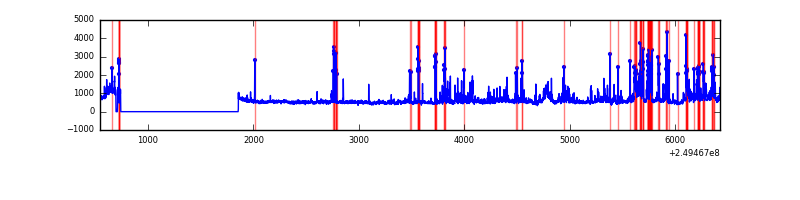 |
Top three noisy pixels from each quadrant. If the there are fewer than three noisy pixels in the level2.evt file, extra rows are filled as -1
| Pixel properties | Quadrant properties | ||||||
|---|---|---|---|---|---|---|---|
| Quadrant | DetID | PixID | Counts | Sigma | Mean | Median | Sigma |
| A | 8 | 15 | 323191 | 2731.18 | 579 | 568 | 118.1 |
| A | 1 | 162 | 73428 | 616.8 | 579 | 568 | 118.1 |
| A | 1 | 178 | 40079 | 334.48 | 579 | 568 | 118.1 |
| B | 4 | 239 | 512717 | 4543.49 | 574 | 560 | 112.7 |
| B | 15 | 204 | 33229 | 289.82 | 574 | 560 | 112.7 |
| B | 3 | 64 | 28359 | 246.61 | 574 | 560 | 112.7 |
| C | 13 | 61 | 4171 | 27.37 | 563 | 567 | 131.7 |
| C | 14 | 234 | 2649 | 15.81 | 563 | 567 | 131.7 |
| C | 8 | 222 | 1784 | 9.24 | 563 | 567 | 131.7 |
| D | 8 | 195 | 367994 | 2701.63 | 555 | 538 | 136.0 |
| D | 7 | 80 | 365680 | 2684.61 | 555 | 538 | 136.0 |
| D | 4 | 95 | 245807 | 1803.28 | 555 | 538 | 136.0 |
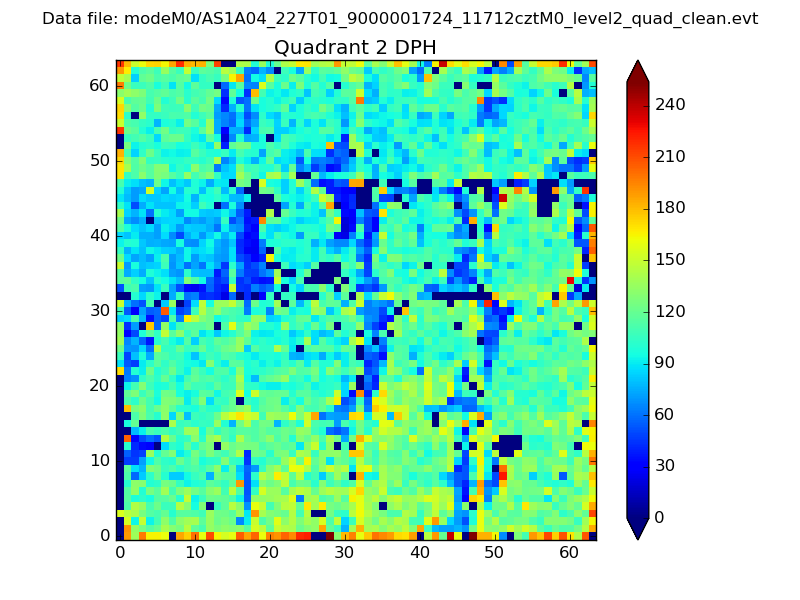
Histogram calculated using DETX and DETY for each event in the final _common_clean file
| Quadrant A | 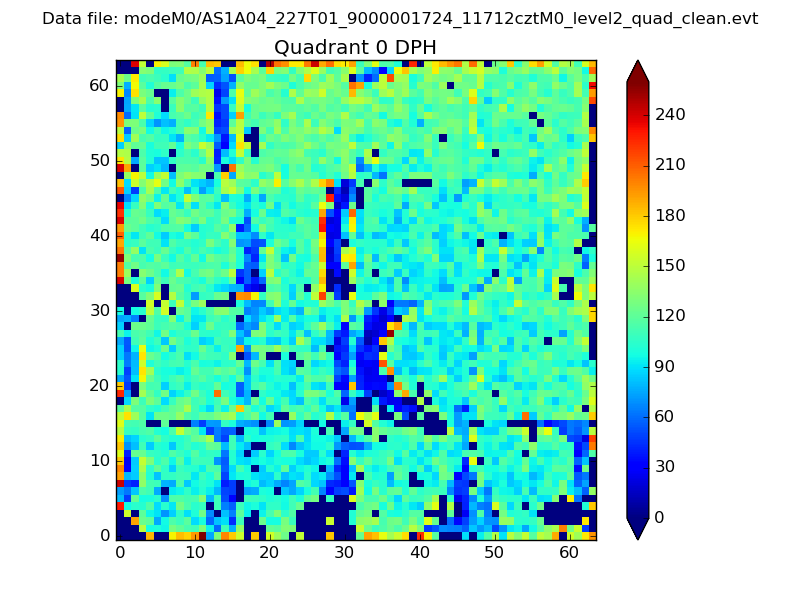 |
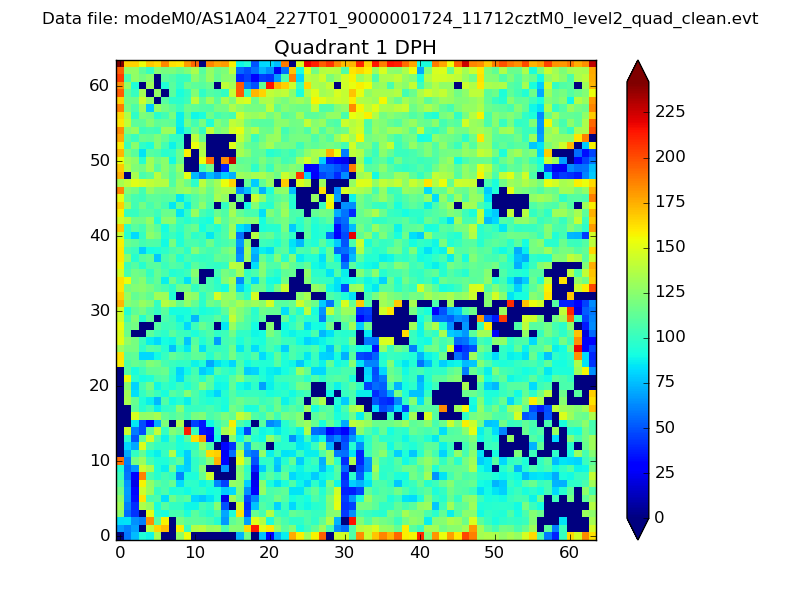 |
Quadrant B |
|---|---|---|---|
| Quadrant D | 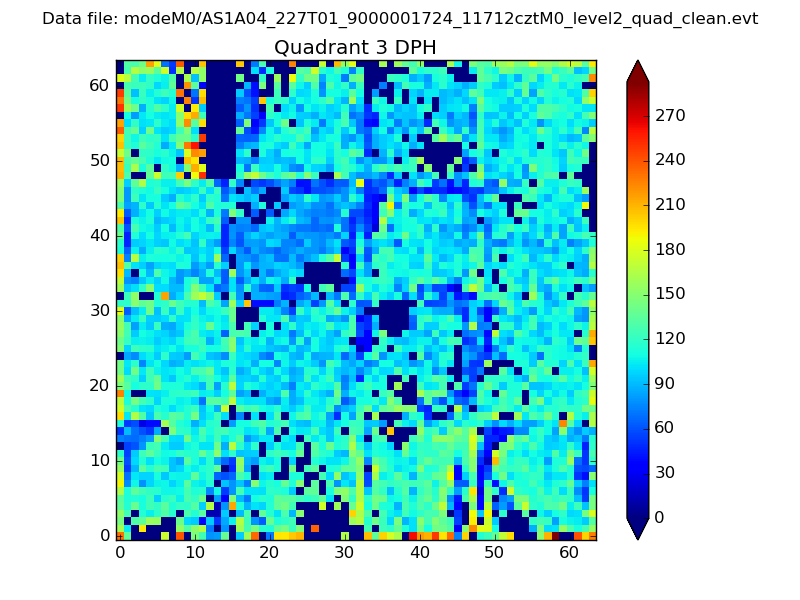 |
 |
Quadrant C |
| Plot type | Count rate plots | Images |
|---|---|---|
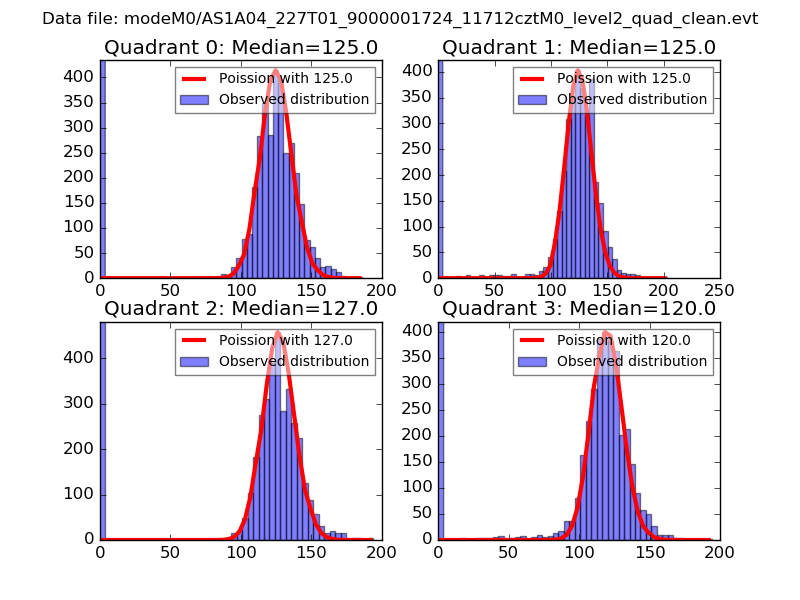
| Comparison with Poisson distribution Blue bars denote a histogram of data divided into 1 sec bins. Red curve is a Poisson curve with rate = median count rate of data. |
 |
 |
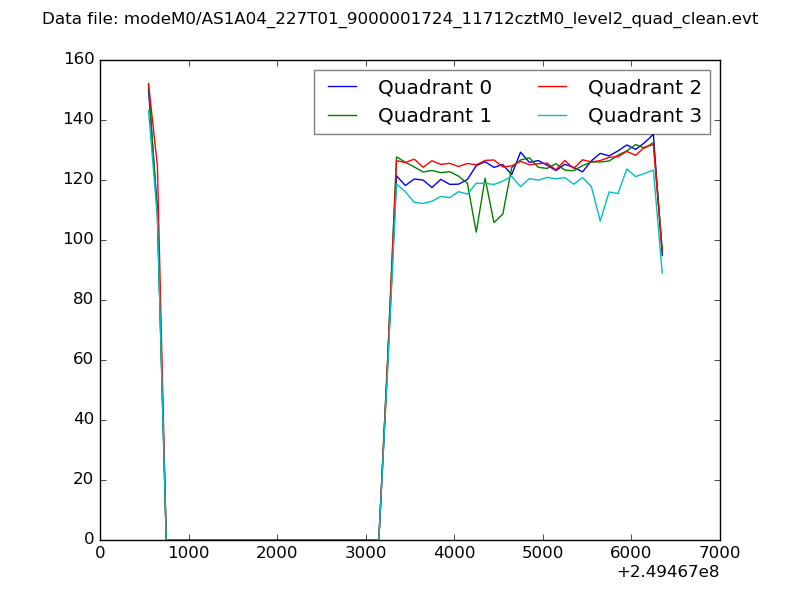
| Quadrant-wise count rates Data is divided into 100 sec bins |
 |
|
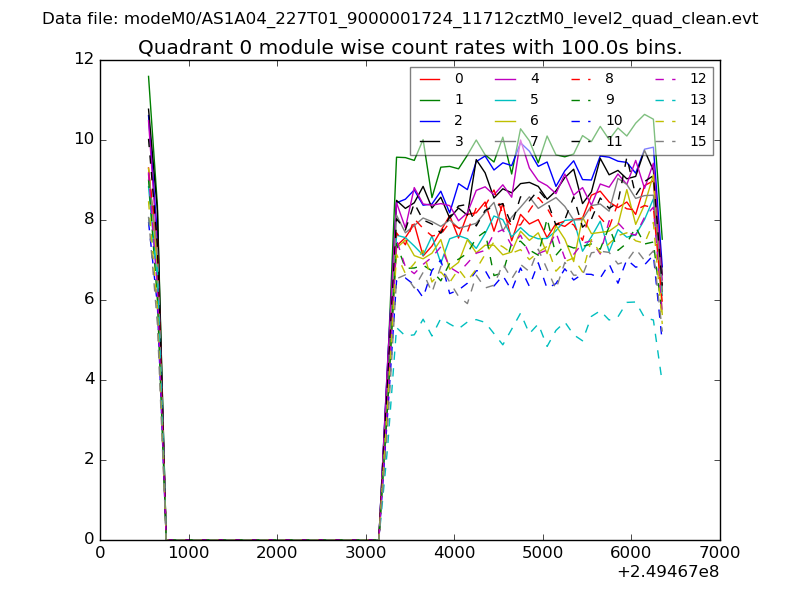
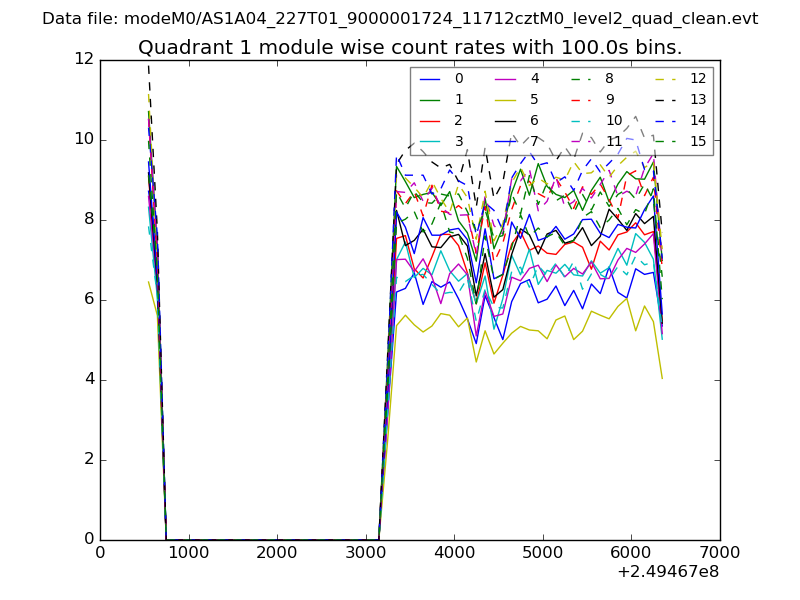
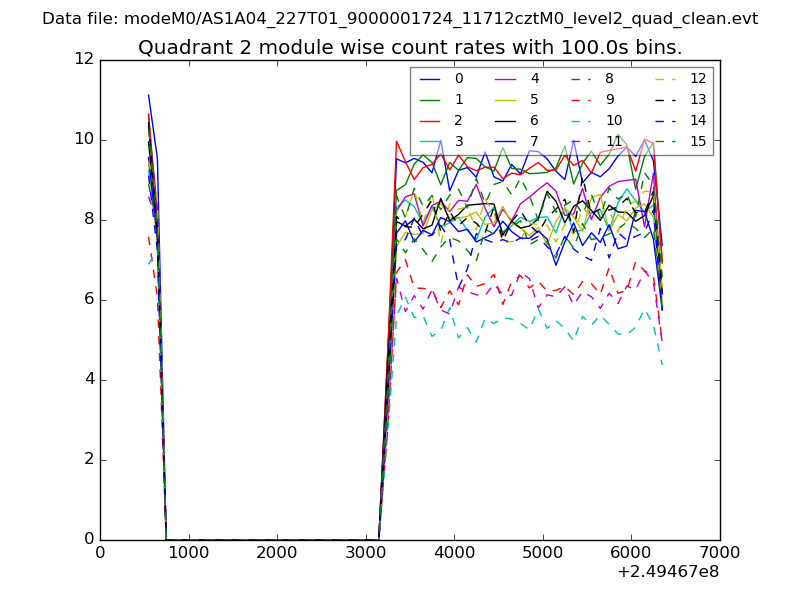
| Module-wise count rates for Quadrant A Data is divided into 100 sec bins |
 |
 |
| Module-wise count rates for Quadrant B Data is divided into 100 sec bins |
 |
 |
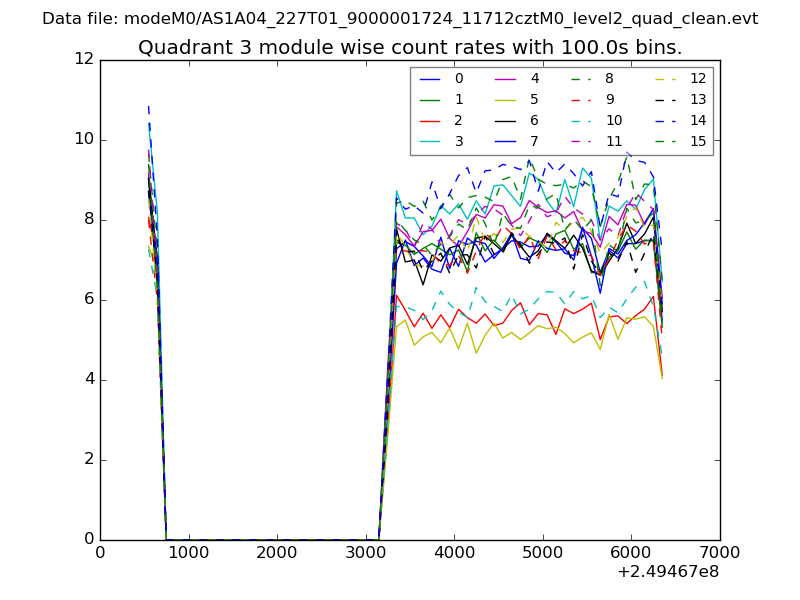
| Module-wise count rates for Quadrant C Data is divided into 100 sec bins |
 |
 |
| Module-wise count rates for Quadrant D Data is divided into 100 sec bins |
 |
 |
| Parameter | Plot |
|---|---|
| CZT HV Monitor | 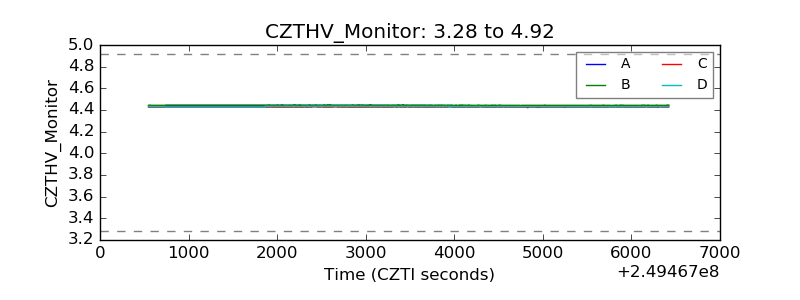 |
| D_VDD | 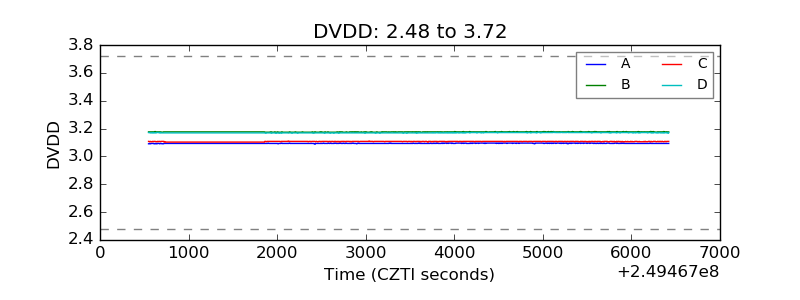 |
| Temperature 1 | 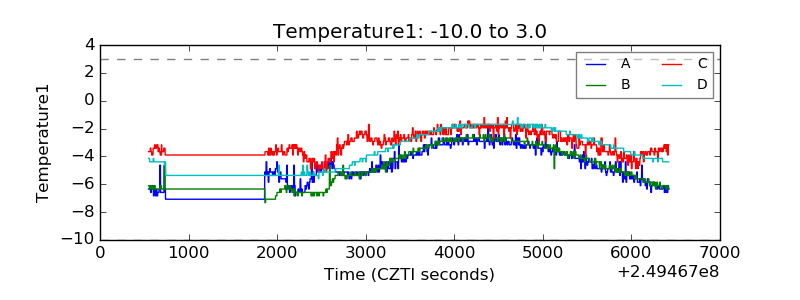 |
| Veto HV Monitor | 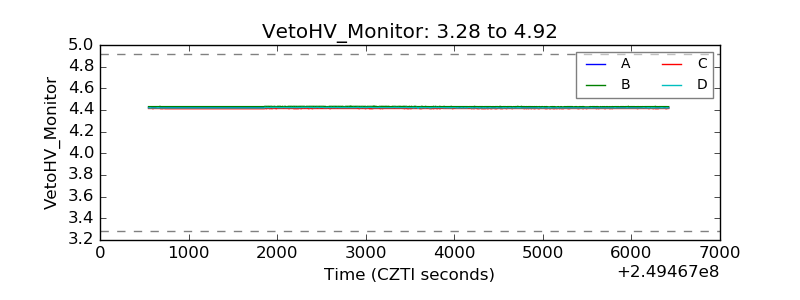 |
| Veto LLD | 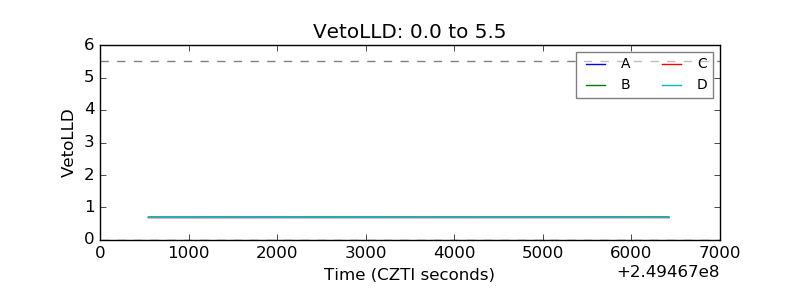 |
| Alpha Counter | 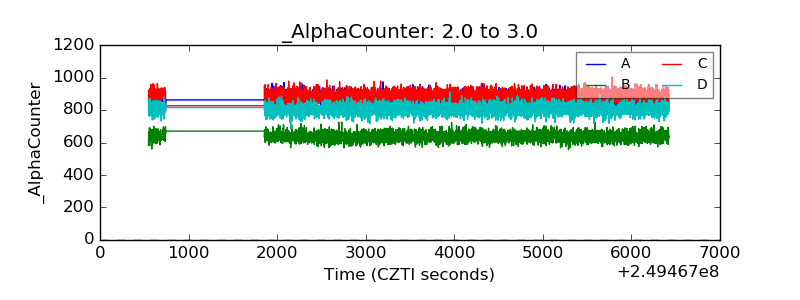 |
| _CPM_Rate | 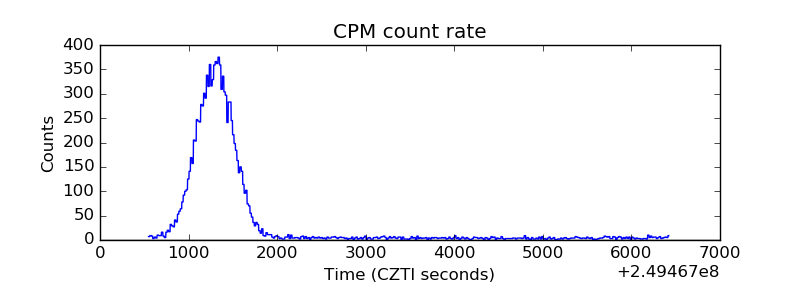 |
| CZT Counter | 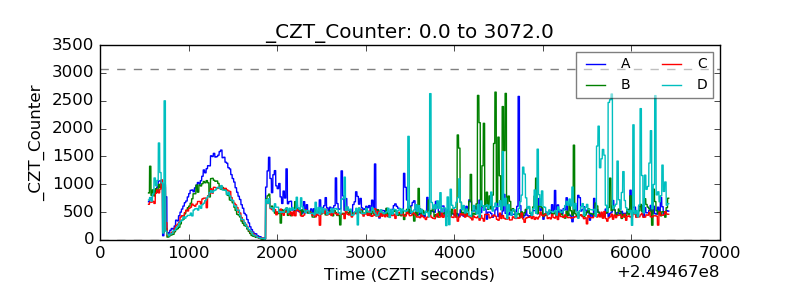 |
| +2.5 Volts monitor |  |
| +5 Volts monitor |  |
| _ROLL_ROT | 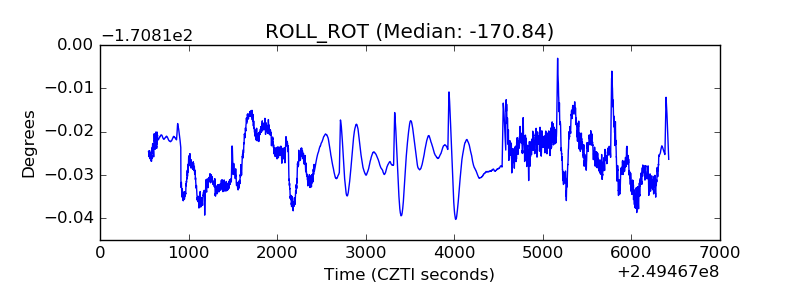 |
| _Roll_DEC | 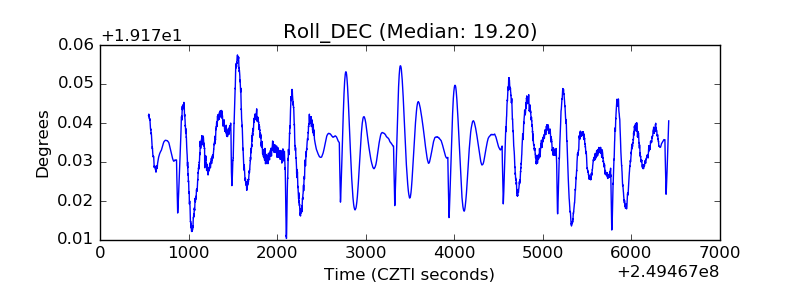 |
| _Roll_RA | 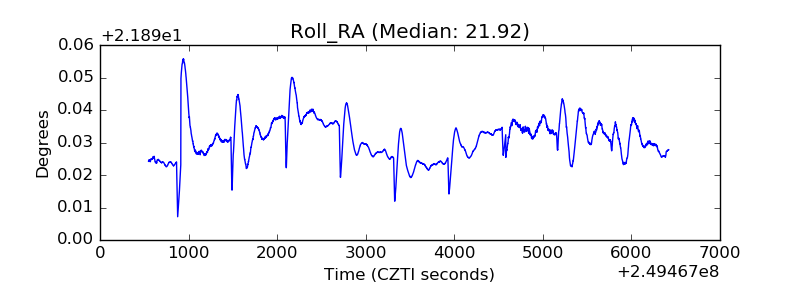 |
| Veto Counter | 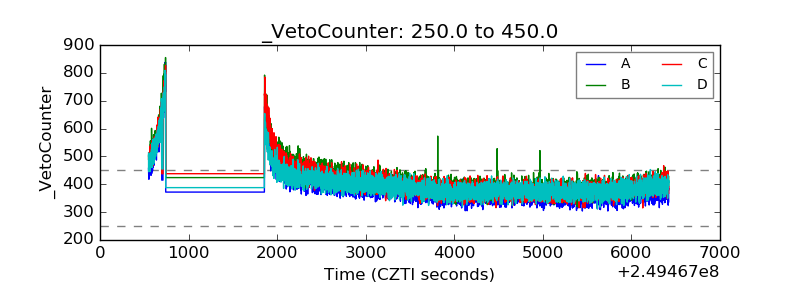 |