| Param | Original file | Final file |
|---|---|---|
| Filename | modeM0/AS1G08_075T01_9000001726cztM0_level2.fits | modeM0/AS1G08_075T01_9000001726cztM0_level2_quad_clean.evt |
| Size (bytes) | 413,873,280 | 412,151,040 |
| Size | 394.7 MB | 393.1 MB |
| Events in quadrant A | 2,466,364 | 2,456,330 |
| Events in quadrant B | 2,388,718 | 2,406,641 |
| Events in quadrant C | 2,453,626 | 2,356,684 |
| Events in quadrant D | 2,114,018 | 2,151,656 |
| Mode M0 | |||
|---|---|---|---|
| Quadrant | BADHDUFLAG | Total packets | Discarded packets |
| A | 0 | 116764 | 0 |
| B | 0 | 107785 | 0 |
| C | 0 | 92756 | 0 |
| D | 0 | 107342 | 0 |
| Mode M9 | |||
|---|---|---|---|
| Quadrant | BADHDUFLAG | Total packets | Discarded packets |
| A | 0 | 45 | 0 |
| B | 0 | 45 | 0 |
| C | 0 | 45 | 0 |
| D | 0 | 45 | 0 |
| Mode SS | |||
|---|---|---|---|
| Quadrant | BADHDUFLAG | Total packets | Discarded packets |
| A | 0 | 924 | 0 |
| B | 0 | 924 | 0 |
| C | 0 | 924 | 0 |
| D | 0 | 924 | 0 |
| Quadrant | Total seconds | Saturated seconds | Saturation percentage |
|---|---|---|---|
| A | 45307 | 1005 | 2.218200% |
| B | 45307 | 1612 | 3.557949% |
| C | 45307 | 275 | 0.606970% |
| D | 45307 | 1081 | 2.385945% |
Noise dominated data is calculated using 1-second bins in cleaned event files. If a bin has >2000 counts, and if more than 50% of those come from <1% of pixels, then it is considered to be noise-dominated and hence unusable.
| Quadrant | # 1 sec bins | Bins with >0 counts | Bins with >2000 counts | High rate bins dominated by noise | Noise dominated (total time) | Noise dominated (detector-on time) | Marked lightcurve |
|---|---|---|---|---|---|---|---|
| A | 49847 | 45308 | 0 | 0 | 0.00% | 0.00% | 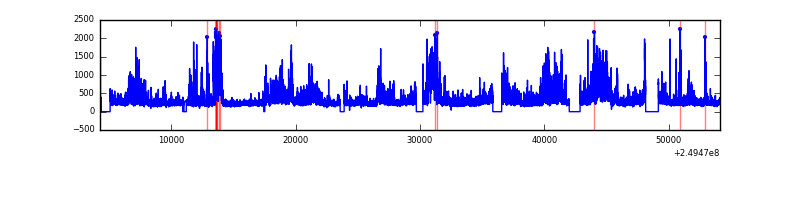 |
| B | 49847 | 45303 | 0 | 0 | 0.00% | 0.00% |  |
| C | 49847 | 45307 | 0 | 0 | 0.00% | 0.00% |  |
| D | 49847 | 45297 | 0 | 0 | 0.00% | 0.00% |  |
Top three noisy pixels from each quadrant. If the there are fewer than three noisy pixels in the level2.evt file, extra rows are filled as -1
| Pixel properties | Quadrant properties | ||||||
|---|---|---|---|---|---|---|---|
| Quadrant | DetID | PixID | Counts | Sigma | Mean | Median | Sigma |
| A | 14 | 188 | 2515 | 11.85 | 641 | 599 | 161.7 |
| A | 0 | 29 | 2365 | 10.92 | 641 | 599 | 161.7 |
| A | 14 | 204 | 2010 | 8.73 | 641 | 599 | 161.7 |
| B | 2 | 9 | 2062 | 11.53 | 628 | 595 | 127.2 |
| B | 3 | 17 | 1660 | 8.37 | 628 | 595 | 127.2 |
| B | 14 | 254 | 1555 | 7.55 | 628 | 595 | 127.2 |
| C | 12 | 241 | 1806 | 7.08 | 648 | 599 | 170.4 |
| C | 3 | 158 | 1718 | 6.57 | 648 | 599 | 170.4 |
| C | 7 | 111 | 1657 | 6.21 | 648 | 599 | 170.4 |
| D | 3 | 14 | 1590 | 6.41 | 601 | 544 | 163.3 |
| D | 1 | 3 | 1504 | 5.88 | 601 | 544 | 163.3 |
| D | 6 | 231 | 1487 | 5.77 | 601 | 544 | 163.3 |
Histogram calculated using DETX and DETY for each event in the final _common_clean file
| Quadrant A |  |
 |
Quadrant B |
|---|---|---|---|
| Quadrant D |  |
 |
Quadrant C |
| Plot type | Count rate plots | Images |
|---|---|---|
| Comparison with Poisson distribution Blue bars denote a histogram of data divided into 1 sec bins. Red curve is a Poisson curve with rate = median count rate of data. |
 |
 |
| Quadrant-wise count rates Data is divided into 100 sec bins |
 |
|
| Module-wise count rates for Quadrant A Data is divided into 100 sec bins |
 |
 |
| Module-wise count rates for Quadrant B Data is divided into 100 sec bins |
 |
 |
| Module-wise count rates for Quadrant C Data is divided into 100 sec bins |
 |
 |
| Module-wise count rates for Quadrant D Data is divided into 100 sec bins |
 |
 |
| Parameter | Plot |
|---|---|
| CZT HV Monitor |  |
| D_VDD |  |
| Temperature 1 |  |
| Veto HV Monitor |  |
| Veto LLD |  |
| Alpha Counter |  |
| _CPM_Rate |  |
| CZT Counter |  |
| +2.5 Volts monitor |  |
| +5 Volts monitor |  |
| _ROLL_ROT |  |
| _Roll_DEC |  |
| _Roll_RA |  |
| Veto Counter |  |