| Param | Original file | Final file |
|---|---|---|
| Filename | modeM0/AS1G08_075T01_9000001726_11712cztM0_level2.evt | modeM0/AS1G08_075T01_9000001726_11712cztM0_level2_quad_clean.evt |
| Size (bytes) | 120,438,720 | 28,503,360 |
| Size | 114.9 MB | 27.2 MB |
| Events in quadrant A | 983,284 | 189,240 |
| Events in quadrant B | 915,038 | 191,461 |
| Events in quadrant C | 744,105 | 187,379 |
| Events in quadrant D | 896,129 | 179,158 |
| Mode M0 | |||
|---|---|---|---|
| Quadrant | BADHDUFLAG | Total packets | Discarded packets |
| A | 0 | 3973 | 2 |
| B | 0 | 3666 | 1 |
| C | 0 | 3298 | 1 |
| D | 0 | 3658 | 1 |
| Mode M9 | |||
|---|---|---|---|
| Quadrant | BADHDUFLAG | Total packets | Discarded packets |
| A | 0 | 7 | 0 |
| B | 0 | 7 | 0 |
| C | 0 | 7 | 0 |
| D | 0 | 7 | 0 |
| Mode SS | |||
|---|---|---|---|
| Quadrant | BADHDUFLAG | Total packets | Discarded packets |
| A | 0 | 34 | 0 |
| B | 0 | 34 | 0 |
| C | 0 | 34 | 0 |
| D | 0 | 34 | 0 |
| Quadrant | Total seconds | Saturated seconds | Saturation percentage |
|---|---|---|---|
| A | 1560 | 83 | 5.320513% |
| B | 1560 | 82 | 5.256410% |
| C | 1560 | 47 | 3.012821% |
| D | 1560 | 85 | 5.448718% |
Noise dominated data is calculated using 1-second bins in cleaned event files. If a bin has >2000 counts, and if more than 50% of those come from <1% of pixels, then it is considered to be noise-dominated and hence unusable.
| Quadrant | # 1 sec bins | Bins with >0 counts | Bins with >2000 counts | High rate bins dominated by noise | Noise dominated (total time) | Noise dominated (detector-on time) | Marked lightcurve |
|---|---|---|---|---|---|---|---|
| A | 2306 | 1563 | 1 | 1 | 0.04% | 0.06% | 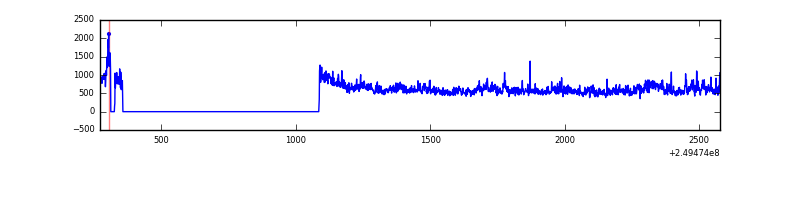 |
| B | 2306 | 1563 | 5 | 5 | 0.22% | 0.32% | 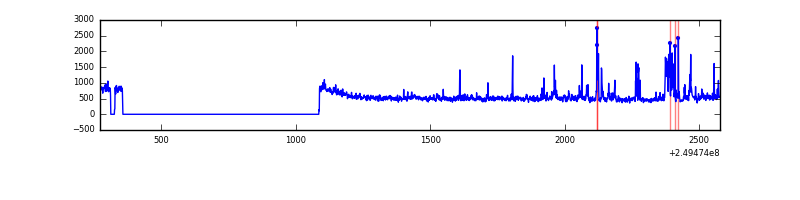 |
| C | 2306 | 1563 | 0 | 0 | 0.00% | 0.00% | 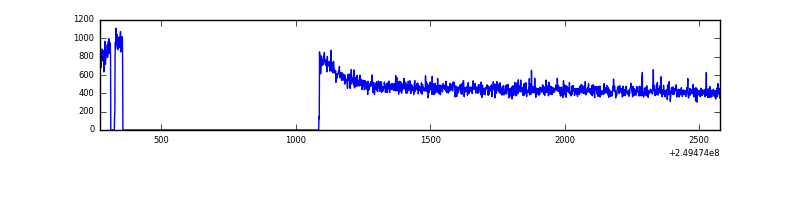 |
| D | 2306 | 1563 | 6 | 6 | 0.26% | 0.38% | 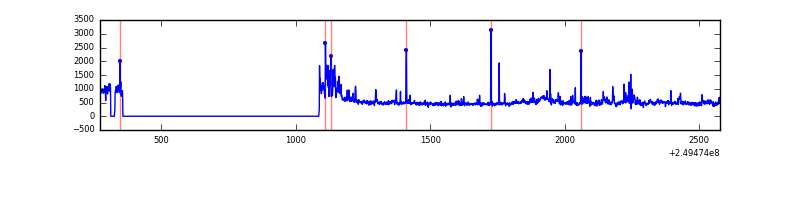 |
Top three noisy pixels from each quadrant. If the there are fewer than three noisy pixels in the level2.evt file, extra rows are filled as -1
| Pixel properties | Quadrant properties | ||||||
|---|---|---|---|---|---|---|---|
| Quadrant | DetID | PixID | Counts | Sigma | Mean | Median | Sigma |
| A | 8 | 15 | 132983 | 3078.01 | 201 | 196 | 43.1 |
| A | 1 | 162 | 23038 | 529.48 | 201 | 196 | 43.1 |
| A | 15 | 174 | 15967 | 365.57 | 201 | 196 | 43.1 |
| B | 4 | 239 | 92074 | 2229.76 | 199 | 194 | 41.2 |
| B | 15 | 204 | 18220 | 437.46 | 199 | 194 | 41.2 |
| B | 0 | 214 | 10401 | 247.7 | 199 | 194 | 41.2 |
| C | 13 | 61 | 1371 | 25.28 | 190 | 191 | 46.7 |
| C | 3 | 202 | 444 | 5.42 | 190 | 191 | 46.7 |
| C | 8 | 222 | 429 | 5.1 | 190 | 191 | 46.7 |
| D | 1 | 52 | 77223 | 1592.29 | 192 | 186 | 48.4 |
| D | 8 | 195 | 33275 | 683.92 | 192 | 186 | 48.4 |
| D | 4 | 95 | 17372 | 355.22 | 192 | 186 | 48.4 |
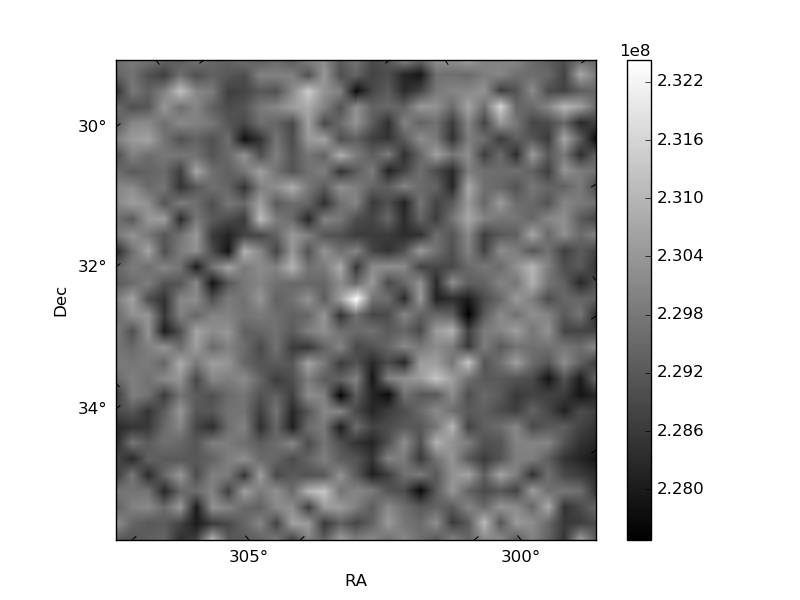
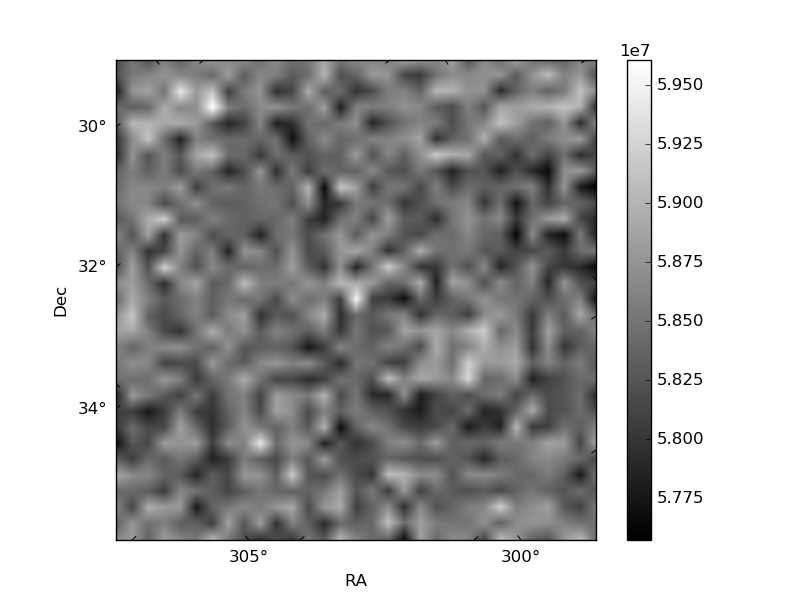
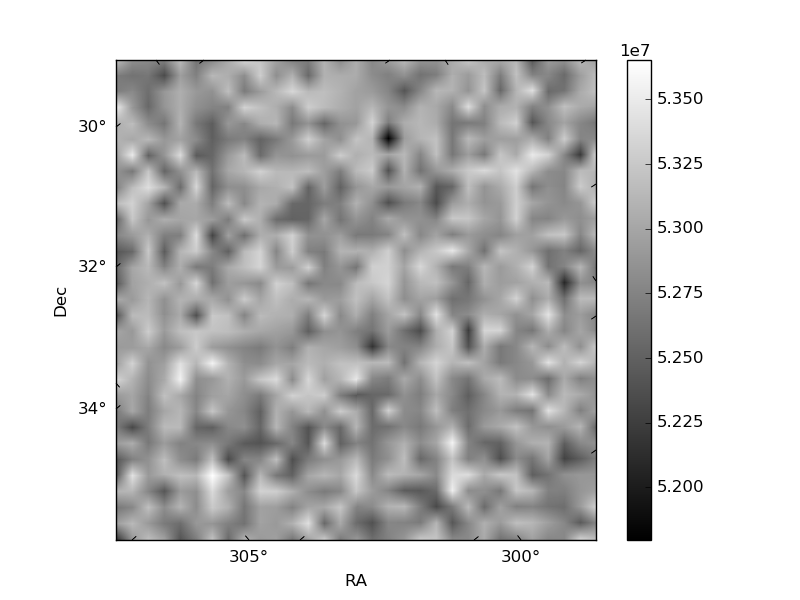
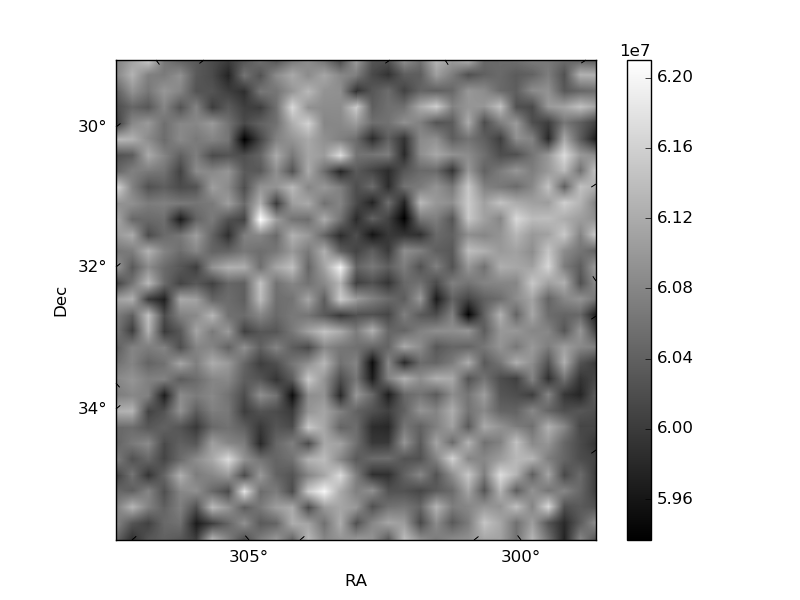
Histogram calculated using DETX and DETY for each event in the final _common_clean file
| Quadrant A | 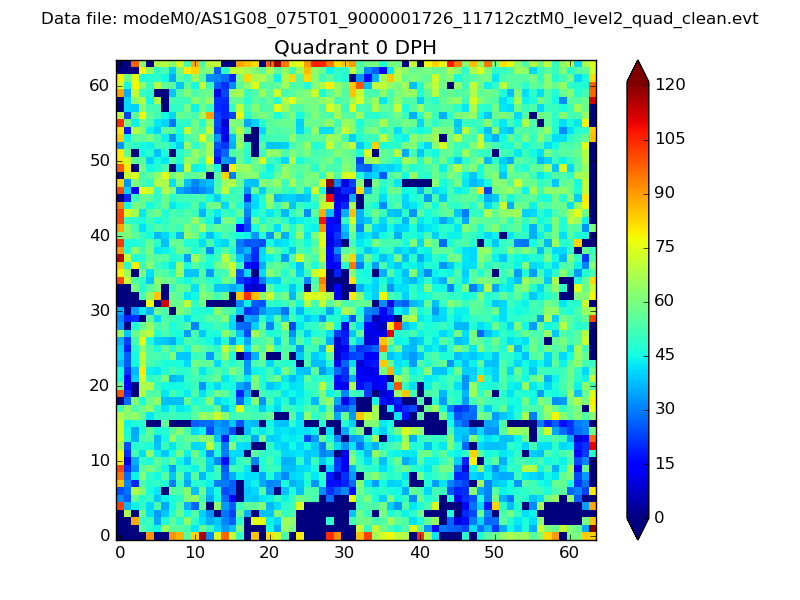 |
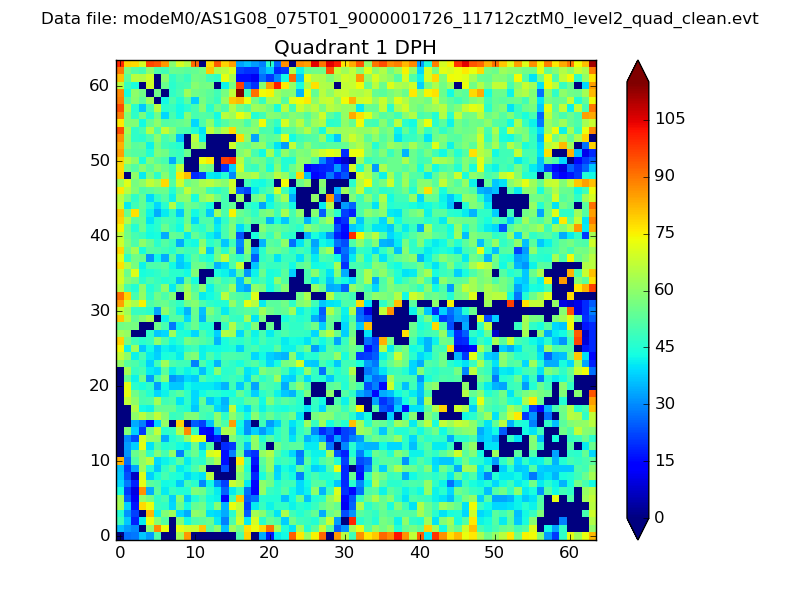 |
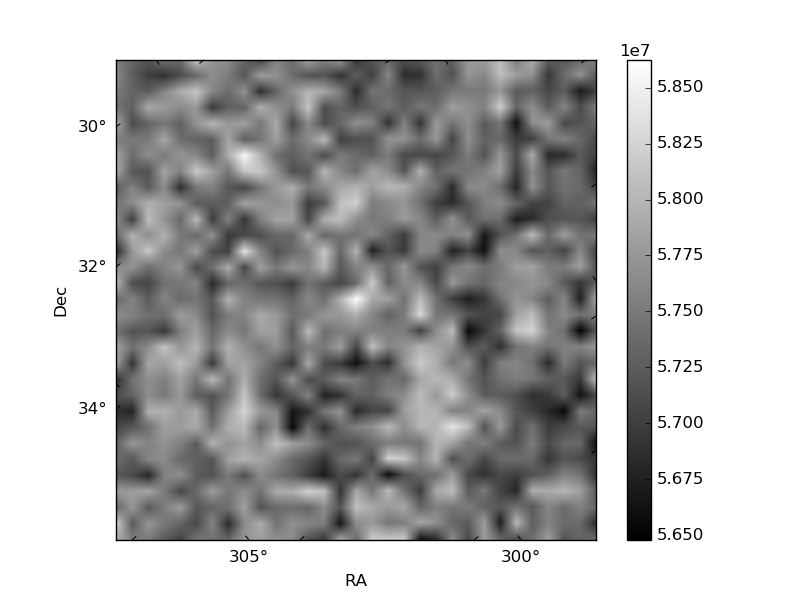
Quadrant B |
|---|---|---|---|
| Quadrant D | 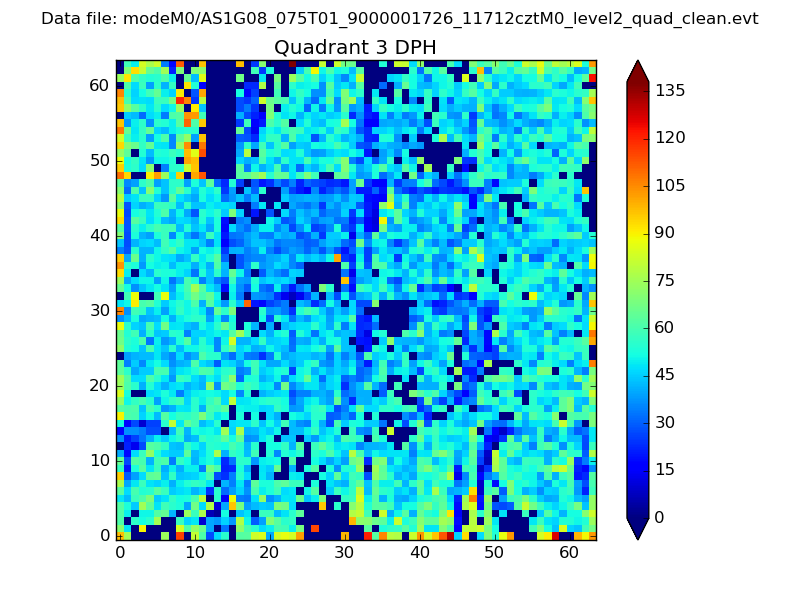 |
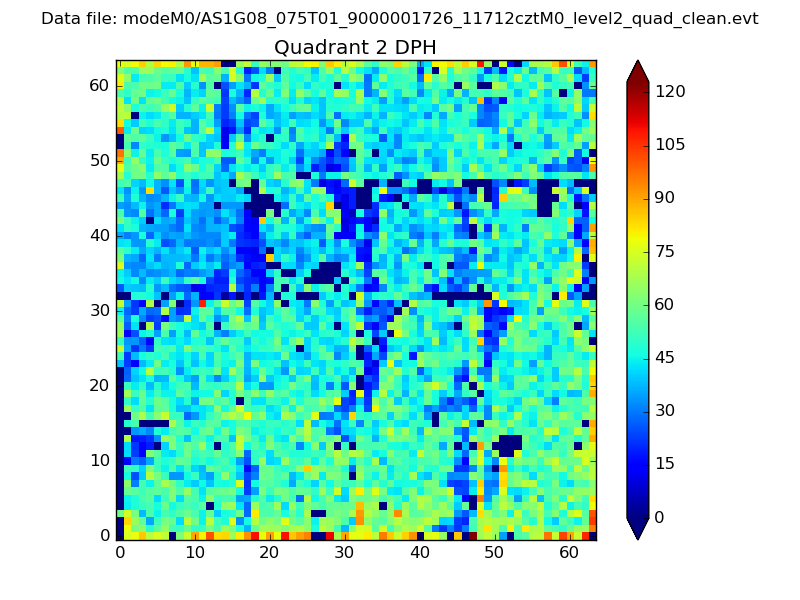 |
Quadrant C |
| Plot type | Count rate plots | Images |
|---|---|---|
| Comparison with Poisson distribution Blue bars denote a histogram of data divided into 1 sec bins. Red curve is a Poisson curve with rate = median count rate of data. |
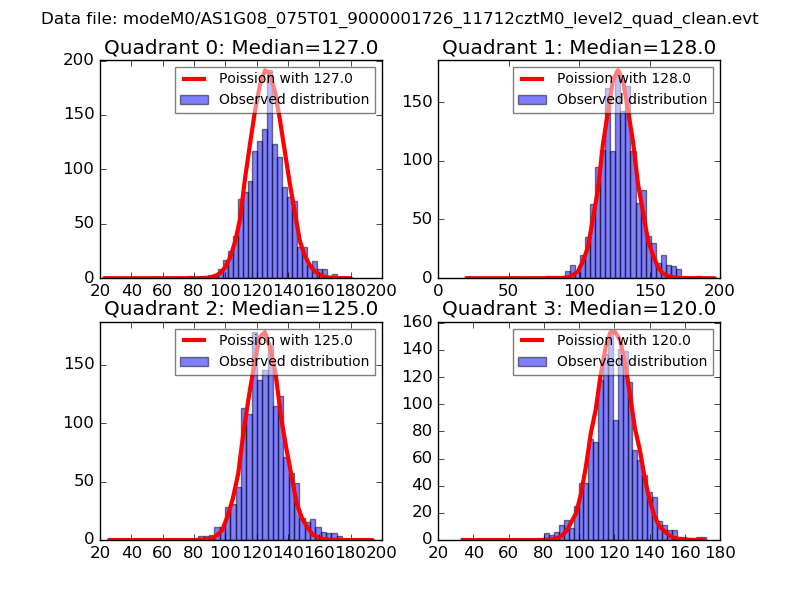 |
 |
| Quadrant-wise count rates Data is divided into 100 sec bins |
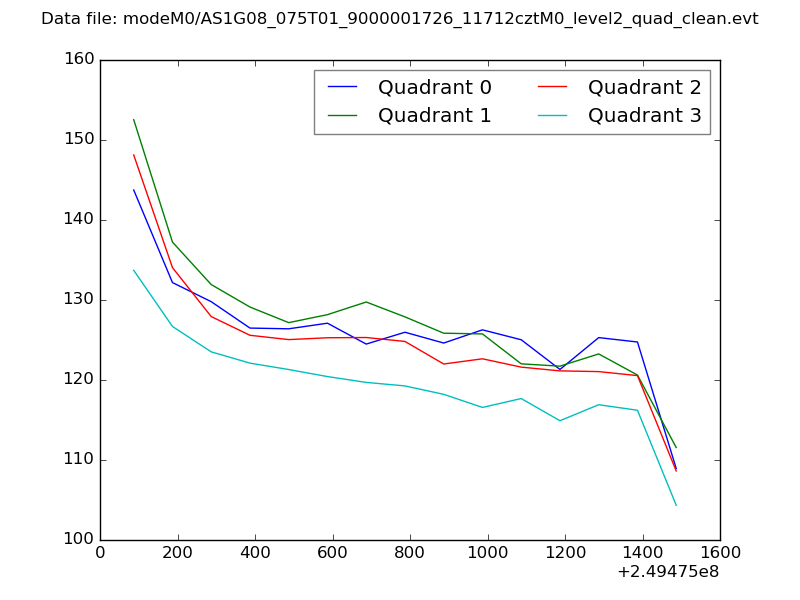 |
|
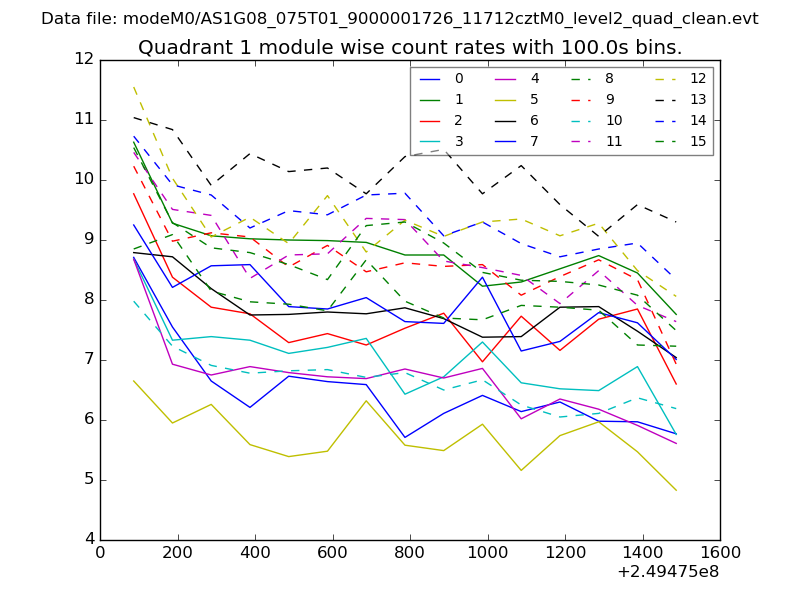
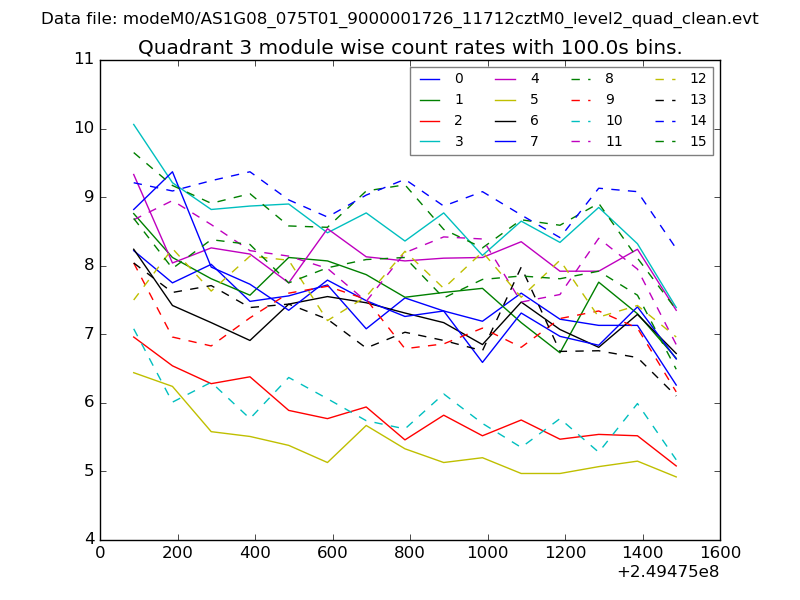
| Module-wise count rates for Quadrant A Data is divided into 100 sec bins |
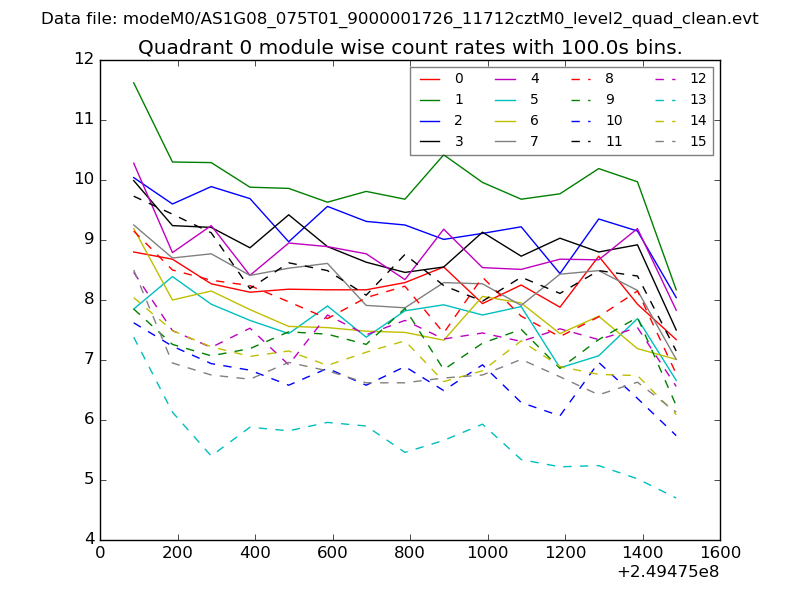 |
 |
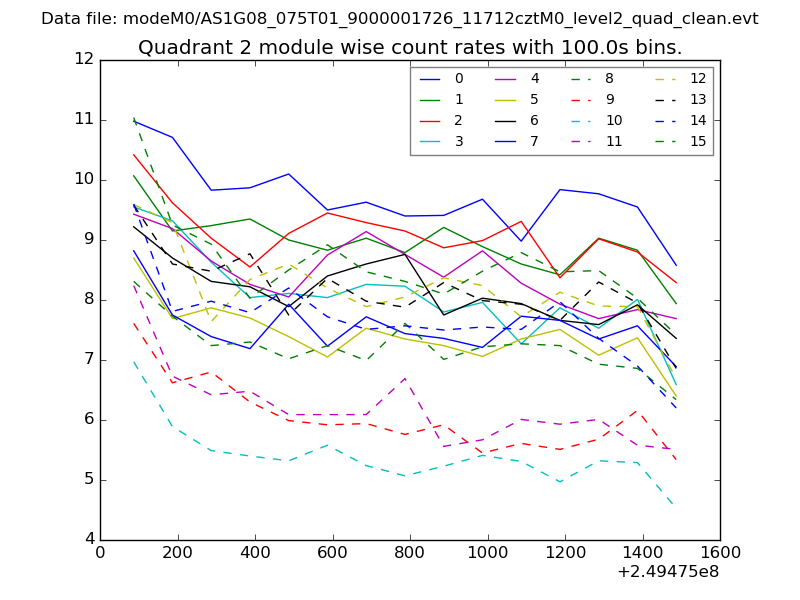
| Module-wise count rates for Quadrant B Data is divided into 100 sec bins |
 |
 |
| Module-wise count rates for Quadrant C Data is divided into 100 sec bins |
 |
 |
| Module-wise count rates for Quadrant D Data is divided into 100 sec bins |
 |
 |
| Parameter | Plot |
|---|---|
| CZT HV Monitor |  |
| D_VDD |  |
| Temperature 1 | 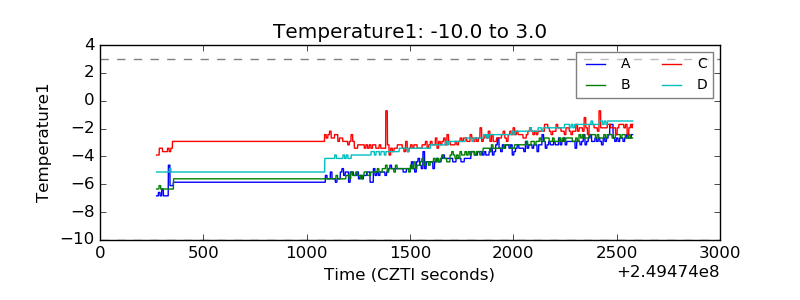 |
| Veto HV Monitor | 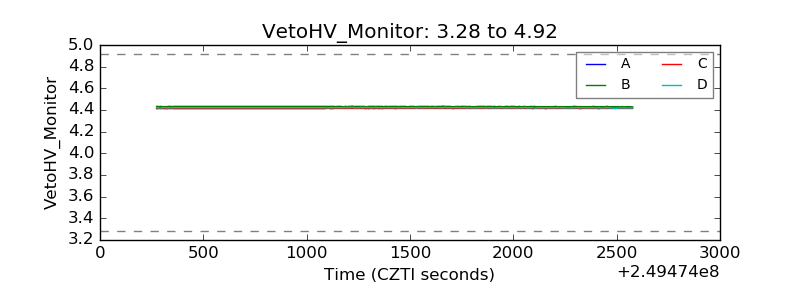 |
| Veto LLD | 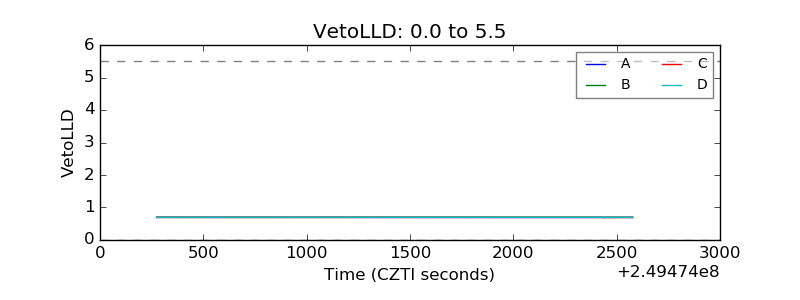 |
| Alpha Counter | 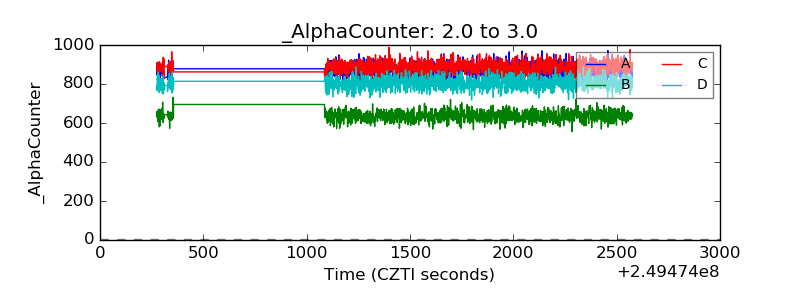 |
| _CPM_Rate | 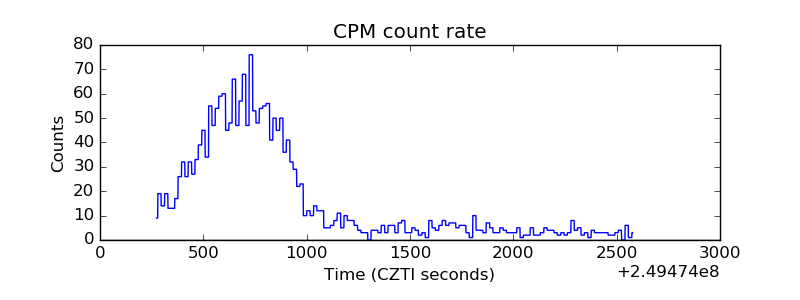 |
| CZT Counter | 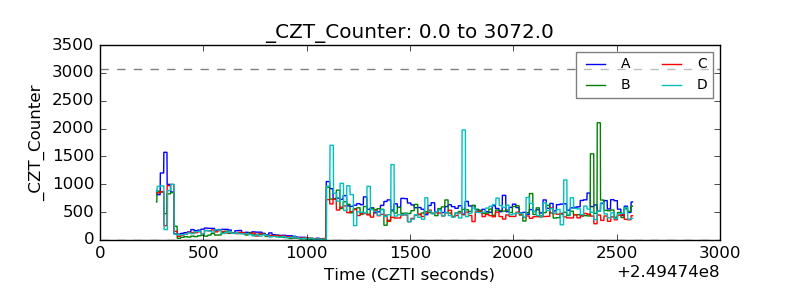 |
| +2.5 Volts monitor |  |
| +5 Volts monitor |  |
| _ROLL_ROT | 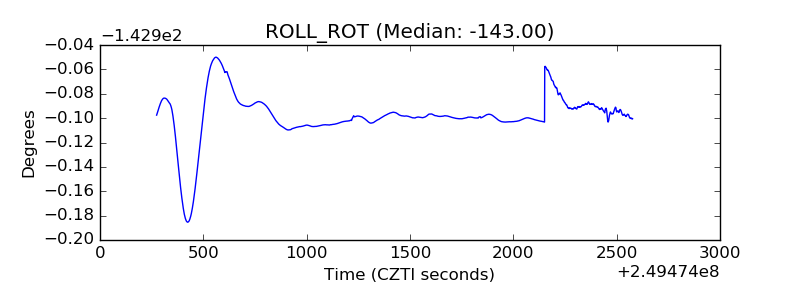 |
| _Roll_DEC | 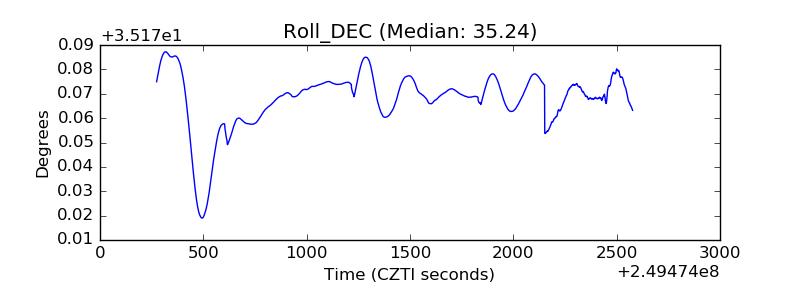 |
| _Roll_RA |  |
| Veto Counter | 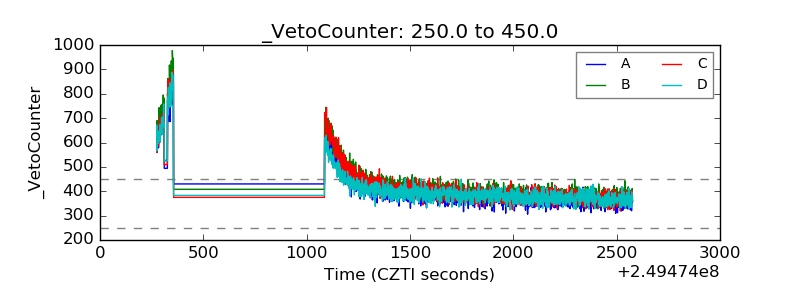 |