| Param | Original file | Final file |
|---|---|---|
| Filename | modeM0/AS1G08_075T01_9000001726_11714cztM0_level2.evt | modeM0/AS1G08_075T01_9000001726_11714cztM0_level2_quad_clean.evt |
| Size (bytes) | 525,893,760 | 89,821,440 |
| Size | 501.5 MB | 85.7 MB |
| Events in quadrant A | 4,568,484 | 565,264 |
| Events in quadrant B | 4,018,414 | 572,326 |
| Events in quadrant C | 3,075,448 | 568,237 |
| Events in quadrant D | 3,805,370 | 542,583 |
| Mode M0 | |||
|---|---|---|---|
| Quadrant | BADHDUFLAG | Total packets | Discarded packets |
| A | 0 | 17995 | 2 |
| B | 0 | 16324 | 1 |
| C | 0 | 13966 | 1 |
| D | 0 | 15779 | 1 |
| Mode M9 | |||
|---|---|---|---|
| Quadrant | BADHDUFLAG | Total packets | Discarded packets |
| A | 0 | 1 | 0 |
| B | 0 | 1 | 0 |
| C | 0 | 1 | 0 |
| D | 0 | 1 | 0 |
| Mode SS | |||
|---|---|---|---|
| Quadrant | BADHDUFLAG | Total packets | Discarded packets |
| A | 0 | 138 | 0 |
| B | 0 | 138 | 0 |
| C | 0 | 138 | 0 |
| D | 0 | 138 | 0 |
| Quadrant | Total seconds | Saturated seconds | Saturation percentage |
|---|---|---|---|
| A | 6762 | 199 | 2.942916% |
| B | 6762 | 249 | 3.682343% |
| C | 6762 | 34 | 0.502810% |
| D | 6762 | 123 | 1.818988% |
Noise dominated data is calculated using 1-second bins in cleaned event files. If a bin has >2000 counts, and if more than 50% of those come from <1% of pixels, then it is considered to be noise-dominated and hence unusable.
| Quadrant | # 1 sec bins | Bins with >0 counts | Bins with >2000 counts | High rate bins dominated by noise | Noise dominated (total time) | Noise dominated (detector-on time) | Marked lightcurve |
|---|---|---|---|---|---|---|---|
| A | 6853 | 6764 | 65 | 65 | 0.95% | 0.96% | 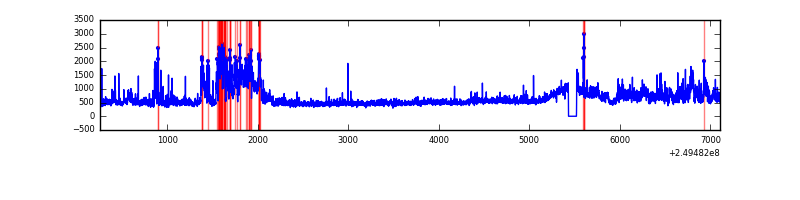 |
| B | 6853 | 6764 | 86 | 86 | 1.25% | 1.27% | 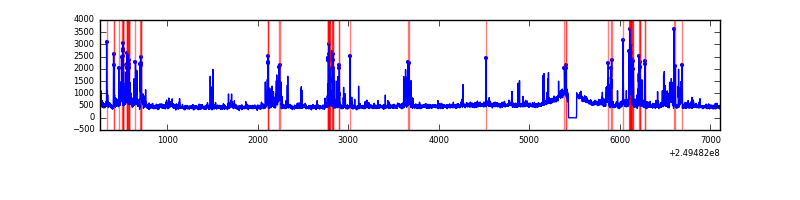 |
| C | 6853 | 6764 | 0 | 0 | 0.00% | 0.00% | 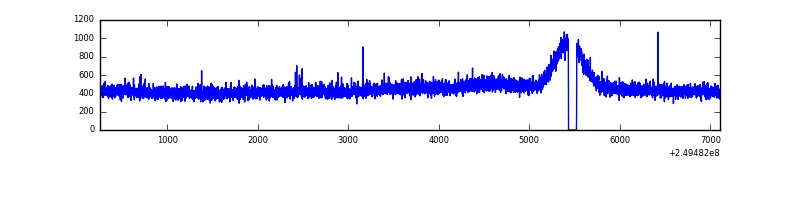 |
| D | 6853 | 6764 | 89 | 89 | 1.30% | 1.32% | 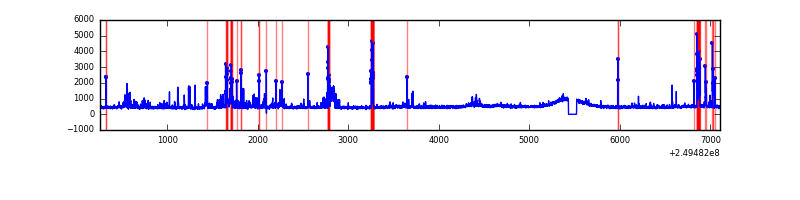 |
Top three noisy pixels from each quadrant. If the there are fewer than three noisy pixels in the level2.evt file, extra rows are filled as -1
| Pixel properties | Quadrant properties | ||||||
|---|---|---|---|---|---|---|---|
| Quadrant | DetID | PixID | Counts | Sigma | Mean | Median | Sigma |
| A | 8 | 15 | 1130159 | 6783.45 | 810 | 792 | 166.5 |
| A | 1 | 162 | 110800 | 660.75 | 810 | 792 | 166.5 |
| A | 1 | 178 | 56778 | 336.28 | 810 | 792 | 166.5 |
| B | 4 | 239 | 503080 | 3223.69 | 804 | 784 | 155.8 |
| B | 3 | 64 | 136321 | 869.86 | 804 | 784 | 155.8 |
| B | 15 | 204 | 90480 | 575.66 | 804 | 784 | 155.8 |
| C | 13 | 61 | 5679 | 26.4 | 786 | 789 | 185.2 |
| C | 8 | 128 | 3719 | 15.82 | 786 | 789 | 185.2 |
| C | 8 | 222 | 3586 | 15.1 | 786 | 789 | 185.2 |
| D | 1 | 52 | 271263 | 1413.83 | 784 | 760 | 191.3 |
| D | 13 | 137 | 211548 | 1101.72 | 784 | 760 | 191.3 |
| D | 8 | 195 | 110862 | 575.47 | 784 | 760 | 191.3 |
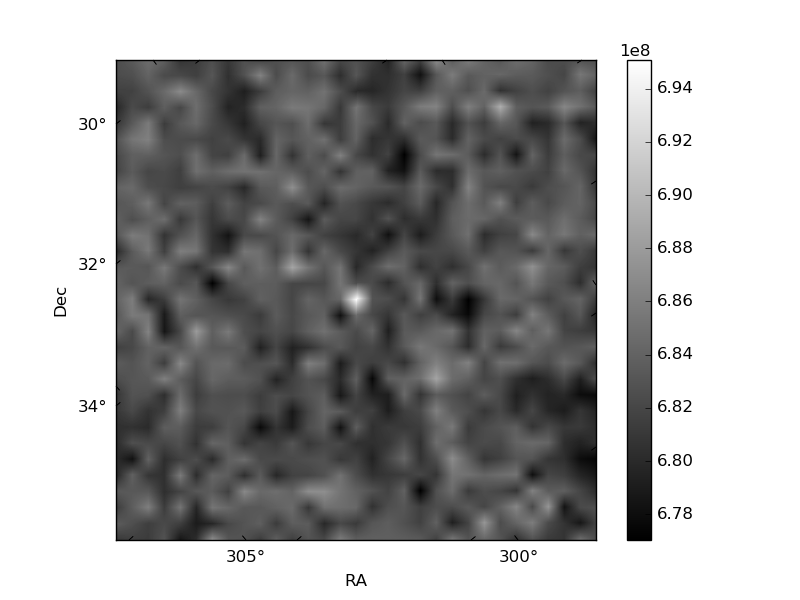
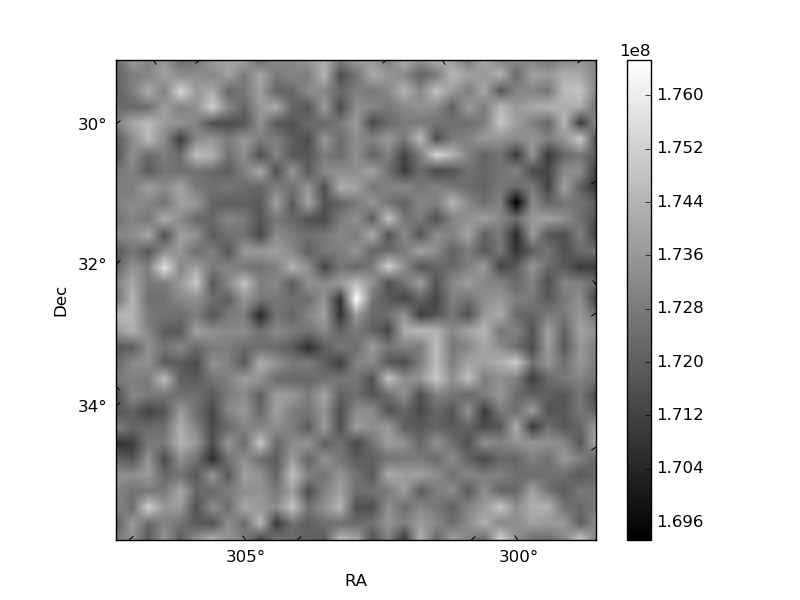
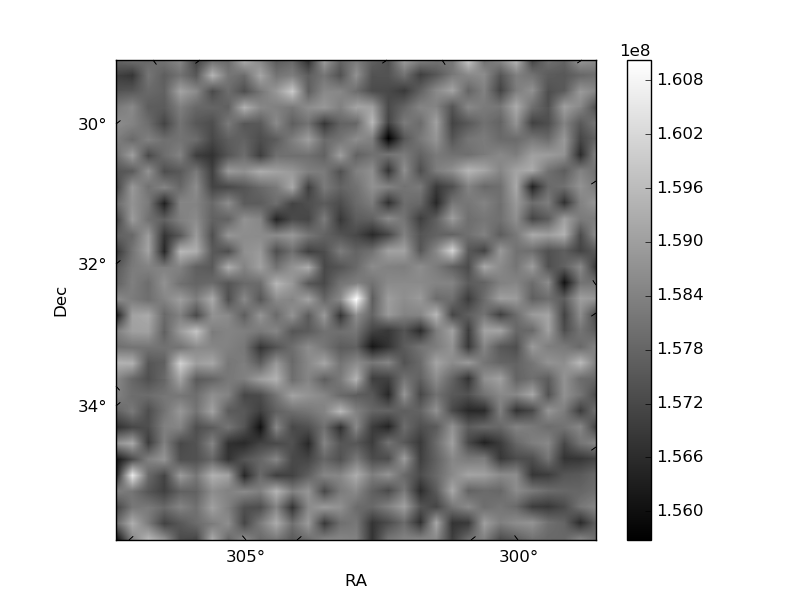
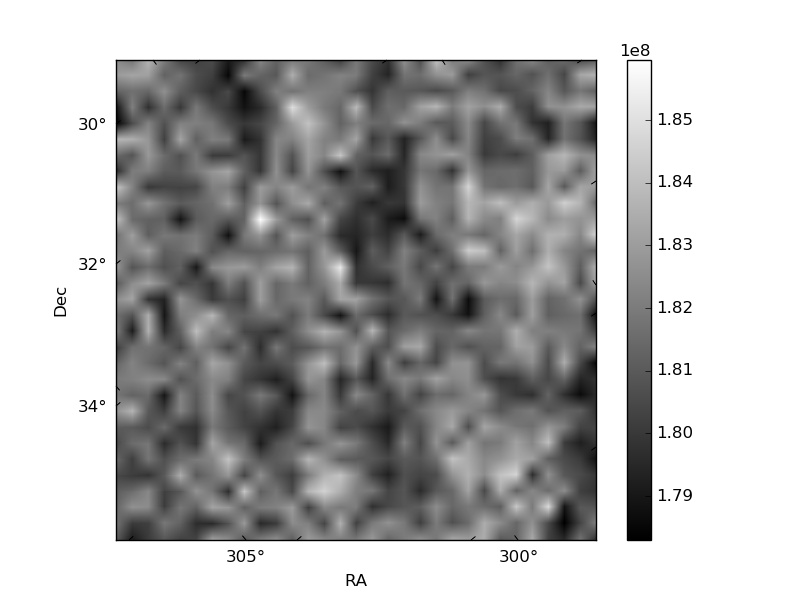
Histogram calculated using DETX and DETY for each event in the final _common_clean file
| Quadrant A | 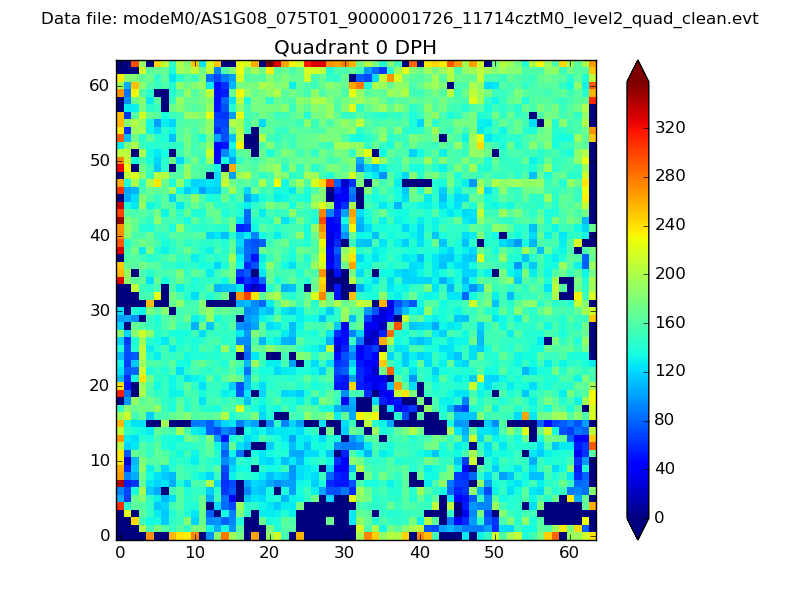 |
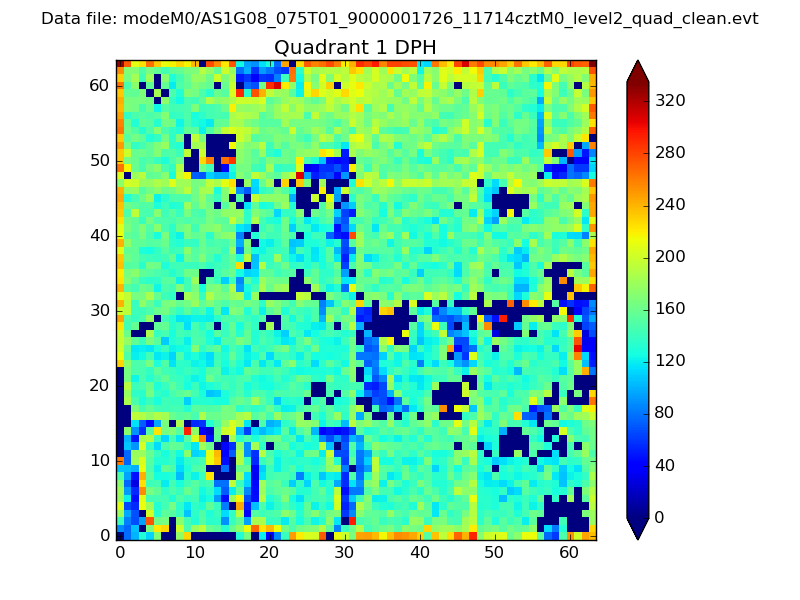 |
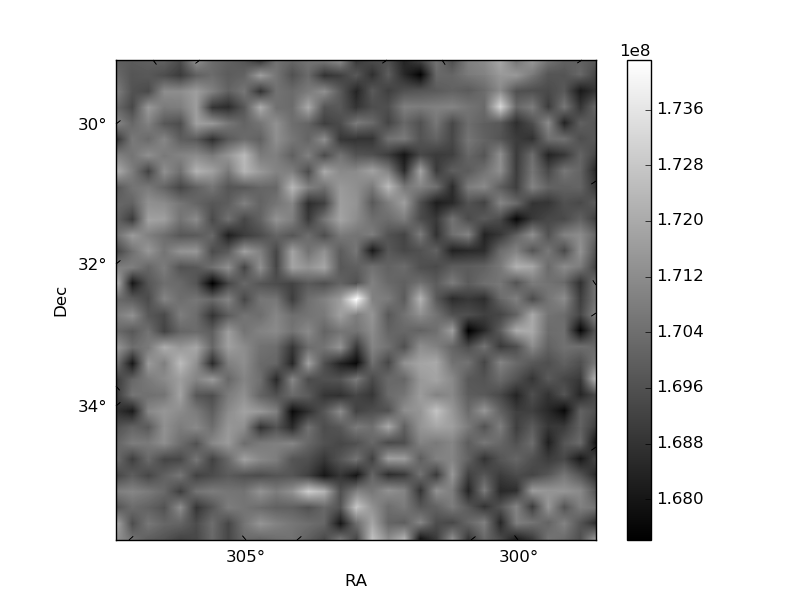
Quadrant B |
|---|---|---|---|
| Quadrant D | 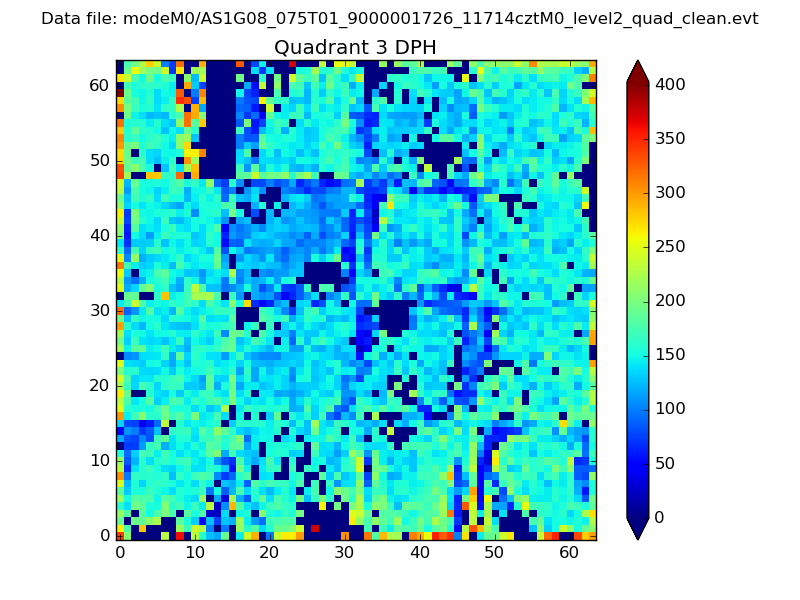 |
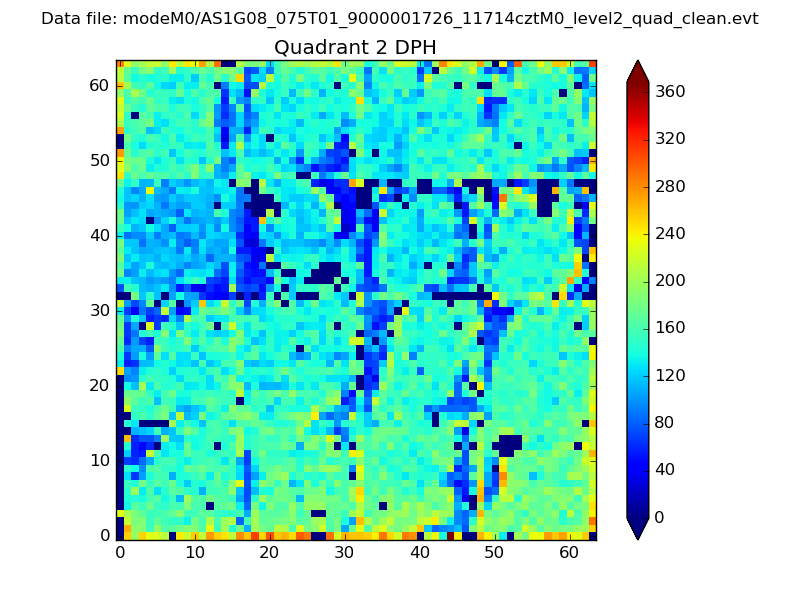 |
Quadrant C |
| Plot type | Count rate plots | Images |
|---|---|---|
| Comparison with Poisson distribution Blue bars denote a histogram of data divided into 1 sec bins. Red curve is a Poisson curve with rate = median count rate of data. |
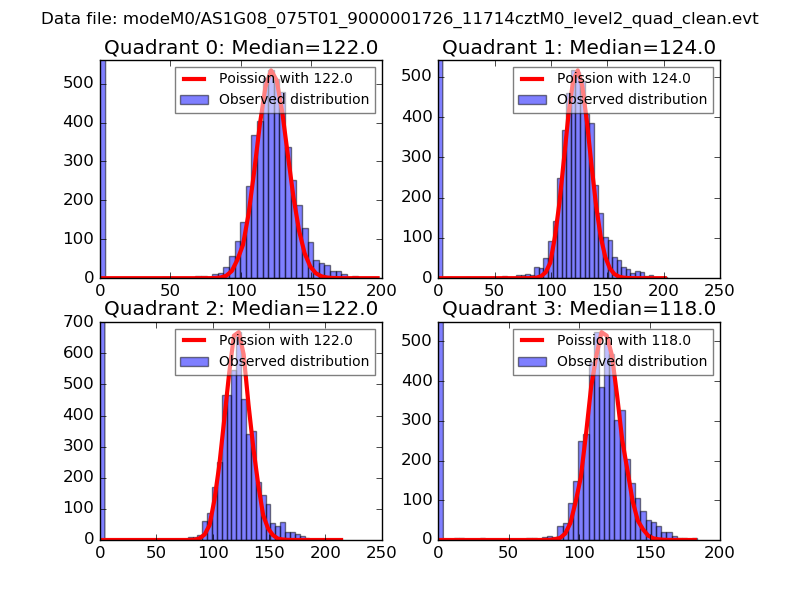 |
 |
| Quadrant-wise count rates Data is divided into 100 sec bins |
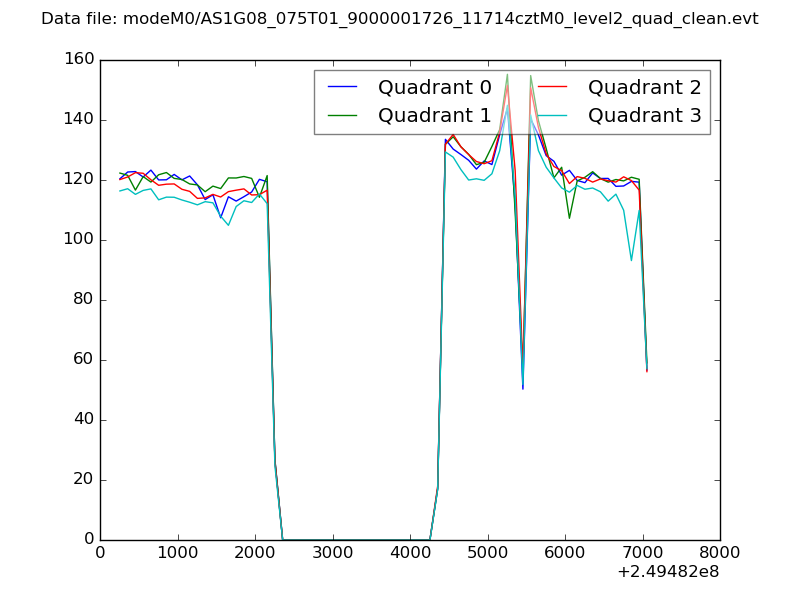 |
|
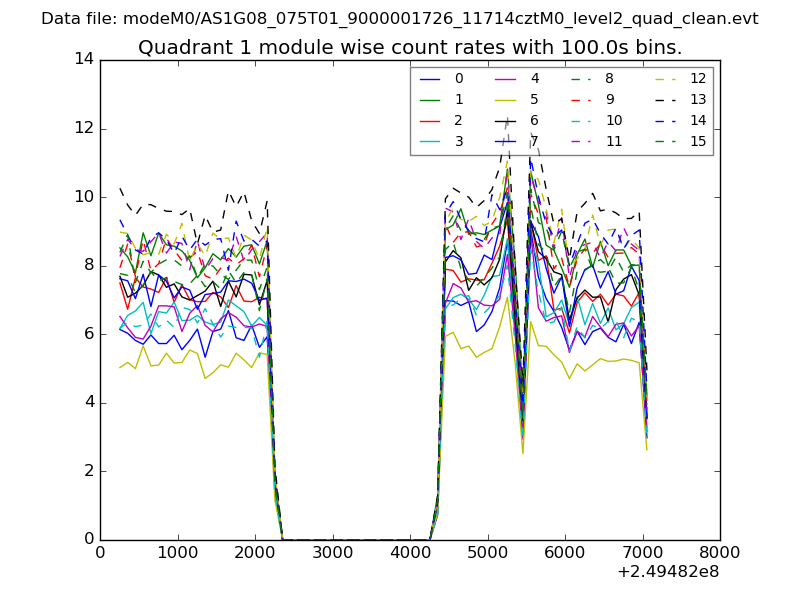
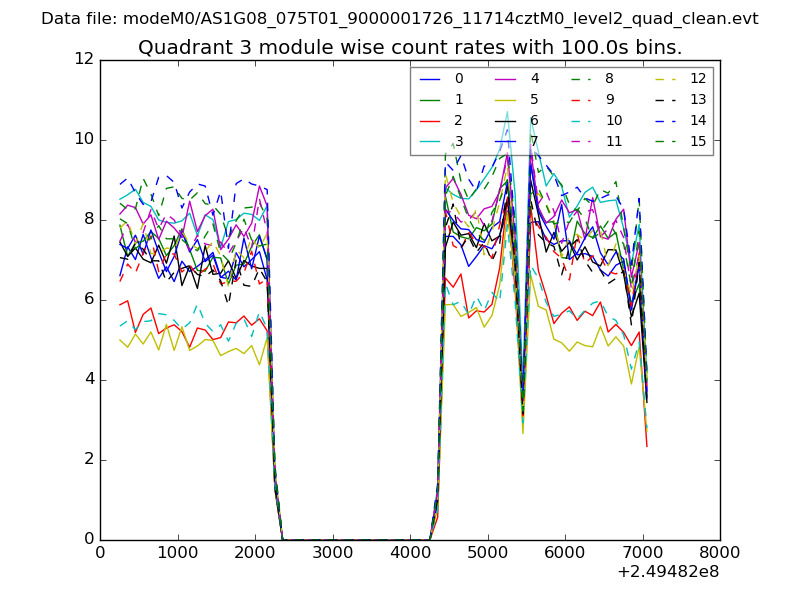
| Module-wise count rates for Quadrant A Data is divided into 100 sec bins |
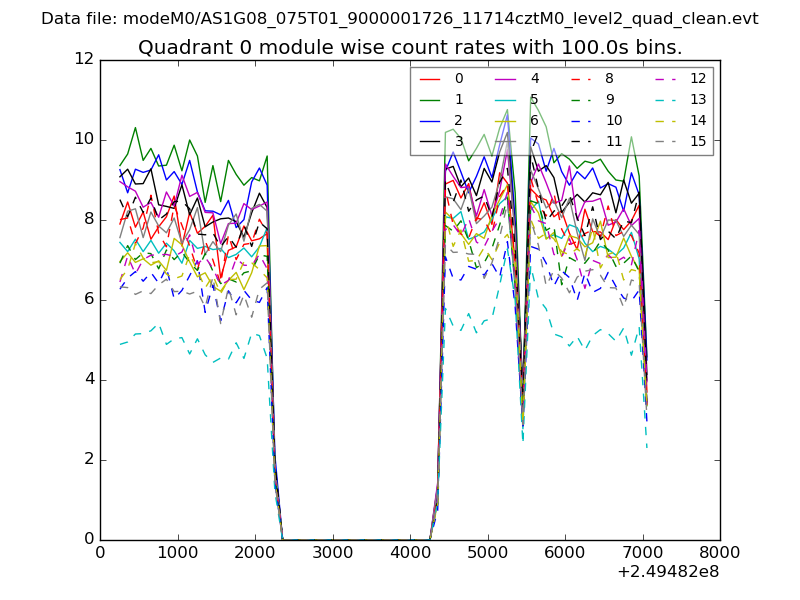 |
 |
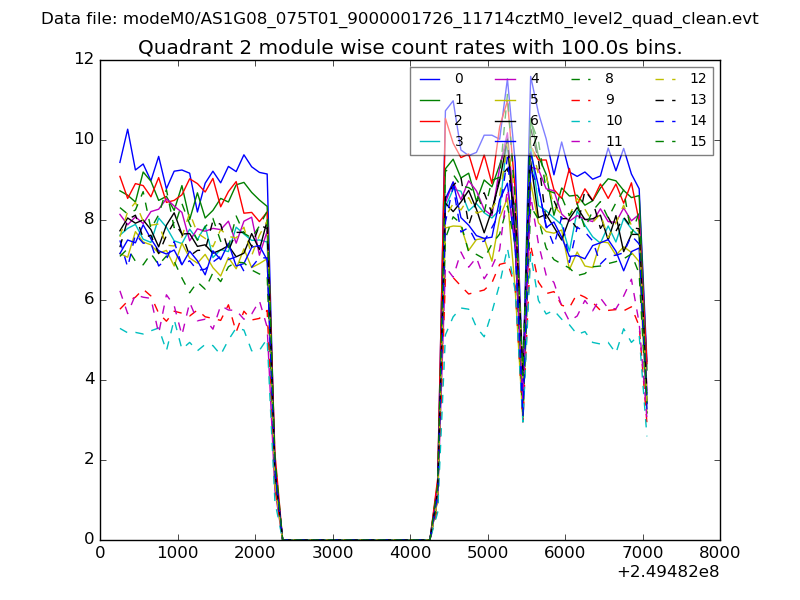
| Module-wise count rates for Quadrant B Data is divided into 100 sec bins |
 |
 |
| Module-wise count rates for Quadrant C Data is divided into 100 sec bins |
 |
 |
| Module-wise count rates for Quadrant D Data is divided into 100 sec bins |
 |
 |
| Parameter | Plot |
|---|---|
| CZT HV Monitor | 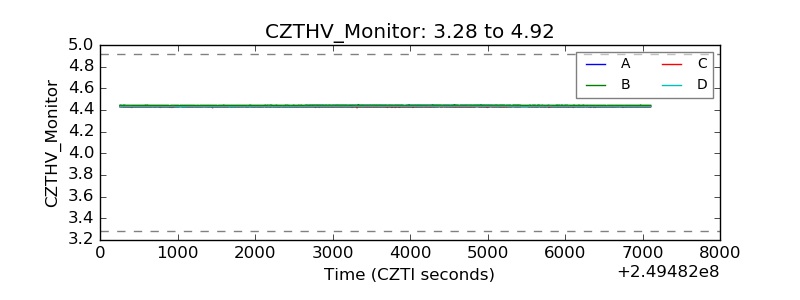 |
| D_VDD |  |
| Temperature 1 | 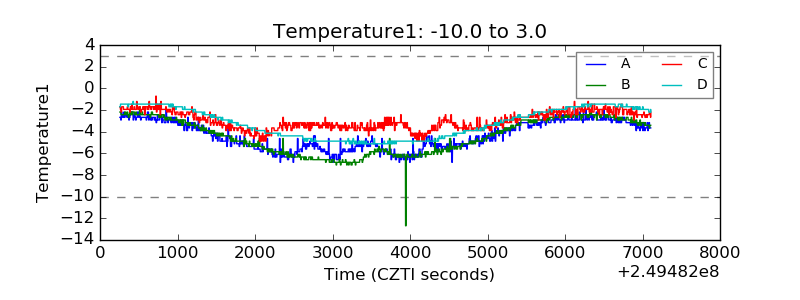 |
| Veto HV Monitor | 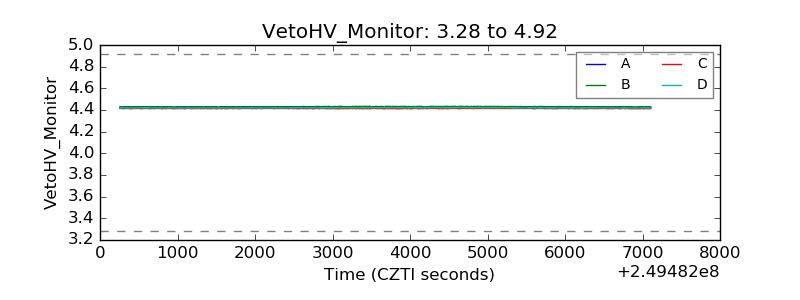 |
| Veto LLD | 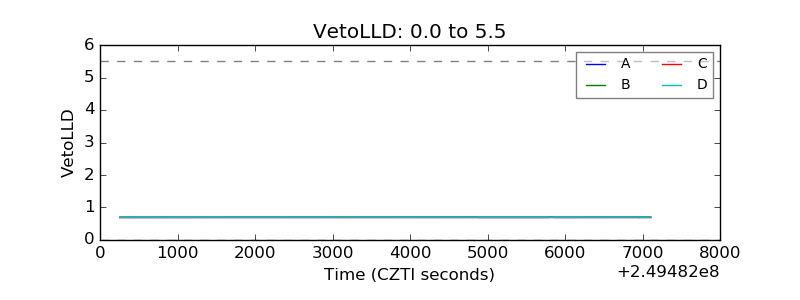 |
| Alpha Counter | 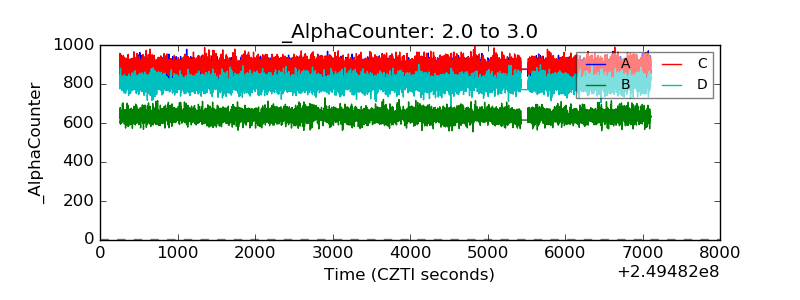 |
| _CPM_Rate | 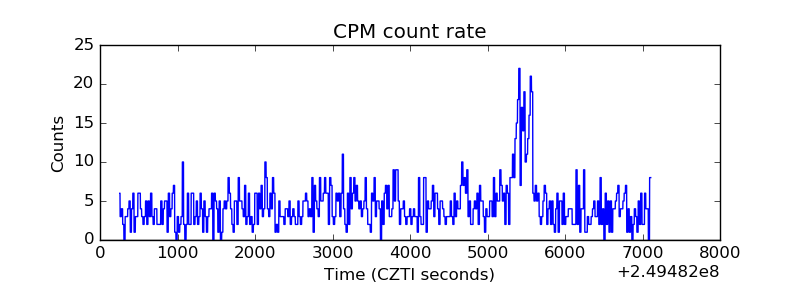 |
| CZT Counter | 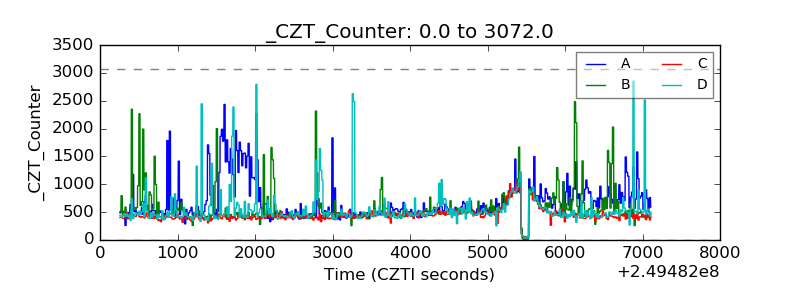 |
| +2.5 Volts monitor |  |
| +5 Volts monitor |  |
| _ROLL_ROT | 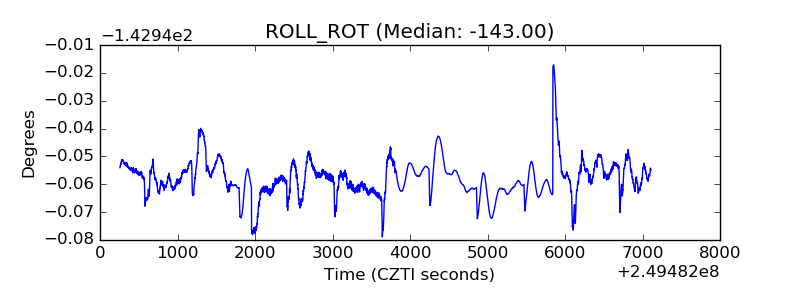 |
| _Roll_DEC |  |
| _Roll_RA | 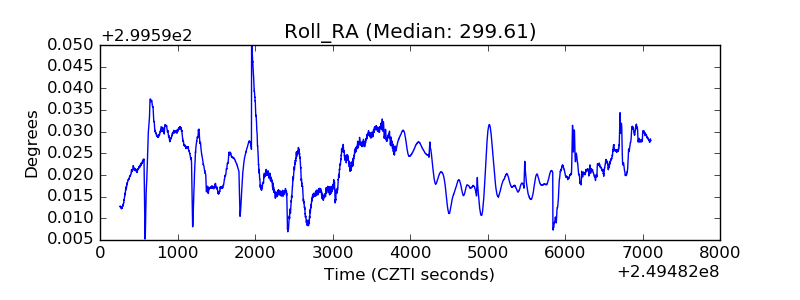 |
| Veto Counter | 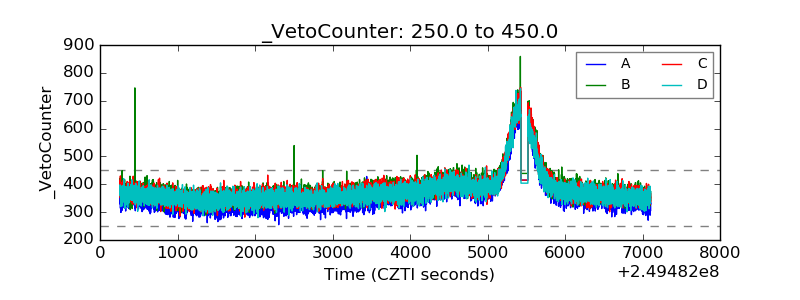 |