| Param | Original file | Final file |
|---|---|---|
| Filename | modeM0/AS1G08_075T01_9000001726_11715cztM0_level2.evt | modeM0/AS1G08_075T01_9000001726_11715cztM0_level2_quad_clean.evt |
| Size (bytes) | 534,231,360 | 93,594,240 |
| Size | 509.5 MB | 89.3 MB |
| Events in quadrant A | 4,412,915 | 596,025 |
| Events in quadrant B | 3,949,425 | 598,245 |
| Events in quadrant C | 3,113,316 | 590,320 |
| Events in quadrant D | 4,228,366 | 561,560 |
| Mode M0 | |||
|---|---|---|---|
| Quadrant | BADHDUFLAG | Total packets | Discarded packets |
| A | 0 | 17681 | 2 |
| B | 0 | 16208 | 1 |
| C | 0 | 14238 | 1 |
| D | 0 | 17099 | 1 |
| Mode M9 | |||
|---|---|---|---|
| Quadrant | BADHDUFLAG | Total packets | Discarded packets |
| A | 0 | 4 | 0 |
| B | 0 | 4 | 0 |
| C | 0 | 4 | 0 |
| D | 0 | 4 | 0 |
| Mode SS | |||
|---|---|---|---|
| Quadrant | BADHDUFLAG | Total packets | Discarded packets |
| A | 0 | 142 | 0 |
| B | 0 | 142 | 0 |
| C | 0 | 142 | 0 |
| D | 0 | 142 | 0 |
| Quadrant | Total seconds | Saturated seconds | Saturation percentage |
|---|---|---|---|
| A | 7007 | 72 | 1.027544% |
| B | 7007 | 175 | 2.497502% |
| C | 7007 | 20 | 0.285429% |
| D | 7007 | 140 | 1.998002% |
Noise dominated data is calculated using 1-second bins in cleaned event files. If a bin has >2000 counts, and if more than 50% of those come from <1% of pixels, then it is considered to be noise-dominated and hence unusable.
| Quadrant | # 1 sec bins | Bins with >0 counts | Bins with >2000 counts | High rate bins dominated by noise | Noise dominated (total time) | Noise dominated (detector-on time) | Marked lightcurve |
|---|---|---|---|---|---|---|---|
| A | 7338 | 7009 | 12 | 12 | 0.16% | 0.17% | 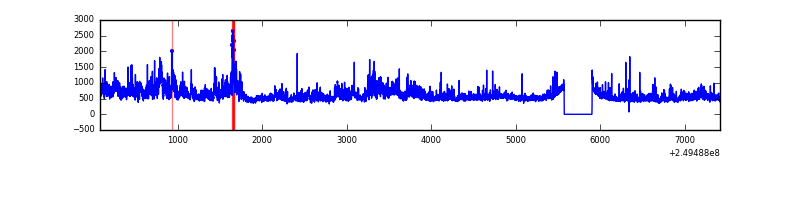 |
| B | 7338 | 7009 | 73 | 73 | 0.99% | 1.04% | 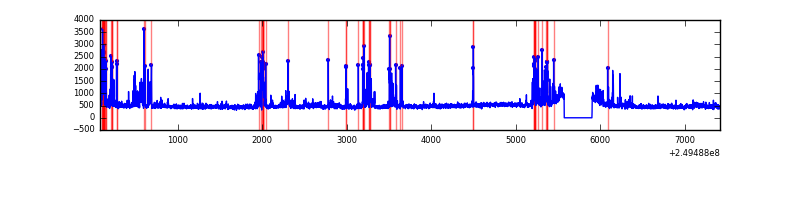 |
| C | 7338 | 7009 | 0 | 0 | 0.00% | 0.00% |  |
| D | 7338 | 7009 | 93 | 93 | 1.27% | 1.33% | 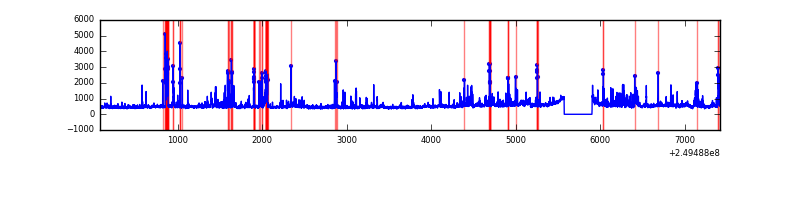 |
Top three noisy pixels from each quadrant. If the there are fewer than three noisy pixels in the level2.evt file, extra rows are filled as -1
| Pixel properties | Quadrant properties | ||||||
|---|---|---|---|---|---|---|---|
| Quadrant | DetID | PixID | Counts | Sigma | Mean | Median | Sigma |
| A | 8 | 15 | 993668 | 5915.79 | 816 | 799 | 167.8 |
| A | 1 | 162 | 96874 | 572.44 | 816 | 799 | 167.8 |
| A | 1 | 178 | 50504 | 296.16 | 816 | 799 | 167.8 |
| B | 4 | 239 | 378286 | 2412.63 | 812 | 792 | 156.5 |
| B | 3 | 64 | 218252 | 1389.82 | 812 | 792 | 156.5 |
| B | 15 | 204 | 106324 | 674.47 | 812 | 792 | 156.5 |
| C | 8 | 128 | 8924 | 43.88 | 794 | 798 | 185.2 |
| C | 13 | 61 | 5763 | 26.81 | 794 | 798 | 185.2 |
| C | 8 | 112 | 5455 | 25.15 | 794 | 798 | 185.2 |
| D | 8 | 195 | 409834 | 2133.03 | 789 | 767 | 191.8 |
| D | 13 | 137 | 280335 | 1457.77 | 789 | 767 | 191.8 |
| D | 7 | 80 | 242483 | 1260.4 | 789 | 767 | 191.8 |
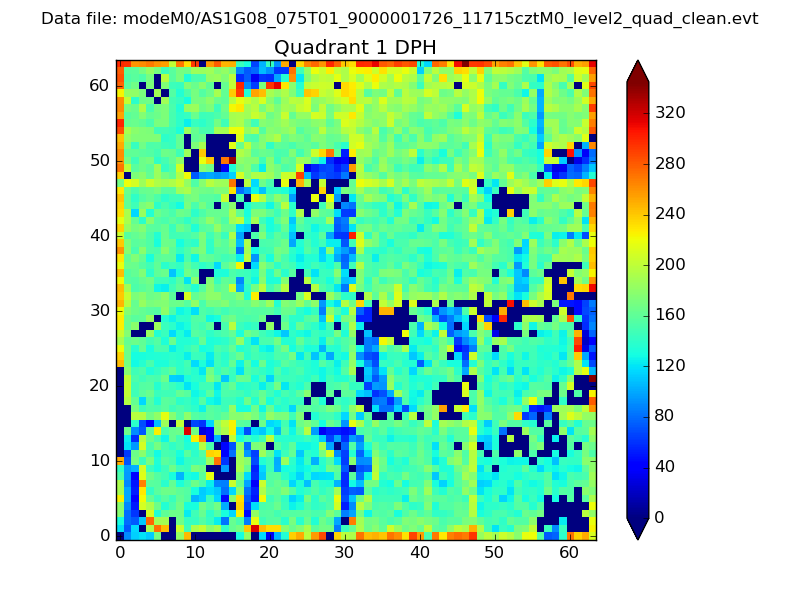
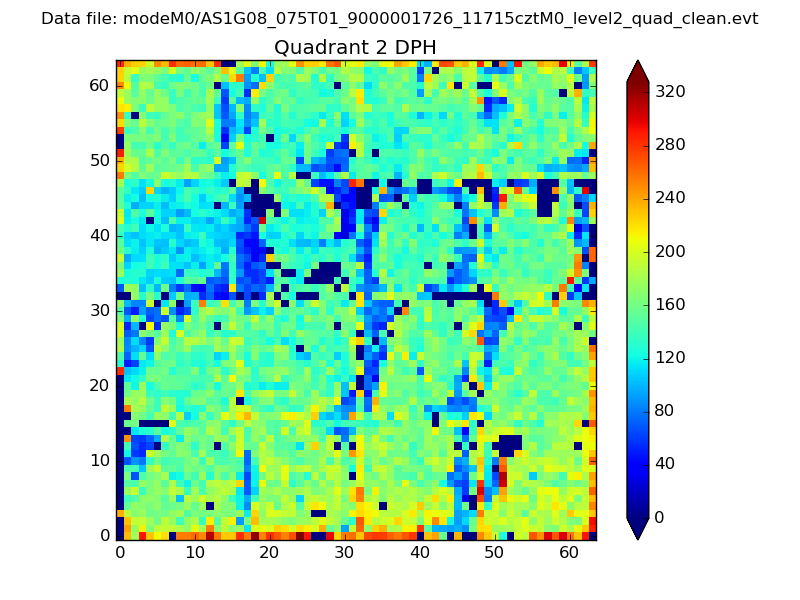
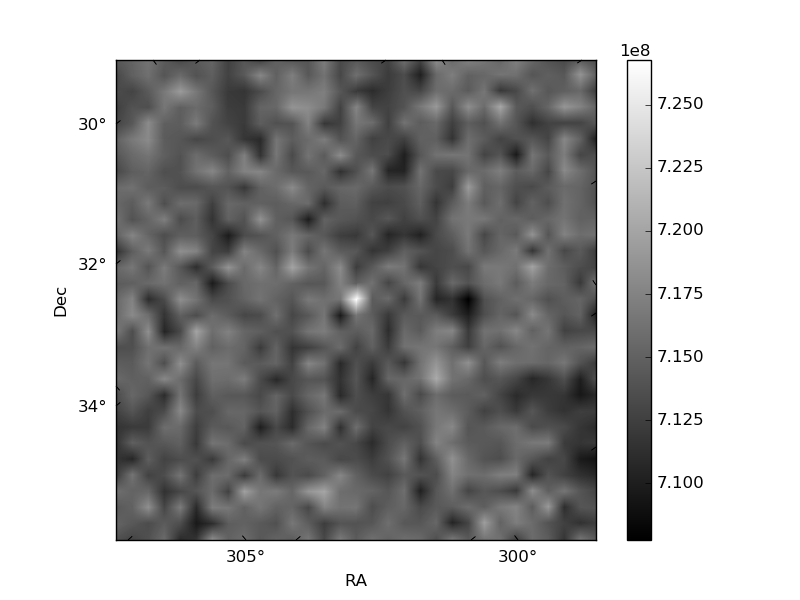
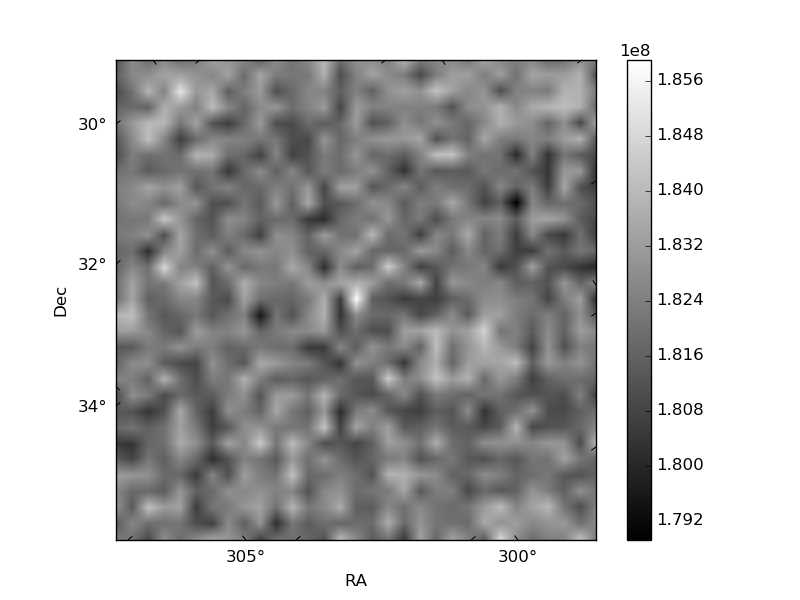
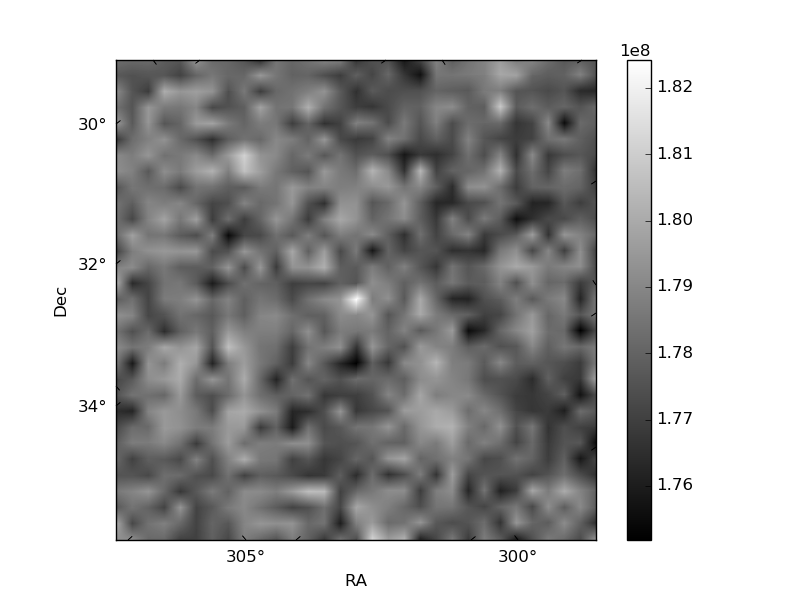
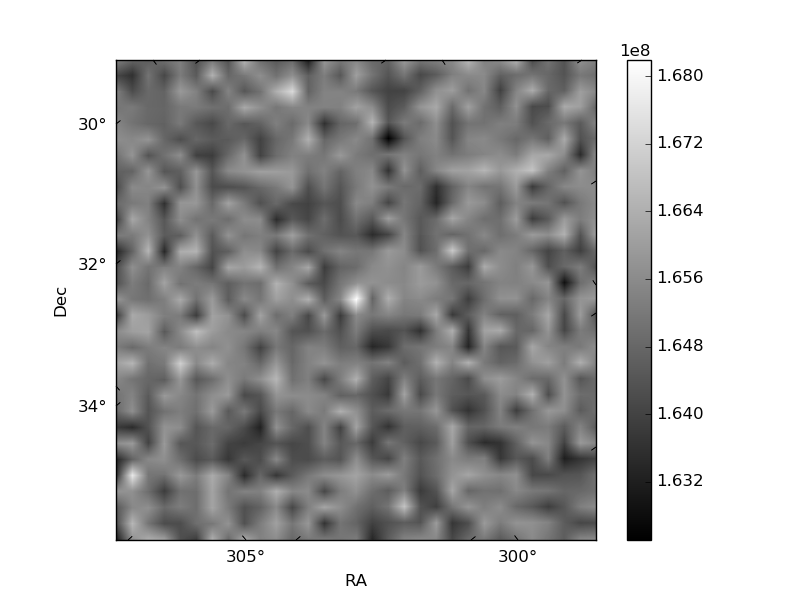
Histogram calculated using DETX and DETY for each event in the final _common_clean file
| Quadrant A | 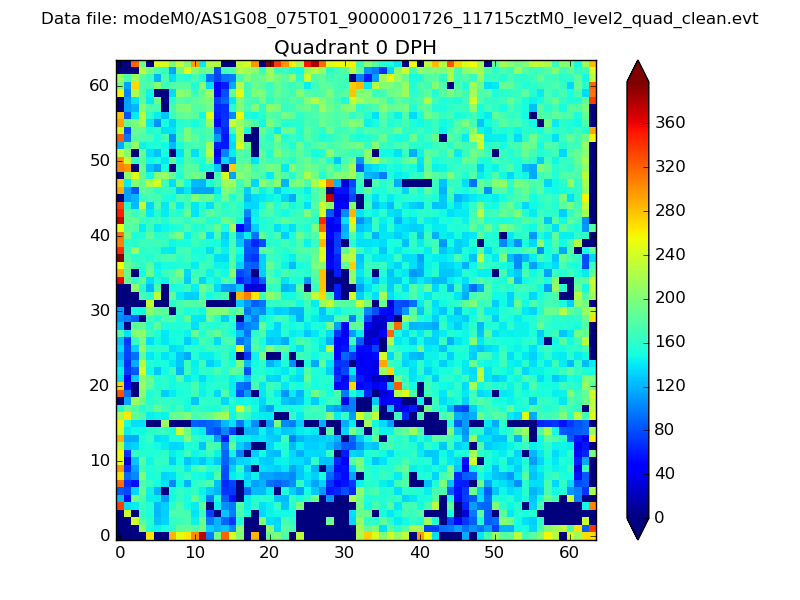 |
 |
Quadrant B |
|---|---|---|---|
| Quadrant D | 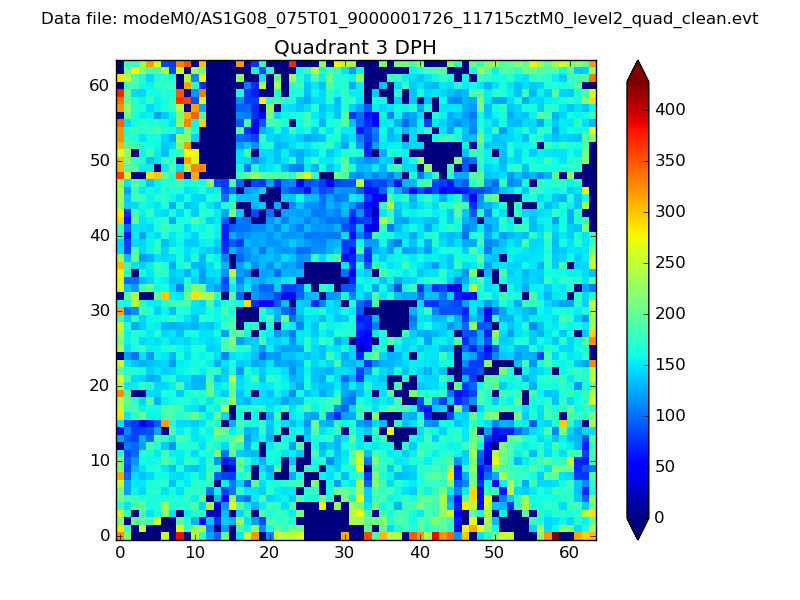 |
 |
Quadrant C |
| Plot type | Count rate plots | Images |
|---|---|---|
| Comparison with Poisson distribution Blue bars denote a histogram of data divided into 1 sec bins. Red curve is a Poisson curve with rate = median count rate of data. |
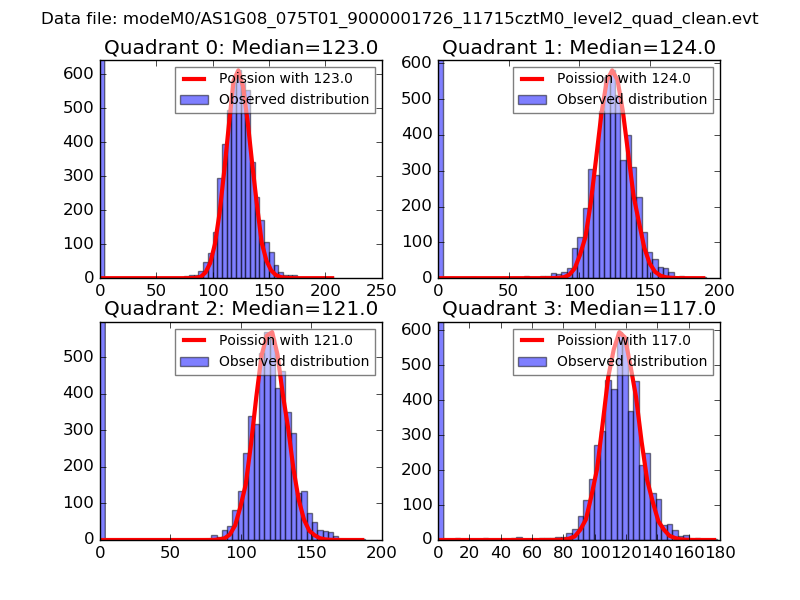 |
 |
| Quadrant-wise count rates Data is divided into 100 sec bins |
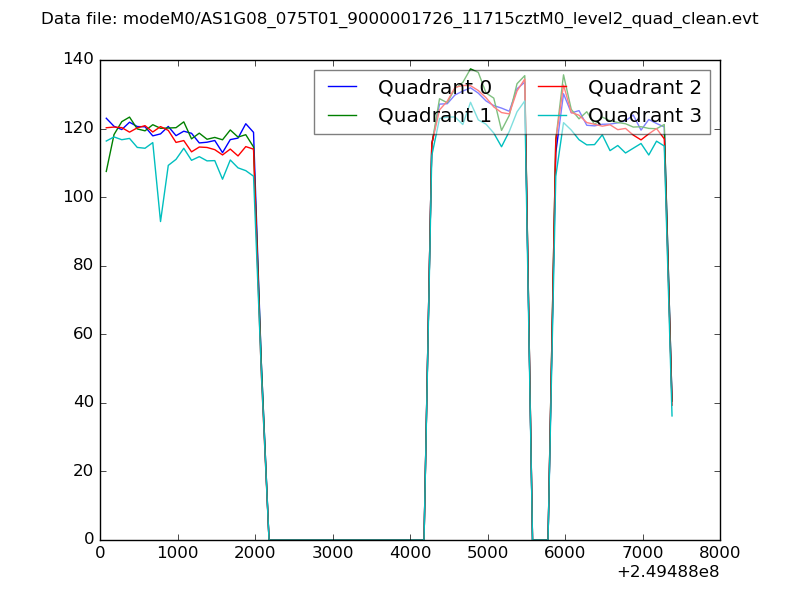 |
|
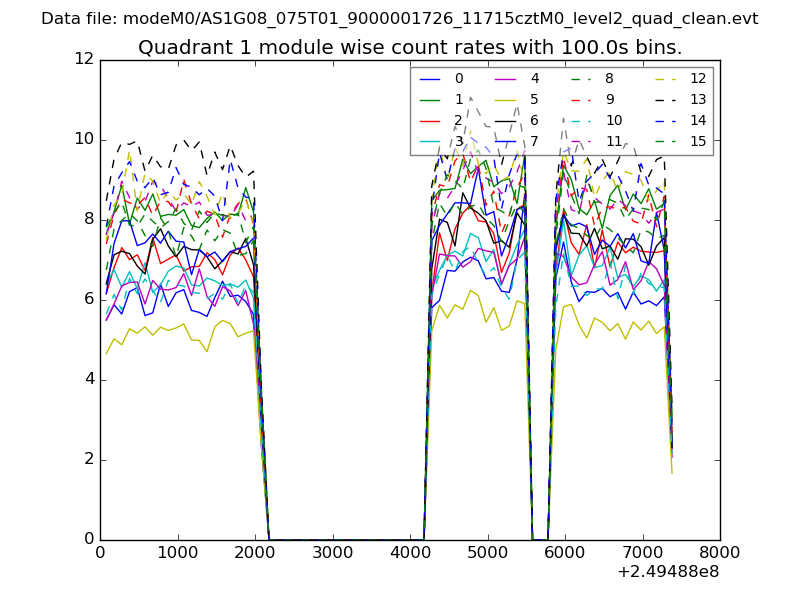
| Module-wise count rates for Quadrant A Data is divided into 100 sec bins |
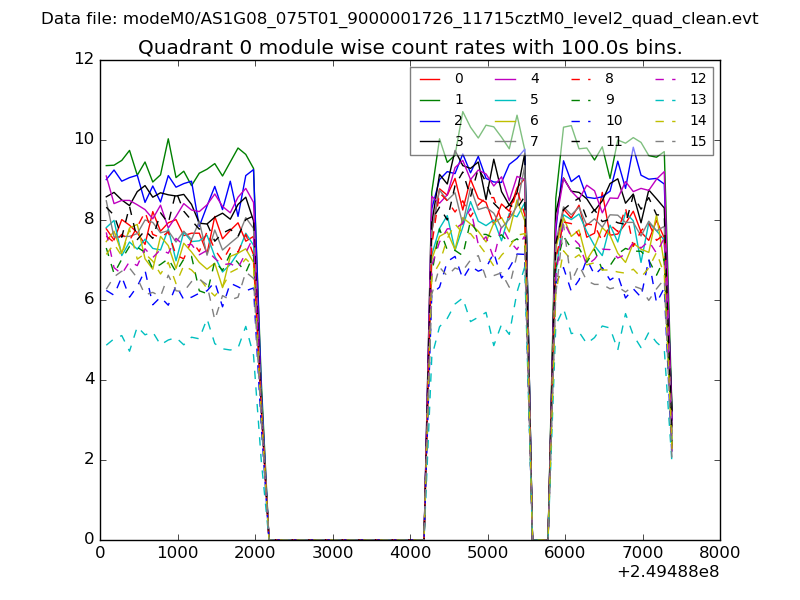 |
 |
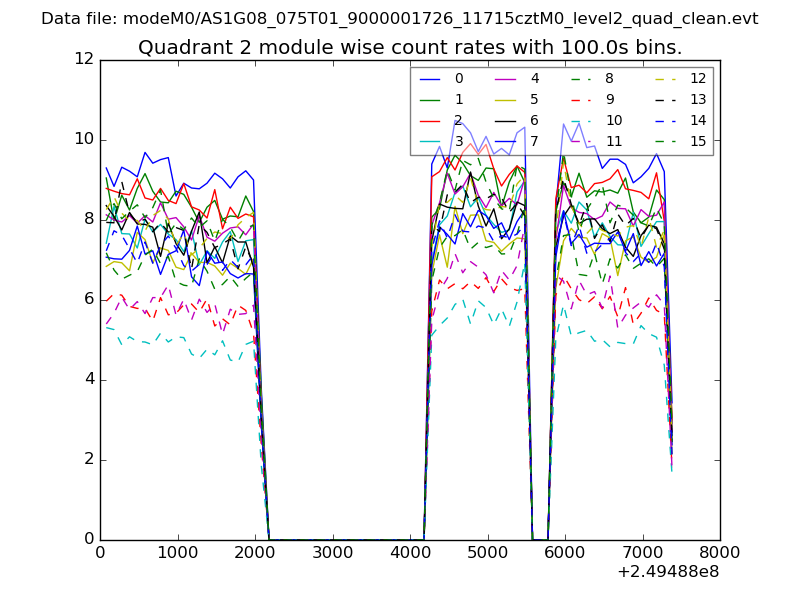
| Module-wise count rates for Quadrant B Data is divided into 100 sec bins |
 |
 |
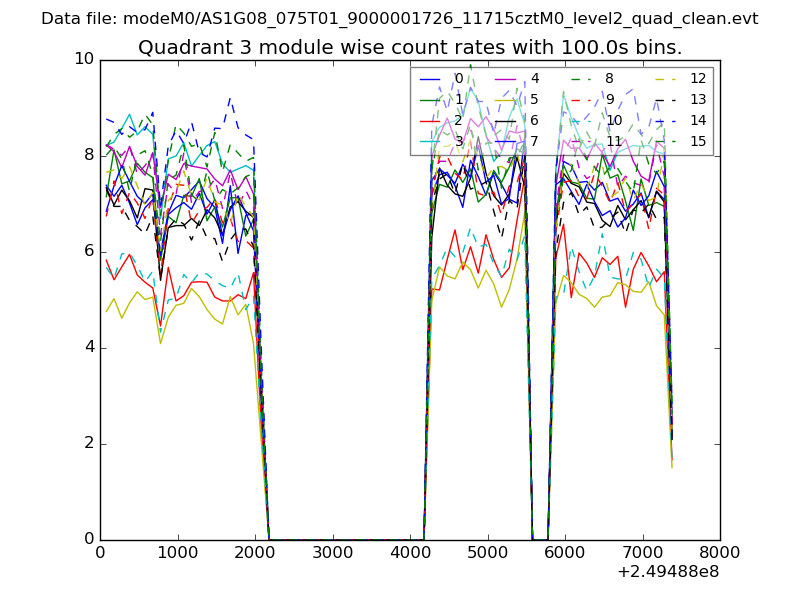
| Module-wise count rates for Quadrant C Data is divided into 100 sec bins |
 |
 |
| Module-wise count rates for Quadrant D Data is divided into 100 sec bins |
 |
 |
| Parameter | Plot |
|---|---|
| CZT HV Monitor | 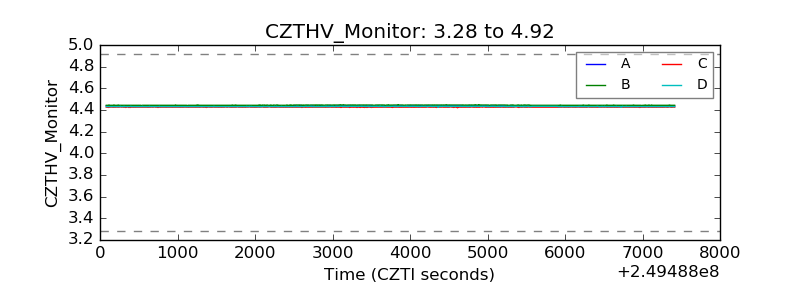 |
| D_VDD | 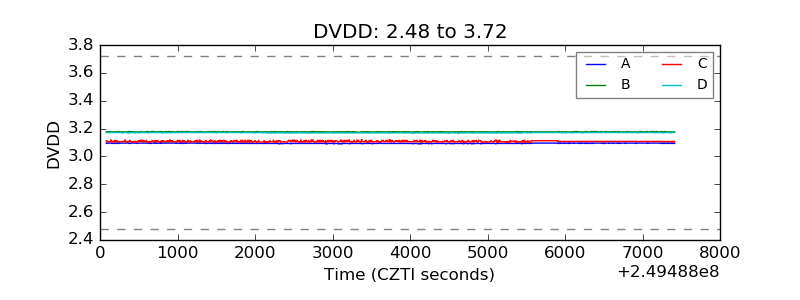 |
| Temperature 1 | 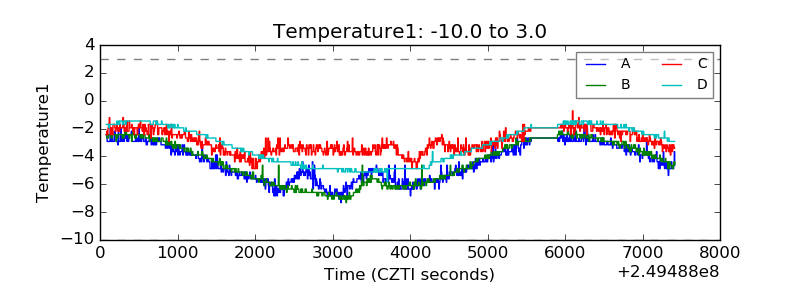 |
| Veto HV Monitor |  |
| Veto LLD | 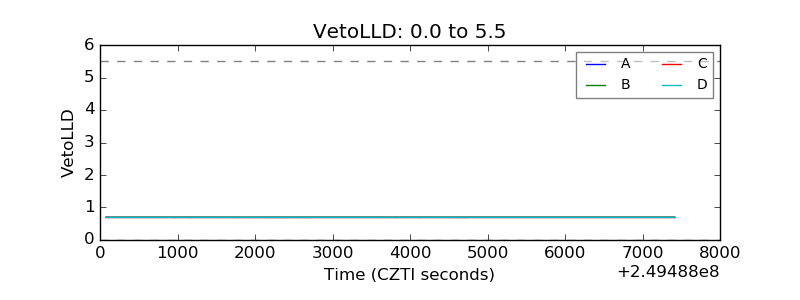 |
| Alpha Counter | 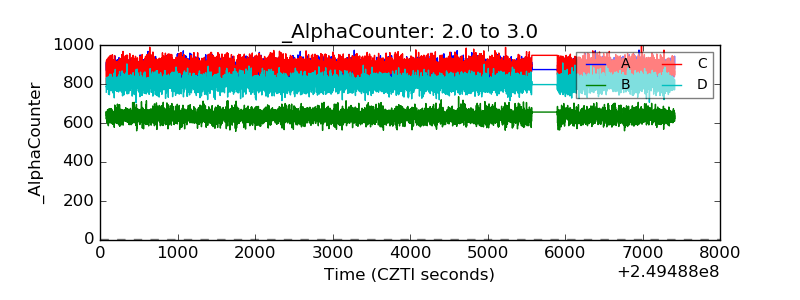 |
| _CPM_Rate | 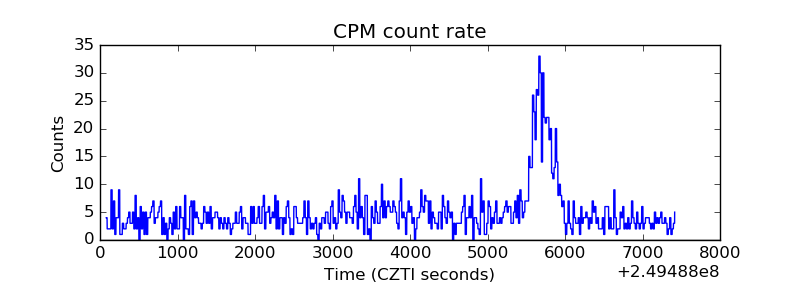 |
| CZT Counter | 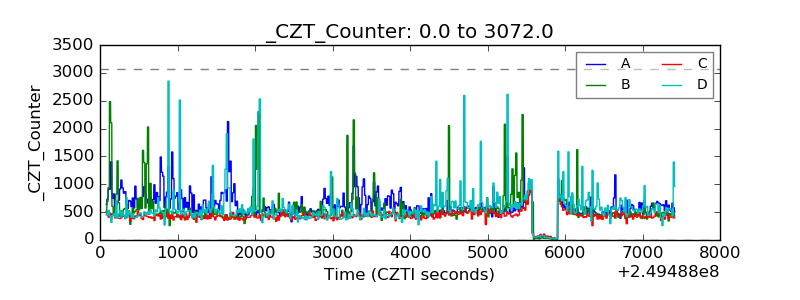 |
| +2.5 Volts monitor |  |
| +5 Volts monitor |  |
| _ROLL_ROT | 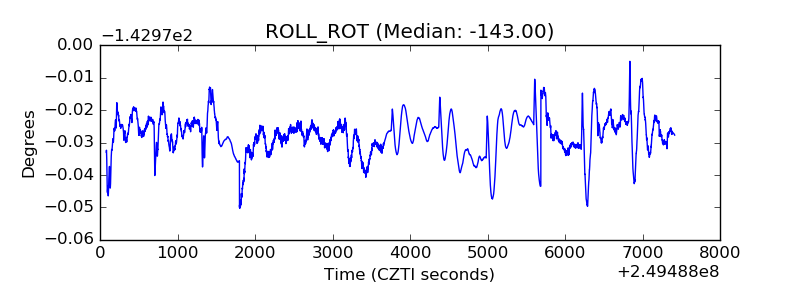 |
| _Roll_DEC |  |
| _Roll_RA | 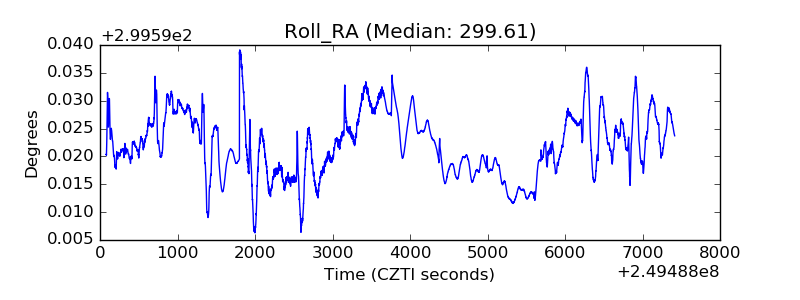 |
| Veto Counter | 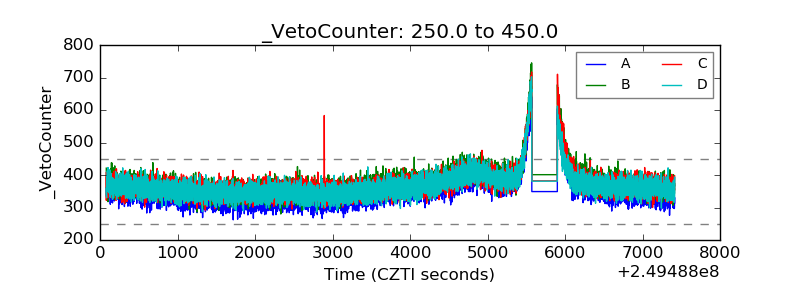 |