| Param | Original file | Final file |
|---|---|---|
| Filename | modeM0/AS1G08_075T01_9000001726_11718cztM0_level2.evt | modeM0/AS1G08_075T01_9000001726_11718cztM0_level2_quad_clean.evt |
| Size (bytes) | 537,603,840 | 78,131,520 |
| Size | 512.7 MB | 74.5 MB |
| Events in quadrant A | 4,577,041 | 479,605 |
| Events in quadrant B | 3,980,032 | 479,697 |
| Events in quadrant C | 3,044,482 | 480,971 |
| Events in quadrant D | 4,220,895 | 453,697 |
| Mode M0 | |||
|---|---|---|---|
| Quadrant | BADHDUFLAG | Total packets | Discarded packets |
| A | 0 | 18282 | 2 |
| B | 0 | 16255 | 1 |
| C | 0 | 13699 | 1 |
| D | 0 | 17360 | 1 |
| Mode M9 | |||
|---|---|---|---|
| Quadrant | BADHDUFLAG | Total packets | Discarded packets |
| A | 0 | 9 | 0 |
| B | 0 | 9 | 0 |
| C | 0 | 9 | 0 |
| D | 0 | 9 | 0 |
| Mode SS | |||
|---|---|---|---|
| Quadrant | BADHDUFLAG | Total packets | Discarded packets |
| A | 0 | 136 | 0 |
| B | 0 | 136 | 0 |
| C | 0 | 136 | 0 |
| D | 0 | 136 | 0 |
| Quadrant | Total seconds | Saturated seconds | Saturation percentage |
|---|---|---|---|
| A | 6772 | 113 | 1.668636% |
| B | 6772 | 245 | 3.617838% |
| C | 6772 | 33 | 0.487301% |
| D | 6772 | 317 | 4.681040% |
Noise dominated data is calculated using 1-second bins in cleaned event files. If a bin has >2000 counts, and if more than 50% of those come from <1% of pixels, then it is considered to be noise-dominated and hence unusable.
| Quadrant | # 1 sec bins | Bins with >0 counts | Bins with >2000 counts | High rate bins dominated by noise | Noise dominated (total time) | Noise dominated (detector-on time) | Marked lightcurve |
|---|---|---|---|---|---|---|---|
| A | 7648 | 6774 | 32 | 32 | 0.42% | 0.47% | 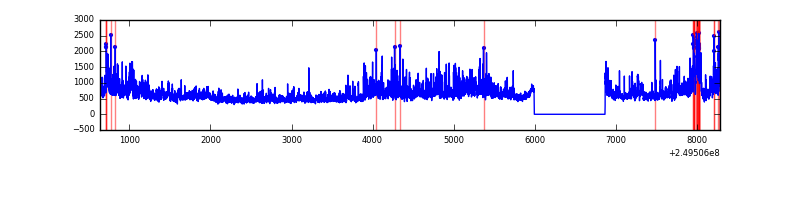 |
| B | 7648 | 6774 | 125 | 125 | 1.63% | 1.85% | 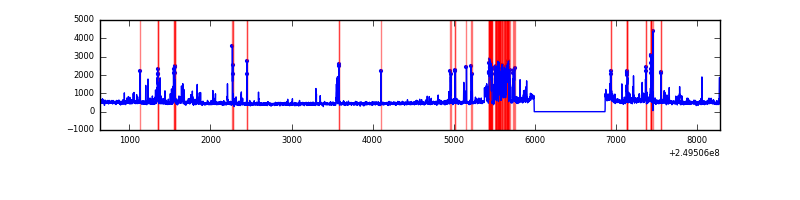 |
| C | 7648 | 6774 | 0 | 0 | 0.00% | 0.00% | 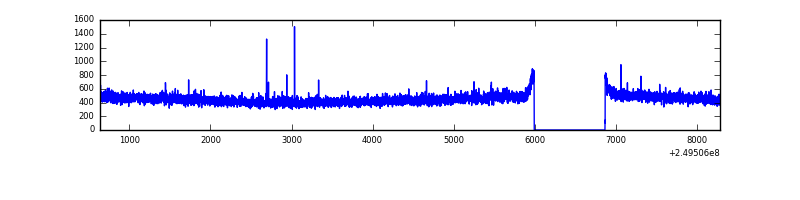 |
| D | 7648 | 6774 | 233 | 233 | 3.05% | 3.44% | 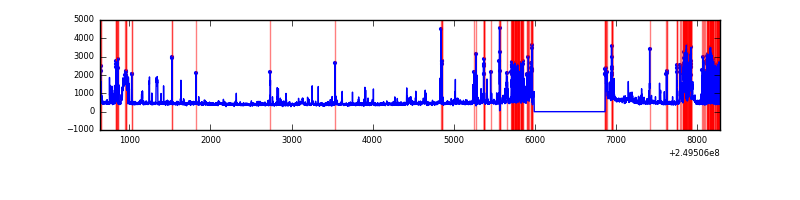 |
Top three noisy pixels from each quadrant. If the there are fewer than three noisy pixels in the level2.evt file, extra rows are filled as -1
| Pixel properties | Quadrant properties | ||||||
|---|---|---|---|---|---|---|---|
| Quadrant | DetID | PixID | Counts | Sigma | Mean | Median | Sigma |
| A | 8 | 15 | 1217484 | 7499.33 | 795 | 777 | 162.2 |
| A | 1 | 162 | 112273 | 687.22 | 795 | 777 | 162.2 |
| A | 1 | 178 | 58249 | 354.24 | 795 | 777 | 162.2 |
| B | 4 | 239 | 578199 | 3800.2 | 788 | 769 | 151.9 |
| B | 3 | 64 | 117085 | 765.5 | 788 | 769 | 151.9 |
| B | 10 | 245 | 73949 | 481.61 | 788 | 769 | 151.9 |
| C | 14 | 234 | 5884 | 28.07 | 779 | 781 | 181.8 |
| C | 13 | 61 | 5596 | 26.48 | 779 | 781 | 181.8 |
| C | 12 | 4 | 2500 | 9.46 | 779 | 781 | 181.8 |
| D | 1 | 52 | 847236 | 4561.99 | 762 | 740 | 185.6 |
| D | 7 | 80 | 240611 | 1292.73 | 762 | 740 | 185.6 |
| D | 13 | 104 | 61780 | 328.96 | 762 | 740 | 185.6 |
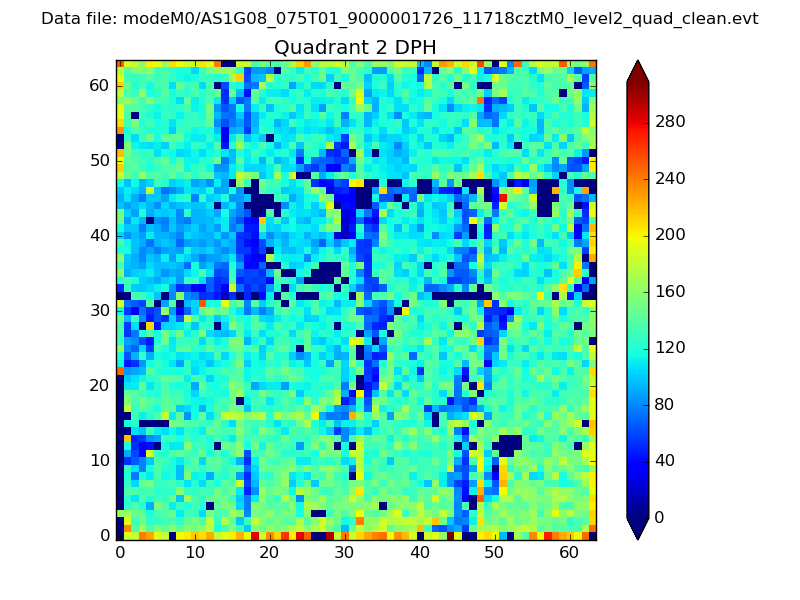
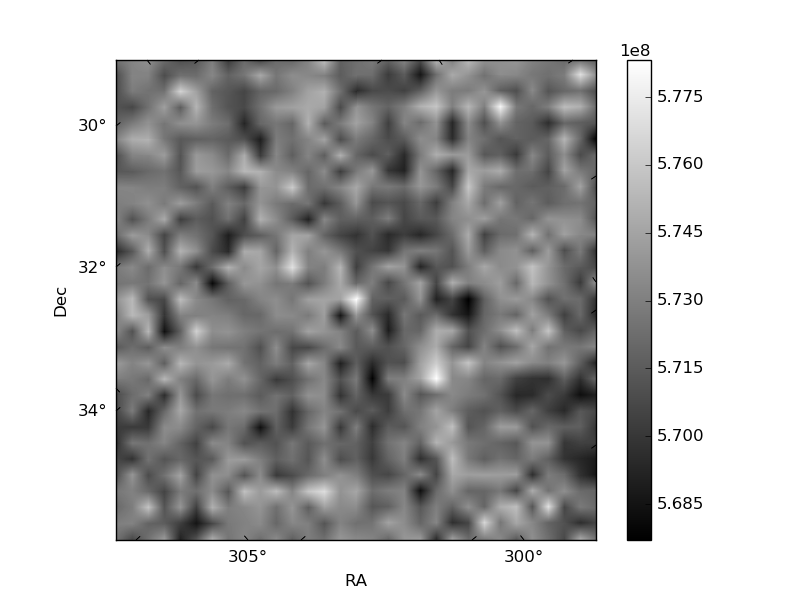
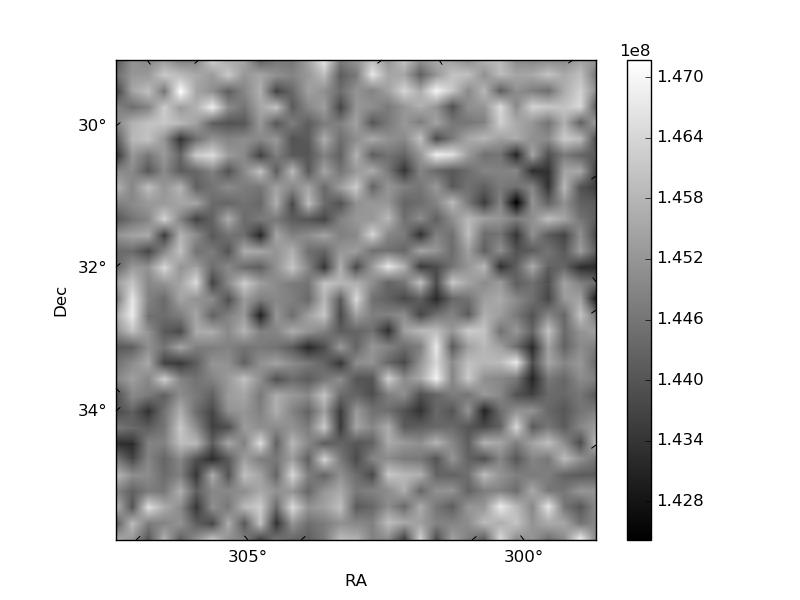
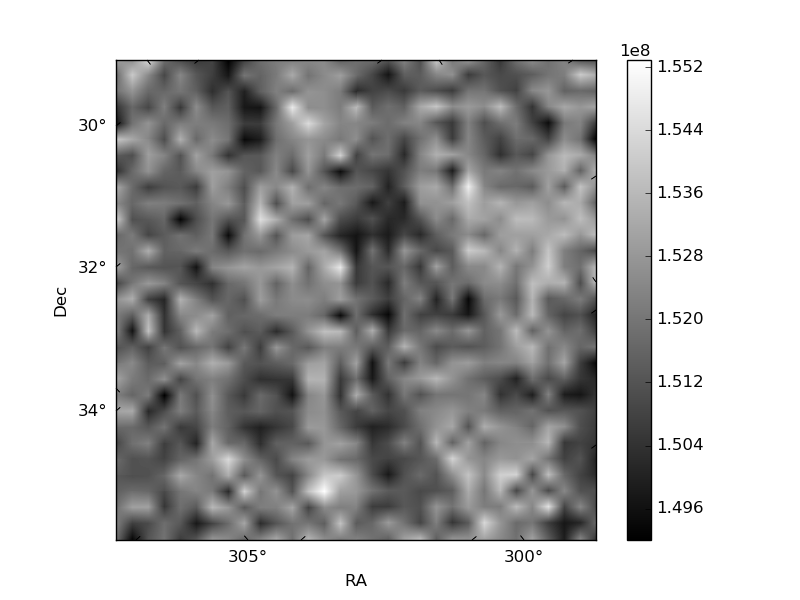
Histogram calculated using DETX and DETY for each event in the final _common_clean file
| Quadrant A | 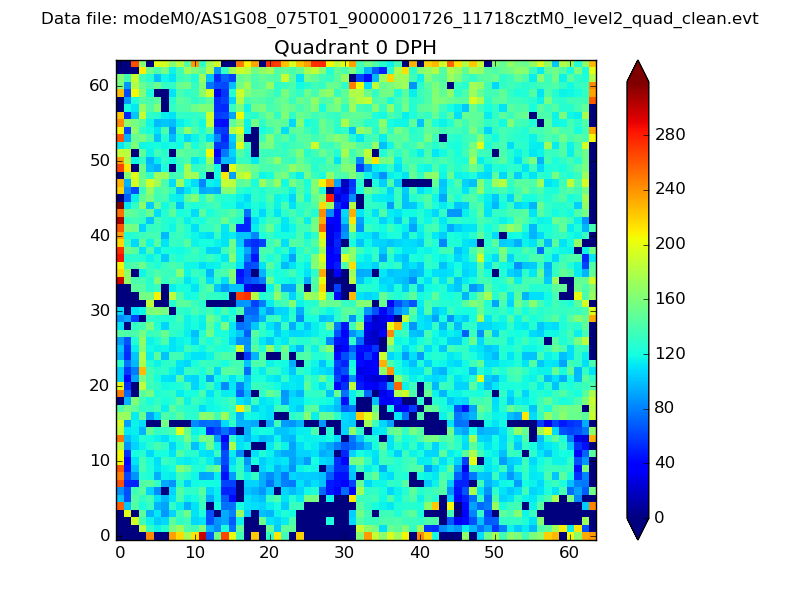 |
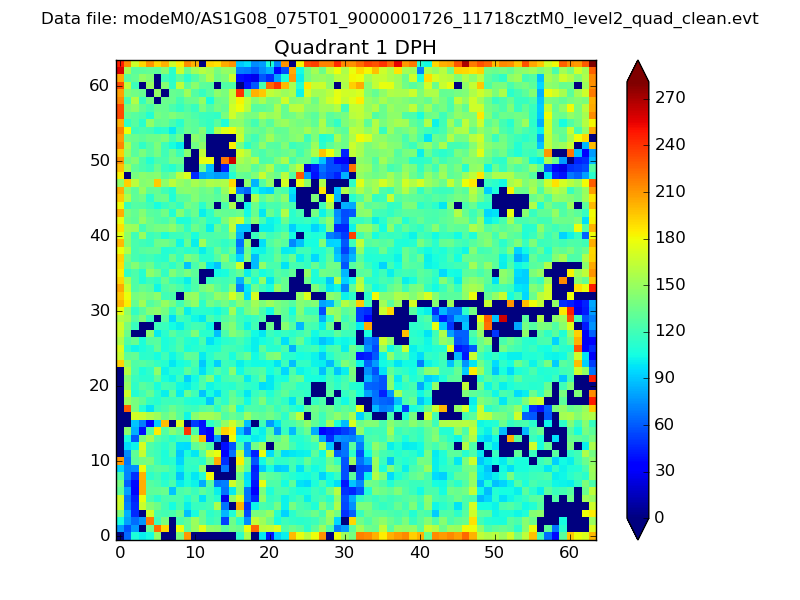 |
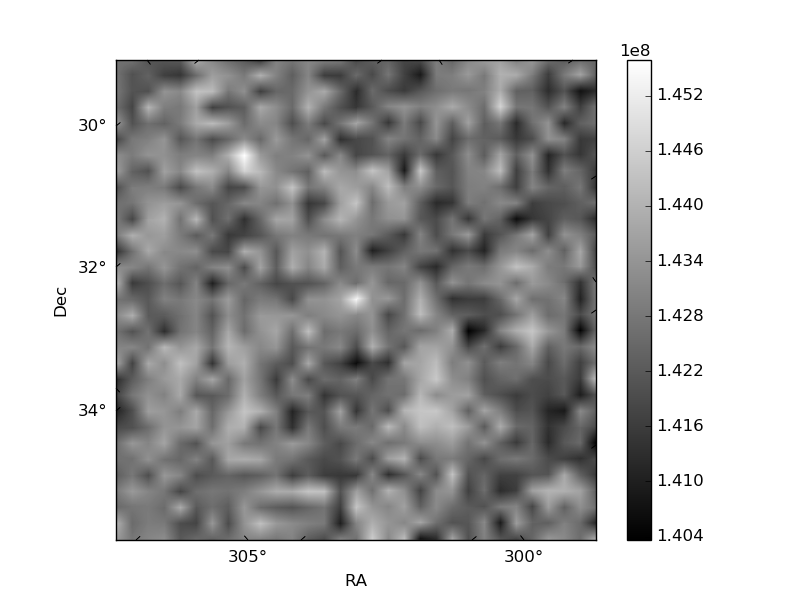
Quadrant B |
|---|---|---|---|
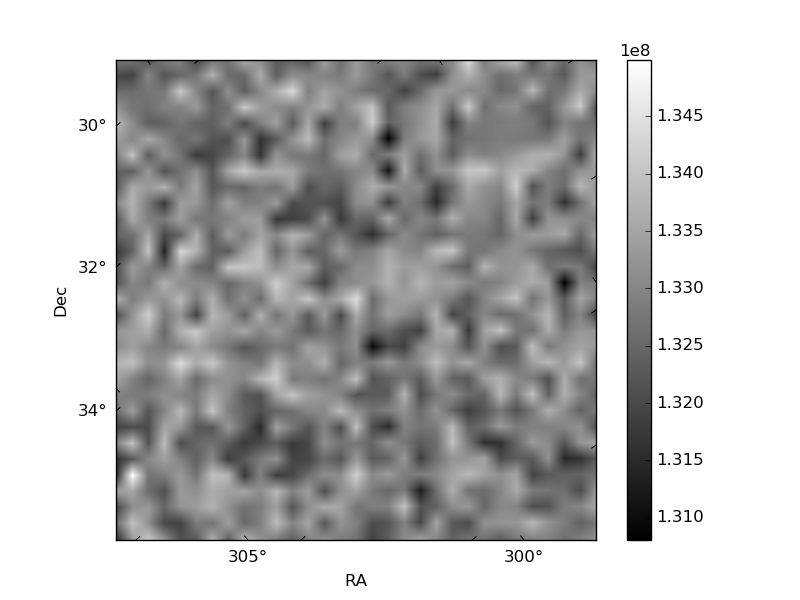
| Quadrant D | 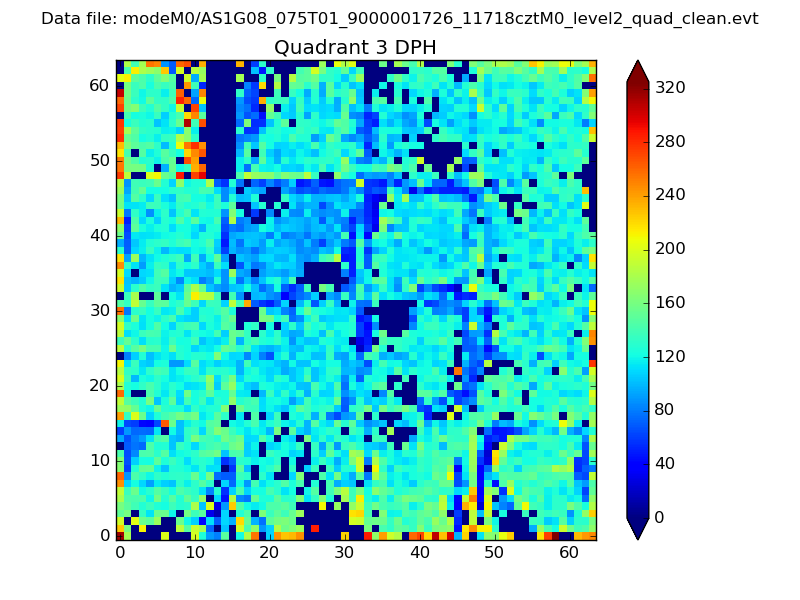 |
 |
Quadrant C |
| Plot type | Count rate plots | Images |
|---|---|---|
| Comparison with Poisson distribution Blue bars denote a histogram of data divided into 1 sec bins. Red curve is a Poisson curve with rate = median count rate of data. |
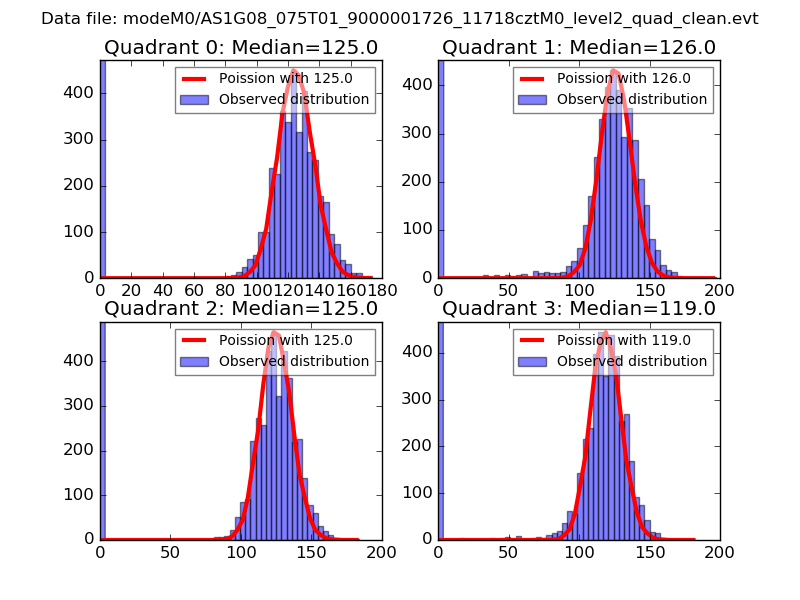 |
 |
| Quadrant-wise count rates Data is divided into 100 sec bins |
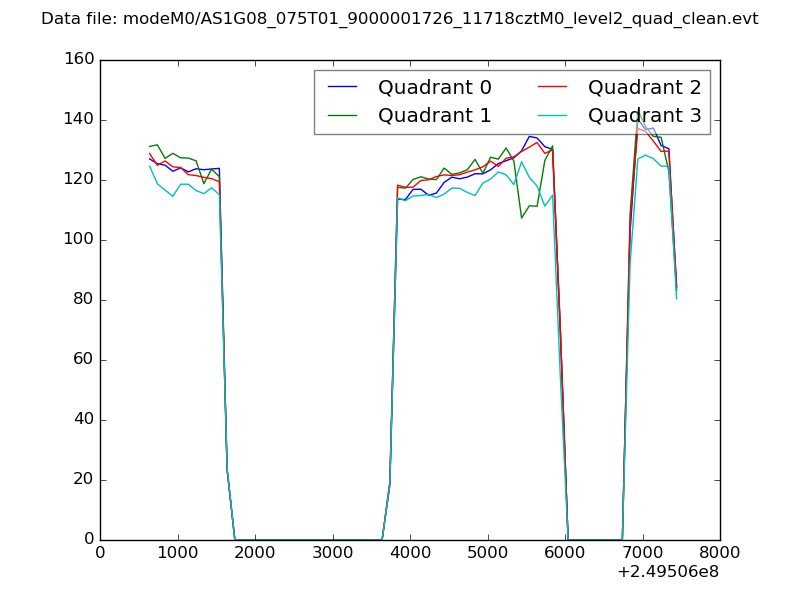 |
|
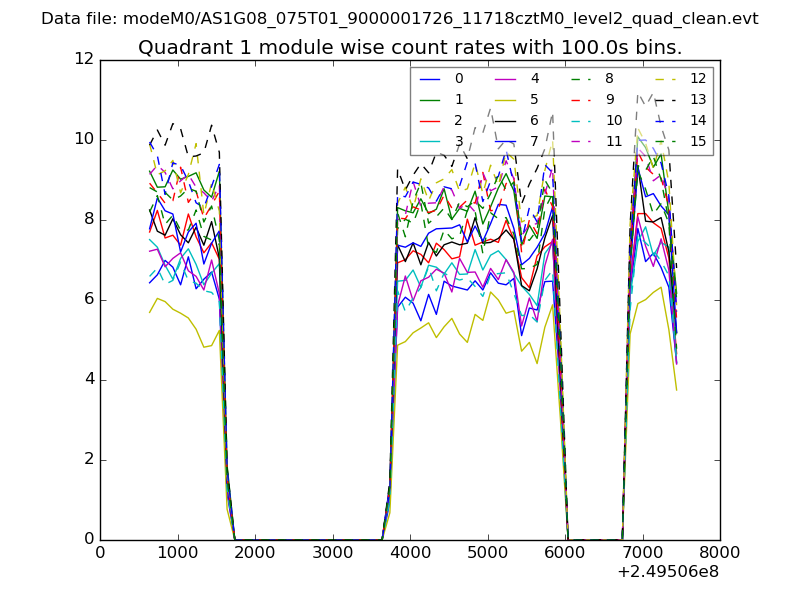
| Module-wise count rates for Quadrant A Data is divided into 100 sec bins |
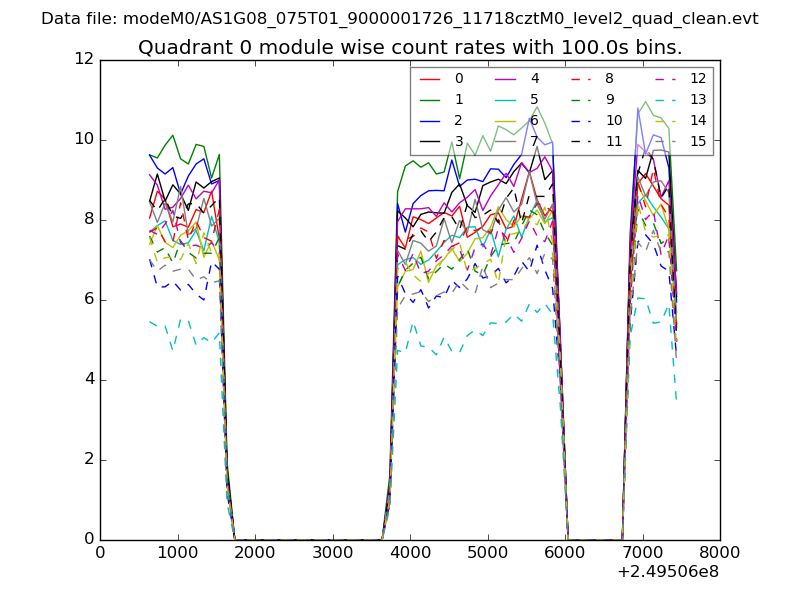 |
 |
| Module-wise count rates for Quadrant B Data is divided into 100 sec bins |
 |
 |
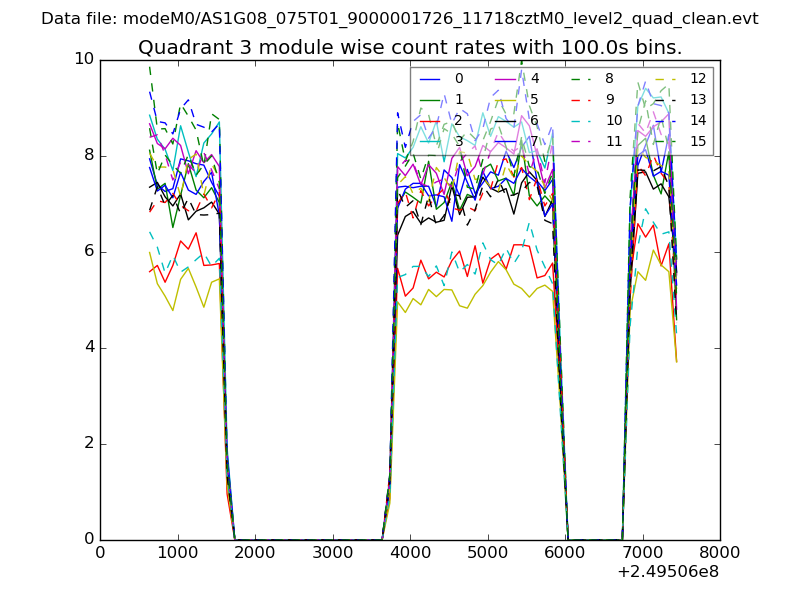
| Module-wise count rates for Quadrant C Data is divided into 100 sec bins |
 |
 |
| Module-wise count rates for Quadrant D Data is divided into 100 sec bins |
 |
 |
| Parameter | Plot |
|---|---|
| CZT HV Monitor | 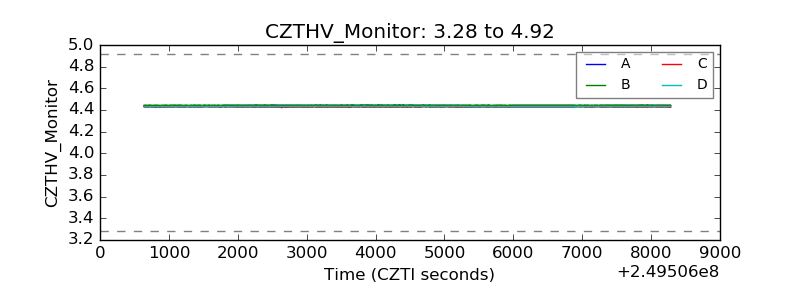 |
| D_VDD | 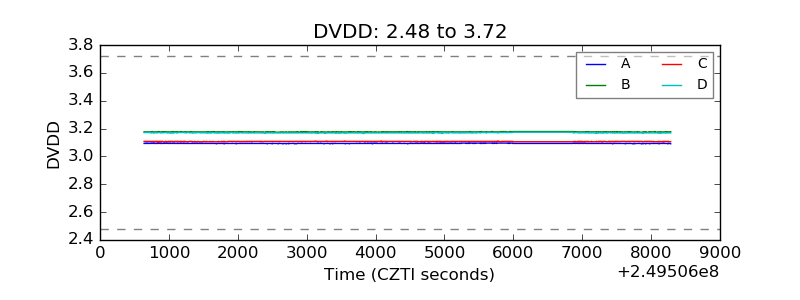 |
| Temperature 1 |  |
| Veto HV Monitor | 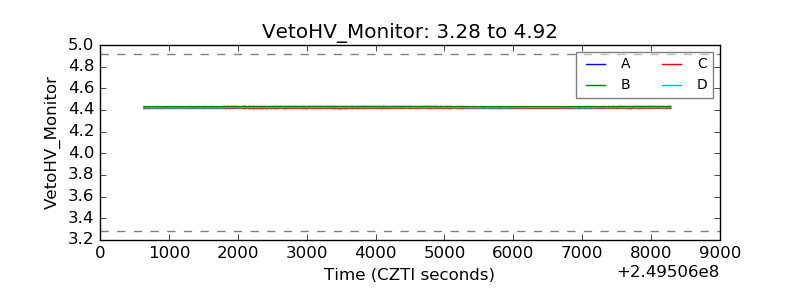 |
| Veto LLD | 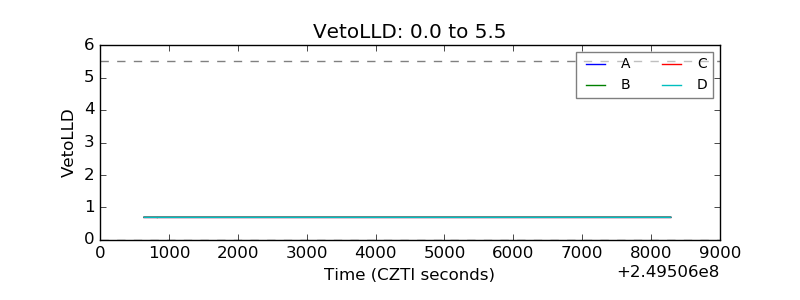 |
| Alpha Counter | 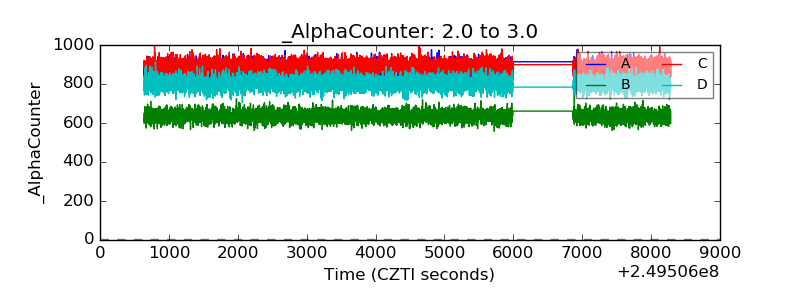 |
| _CPM_Rate | 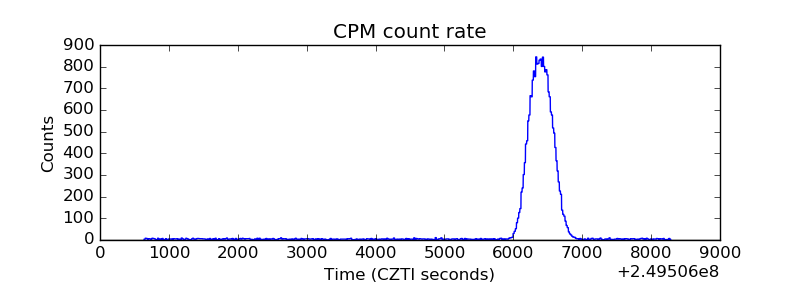 |
| CZT Counter | 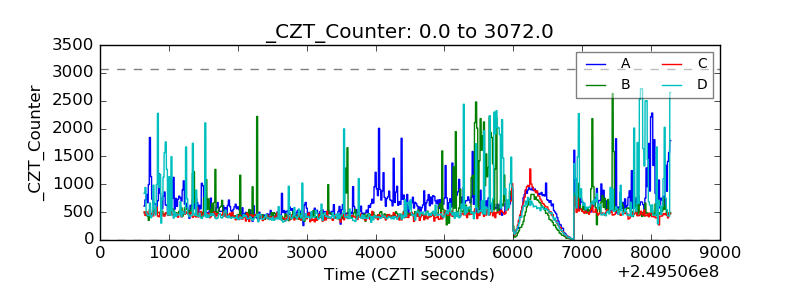 |
| +2.5 Volts monitor |  |
| +5 Volts monitor |  |
| _ROLL_ROT | 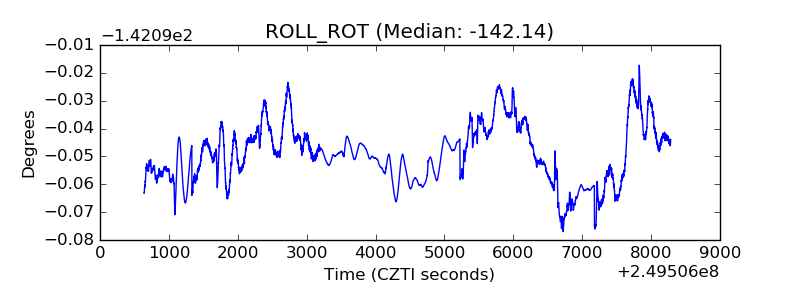 |
| _Roll_DEC | 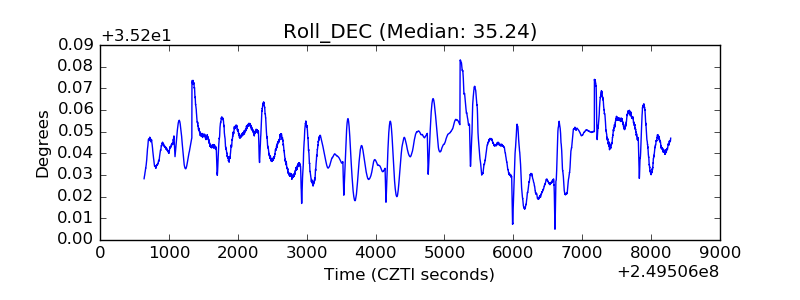 |
| _Roll_RA | 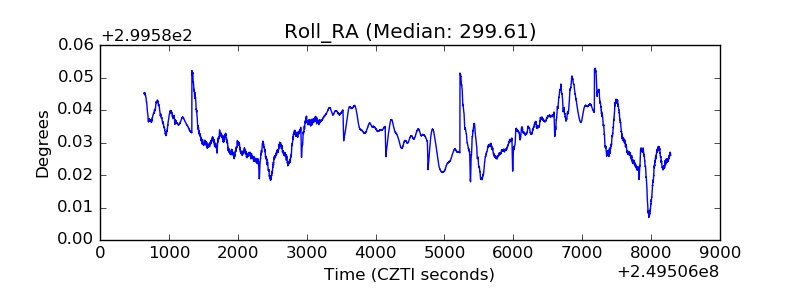 |
| Veto Counter | 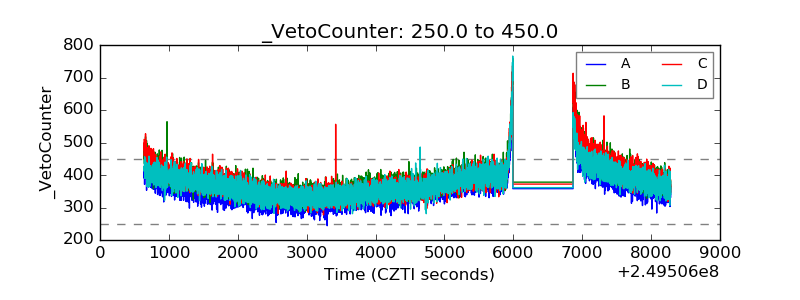 |