| Param | Original file | Final file |
|---|---|---|
| Filename | modeM0/AS1G08_075T01_9000001726_11721cztM0_level2.evt | modeM0/AS1G08_075T01_9000001726_11721cztM0_level2_quad_clean.evt |
| Size (bytes) | 358,369,920 | 58,368,960 |
| Size | 341.8 MB | 55.7 MB |
| Events in quadrant A | 2,837,175 | 358,711 |
| Events in quadrant B | 2,872,638 | 359,690 |
| Events in quadrant C | 2,237,367 | 358,135 |
| Events in quadrant D | 2,568,367 | 342,759 |
| Mode M0 | |||
|---|---|---|---|
| Quadrant | BADHDUFLAG | Total packets | Discarded packets |
| A | 0 | 11563 | 1 |
| B | 0 | 11737 | 1 |
| C | 0 | 10059 | 1 |
| D | 0 | 10700 | 1 |
| Mode M9 | |||
|---|---|---|---|
| Quadrant | BADHDUFLAG | Total packets | Discarded packets |
| A | 0 | 7 | 0 |
| B | 0 | 7 | 0 |
| C | 0 | 7 | 0 |
| D | 0 | 8 | 0 |
| Mode SS | |||
|---|---|---|---|
| Quadrant | BADHDUFLAG | Total packets | Discarded packets |
| A | 0 | 100 | 0 |
| B | 0 | 100 | 0 |
| C | 0 | 100 | 0 |
| D | 0 | 100 | 0 |
| Quadrant | Total seconds | Saturated seconds | Saturation percentage |
|---|---|---|---|
| A | 4956 | 35 | 0.706215% |
| B | 4956 | 103 | 2.078289% |
| C | 4956 | 5 | 0.100888% |
| D | 4956 | 5 | 0.100888% |
Noise dominated data is calculated using 1-second bins in cleaned event files. If a bin has >2000 counts, and if more than 50% of those come from <1% of pixels, then it is considered to be noise-dominated and hence unusable.
| Quadrant | # 1 sec bins | Bins with >0 counts | Bins with >2000 counts | High rate bins dominated by noise | Noise dominated (total time) | Noise dominated (detector-on time) | Marked lightcurve |
|---|---|---|---|---|---|---|---|
| A | 4957 | 4957 | 9 | 9 | 0.18% | 0.18% | 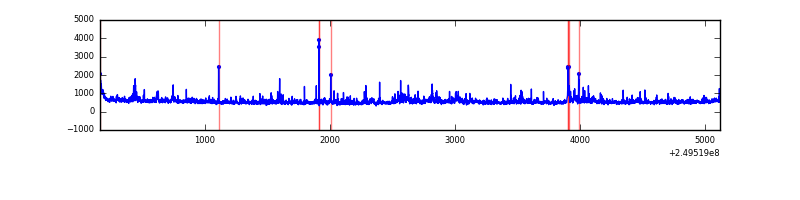 |
| B | 4957 | 4957 | 54 | 54 | 1.09% | 1.09% | 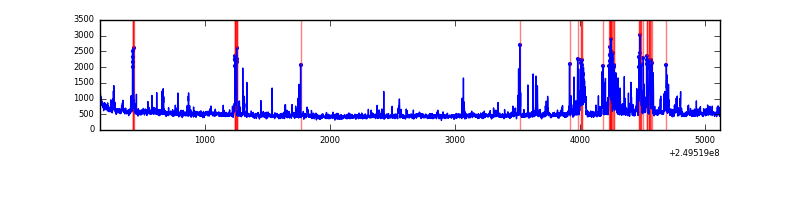 |
| C | 4957 | 4957 | 0 | 0 | 0.00% | 0.00% | 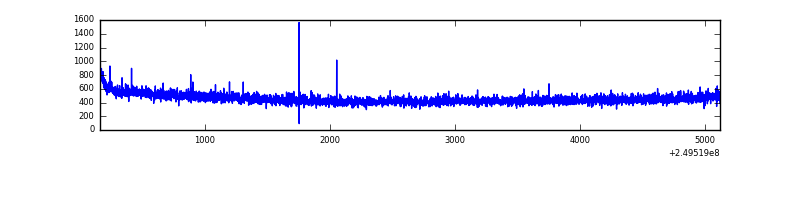 |
| D | 4957 | 4957 | 2 | 2 | 0.04% | 0.04% | 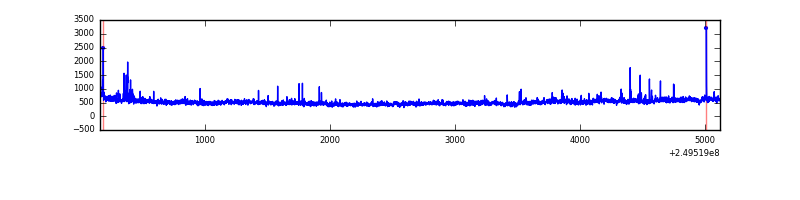 |
Top three noisy pixels from each quadrant. If the there are fewer than three noisy pixels in the level2.evt file, extra rows are filled as -1
| Pixel properties | Quadrant properties | ||||||
|---|---|---|---|---|---|---|---|
| Quadrant | DetID | PixID | Counts | Sigma | Mean | Median | Sigma |
| A | 8 | 15 | 203310 | 1687.27 | 589 | 579 | 120.2 |
| A | 1 | 162 | 106985 | 885.58 | 589 | 579 | 120.2 |
| A | 1 | 178 | 59517 | 490.52 | 589 | 579 | 120.2 |
| B | 4 | 239 | 344065 | 3066.56 | 588 | 575 | 112.0 |
| B | 10 | 245 | 91582 | 812.48 | 588 | 575 | 112.0 |
| B | 15 | 204 | 62679 | 554.44 | 588 | 575 | 112.0 |
| C | 13 | 61 | 4272 | 27.78 | 573 | 577 | 133.0 |
| C | 12 | 4 | 1575 | 7.5 | 573 | 577 | 133.0 |
| C | 3 | 202 | 1436 | 6.46 | 573 | 577 | 133.0 |
| D | 8 | 195 | 314826 | 2288.5 | 569 | 554 | 137.3 |
| D | 1 | 52 | 34508 | 247.25 | 569 | 554 | 137.3 |
| D | 2 | 234 | 19930 | 141.09 | 569 | 554 | 137.3 |
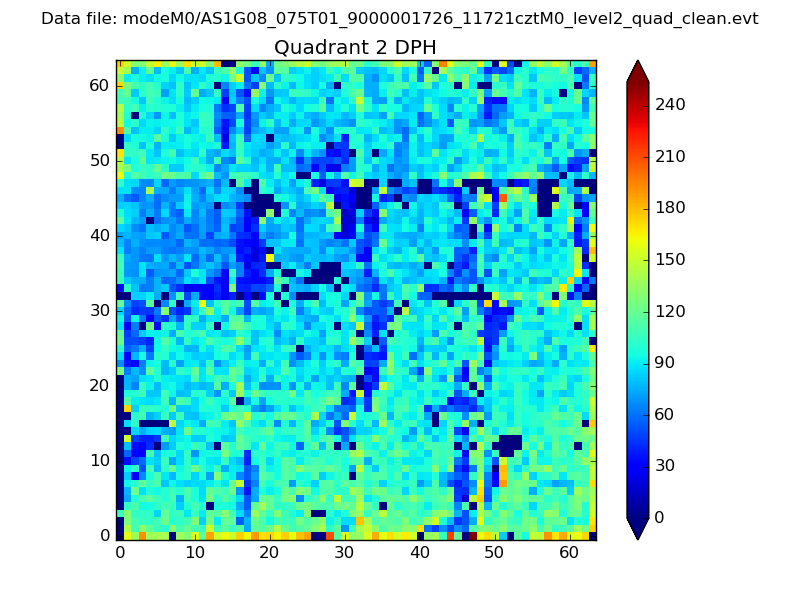
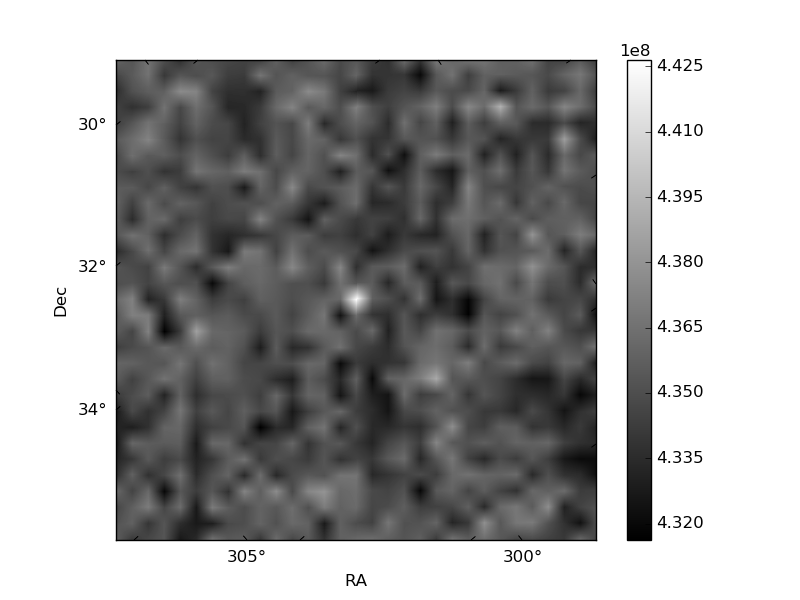
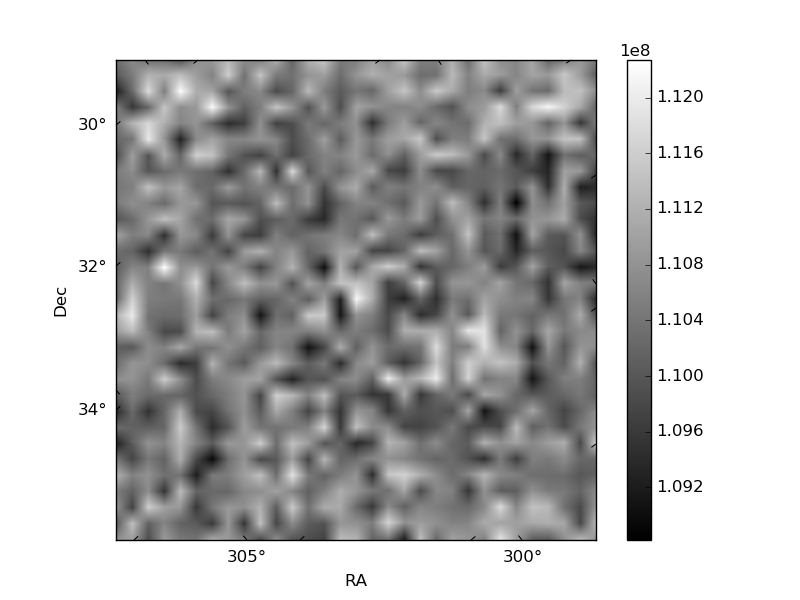
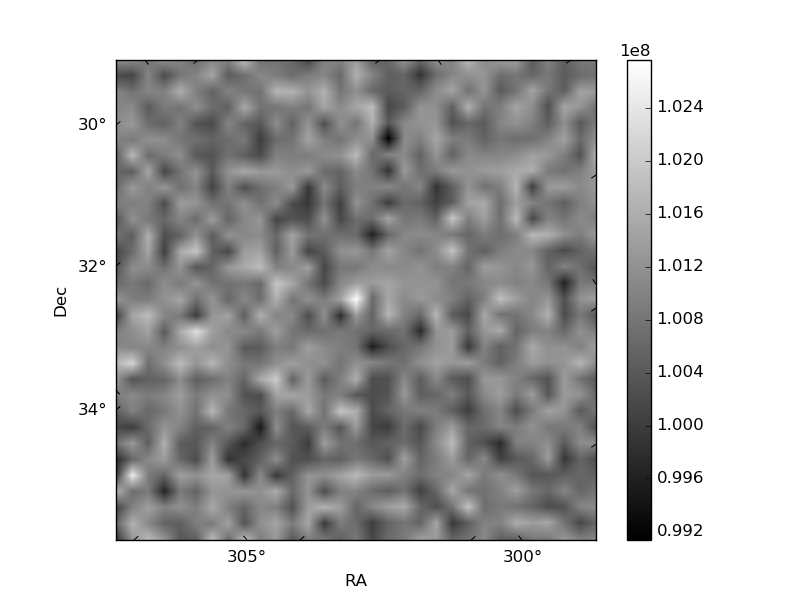
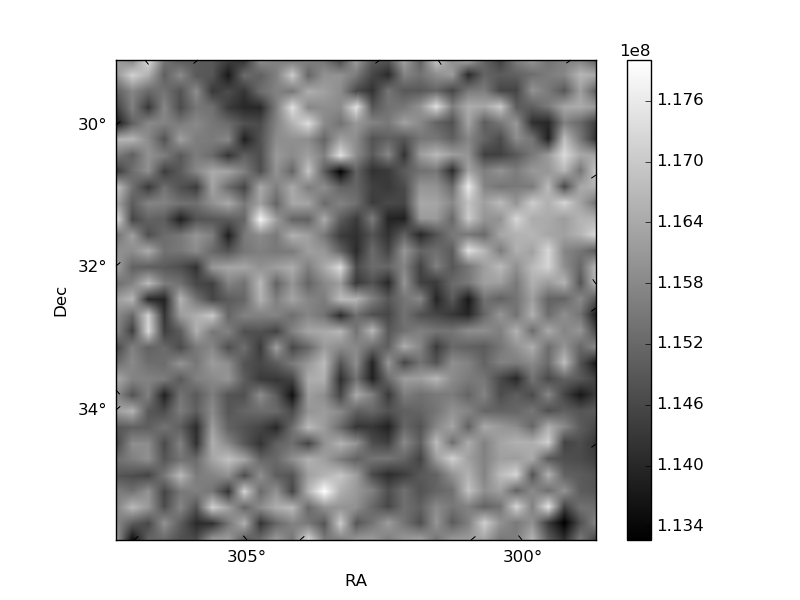
Histogram calculated using DETX and DETY for each event in the final _common_clean file
| Quadrant A | 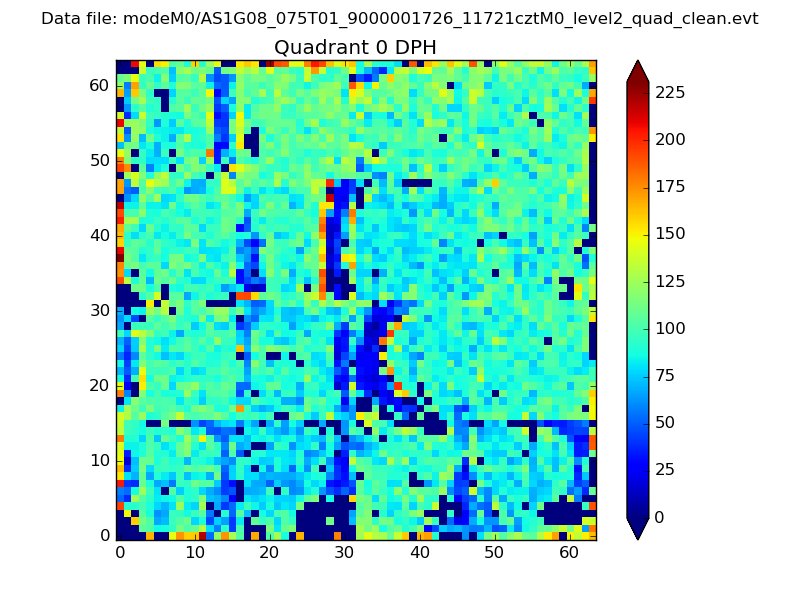 |
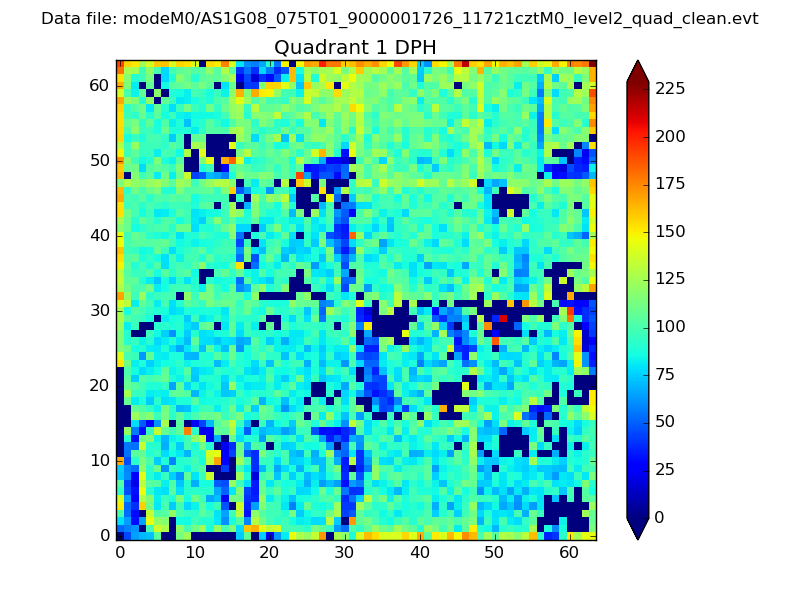 |
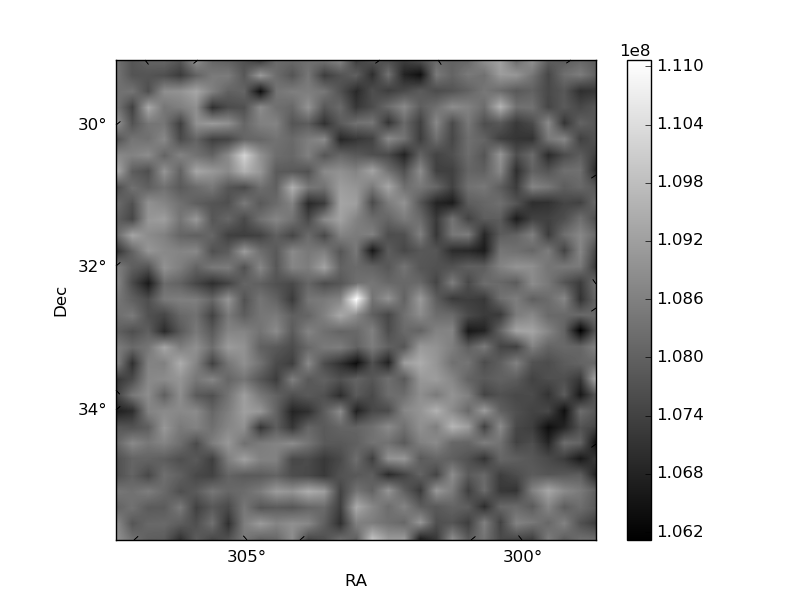
Quadrant B |
|---|---|---|---|
| Quadrant D | 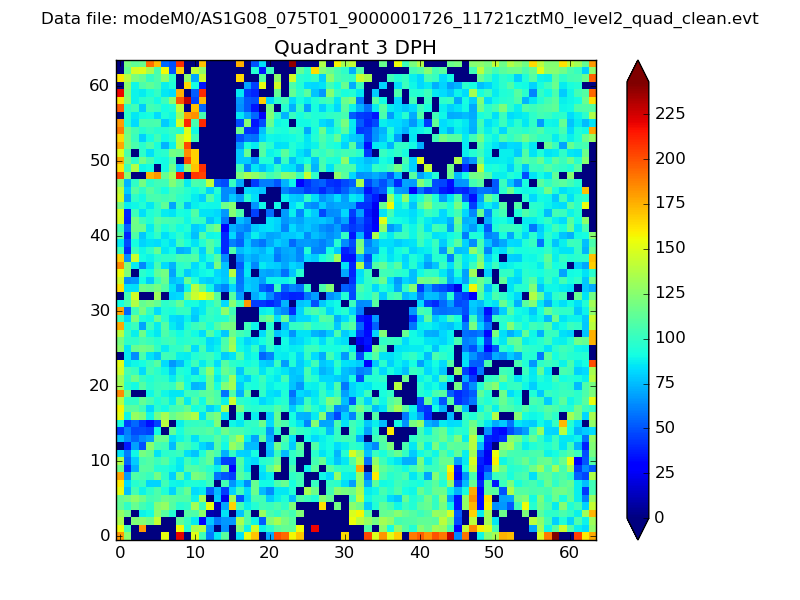 |
 |
Quadrant C |
| Plot type | Count rate plots | Images |
|---|---|---|
| Comparison with Poisson distribution Blue bars denote a histogram of data divided into 1 sec bins. Red curve is a Poisson curve with rate = median count rate of data. |
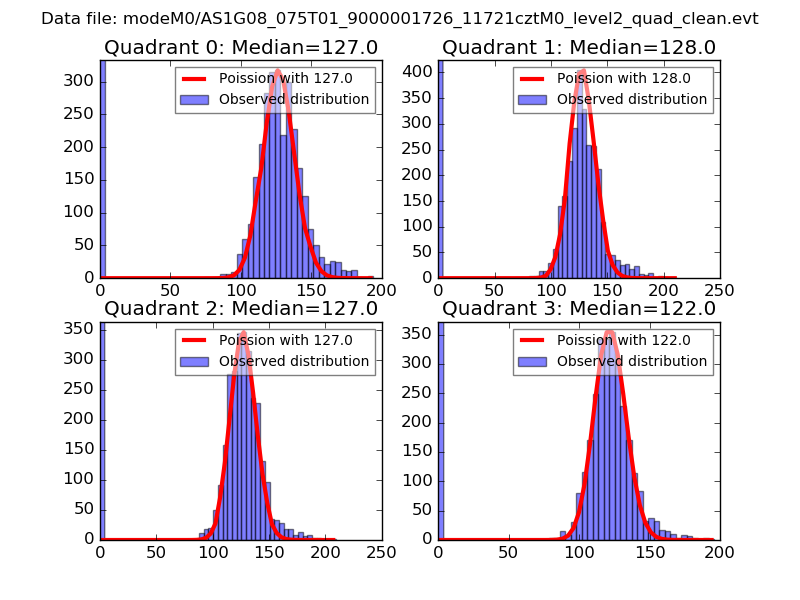 |
 |
| Quadrant-wise count rates Data is divided into 100 sec bins |
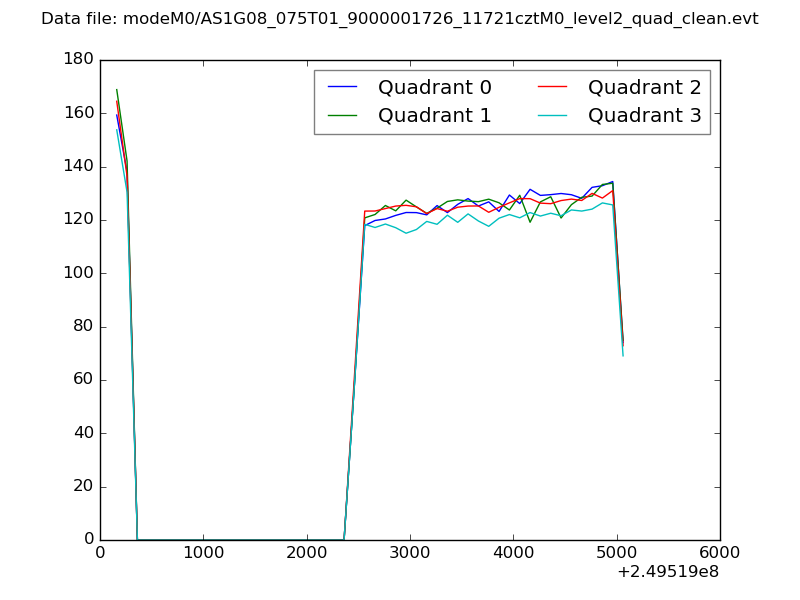 |
|
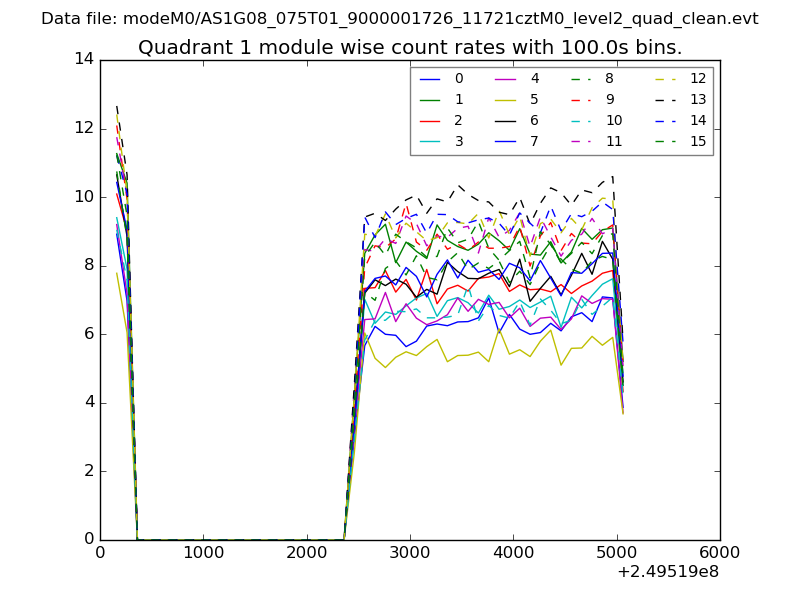
| Module-wise count rates for Quadrant A Data is divided into 100 sec bins |
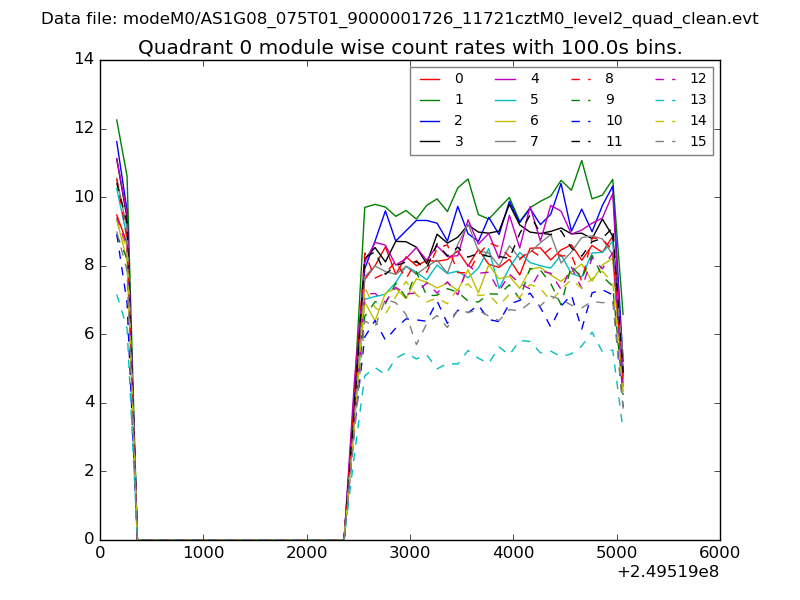 |
 |
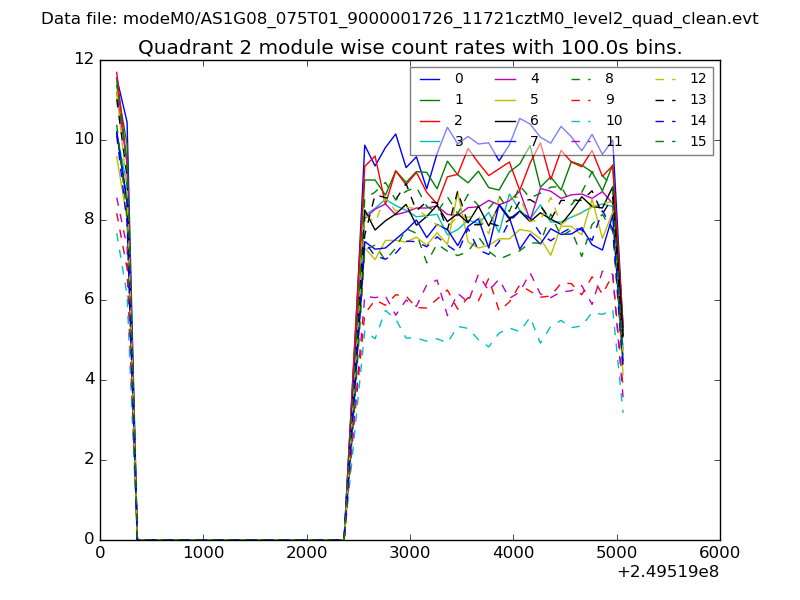
| Module-wise count rates for Quadrant B Data is divided into 100 sec bins |
 |
 |
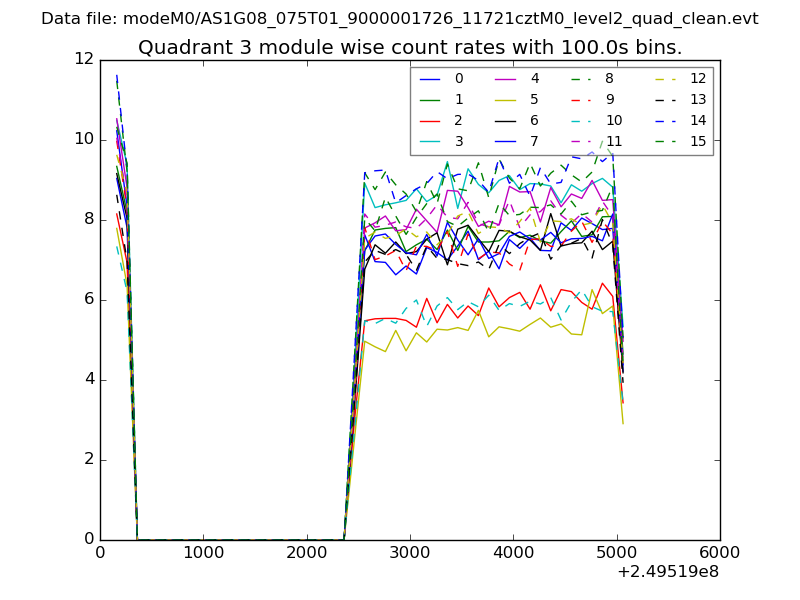
| Module-wise count rates for Quadrant C Data is divided into 100 sec bins |
 |
 |
| Module-wise count rates for Quadrant D Data is divided into 100 sec bins |
 |
 |
| Parameter | Plot |
|---|---|
| CZT HV Monitor | 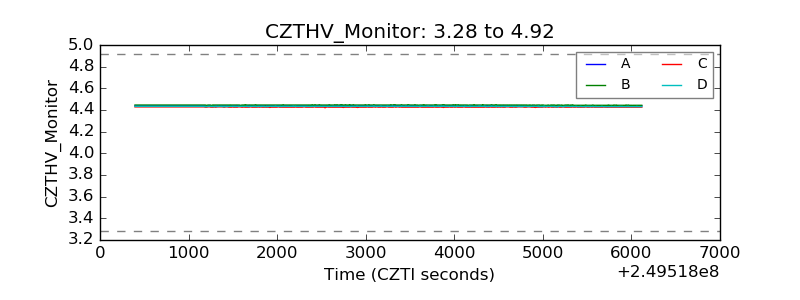 |
| D_VDD | 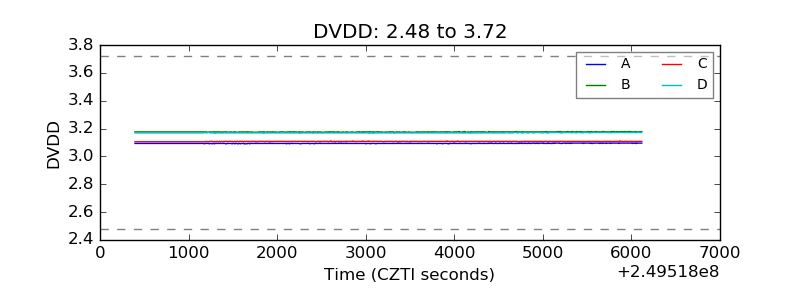 |
| Temperature 1 | 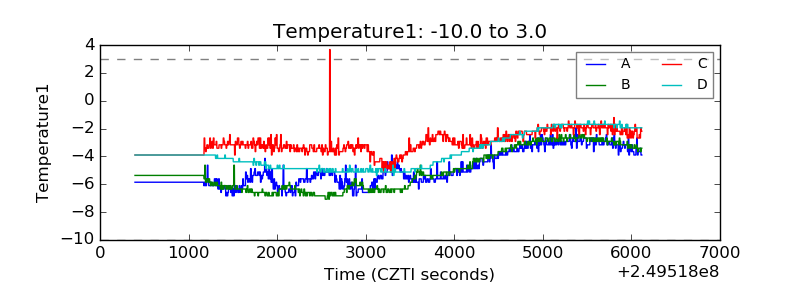 |
| Veto HV Monitor | 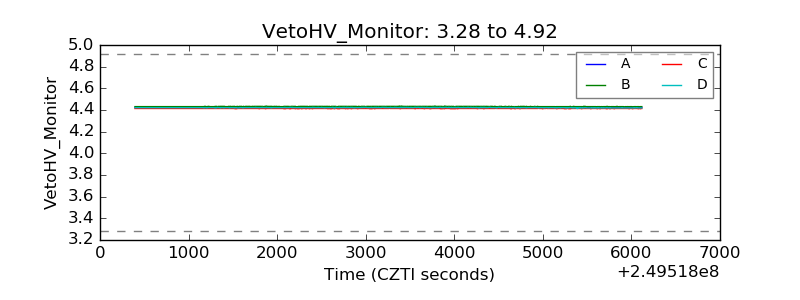 |
| Veto LLD | 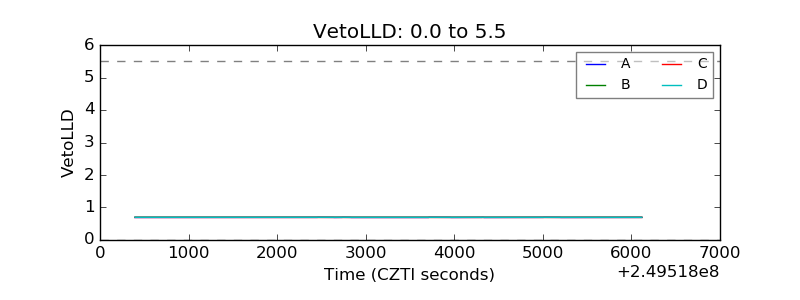 |
| Alpha Counter | 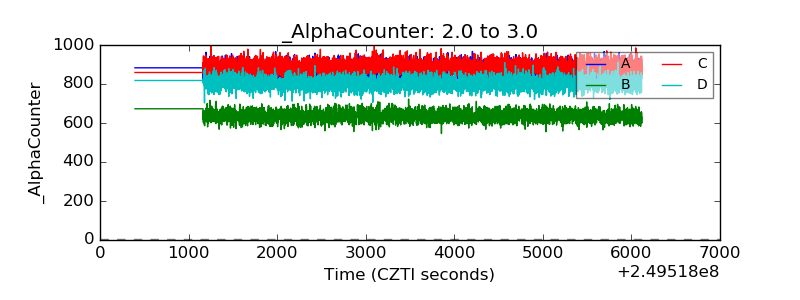 |
| _CPM_Rate | 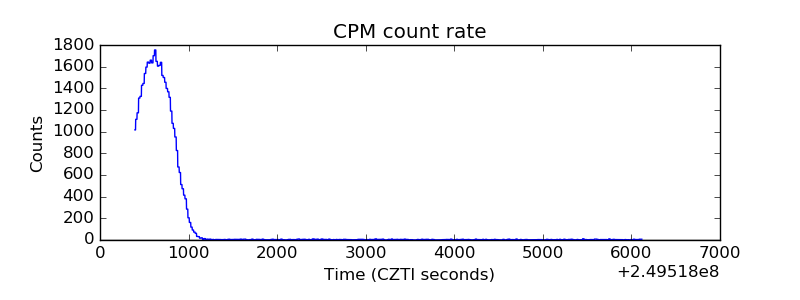 |
| CZT Counter | 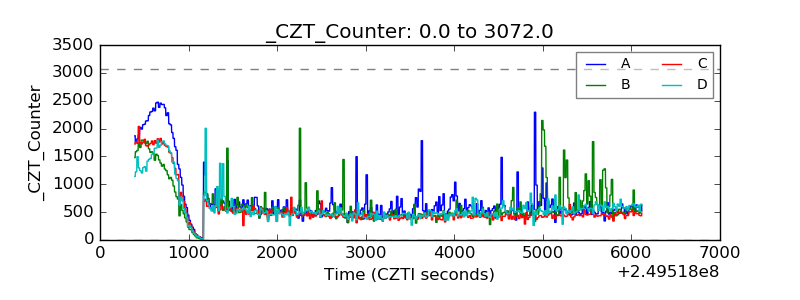 |
| +2.5 Volts monitor |  |
| +5 Volts monitor |  |
| _ROLL_ROT | 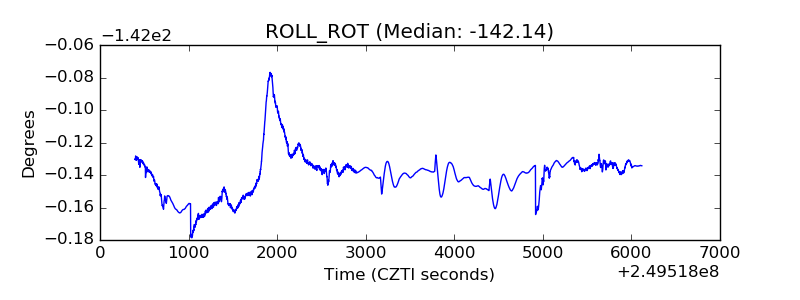 |
| _Roll_DEC |  |
| _Roll_RA | 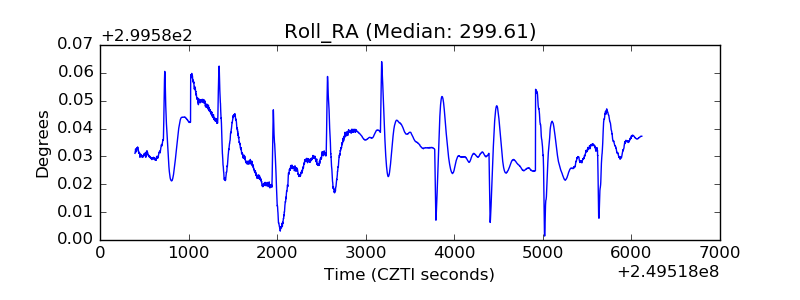 |
| Veto Counter | 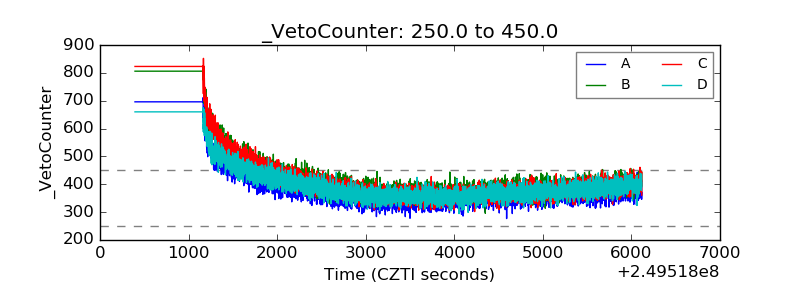 |