| Param | Original file | Final file |
|---|---|---|
| Filename | modeM0/AS1G08_006T01_9000001728cztM0_level2.fits | modeM0/AS1G08_006T01_9000001728cztM0_level2_quad_clean.evt |
| Size (bytes) | 342,659,520 | 359,907,840 |
| Size | 326.8 MB | 343.2 MB |
| Events in quadrant A | 2,050,196 | 2,102,119 |
| Events in quadrant B | 2,018,314 | 2,212,015 |
| Events in quadrant C | 2,118,698 | 2,239,776 |
| Events in quadrant D | 1,791,772 | 1,949,130 |
| Mode SS | |||
|---|---|---|---|
| Quadrant | BADHDUFLAG | Total packets | Discarded packets |
| A | 0 | 710 | 0 |
| B | 0 | 710 | 0 |
| C | 0 | 710 | 0 |
| D | 0 | 710 | 0 |
| Mode M9 | |||
|---|---|---|---|
| Quadrant | BADHDUFLAG | Total packets | Discarded packets |
| A | 0 | 64 | 0 |
| B | 0 | 64 | 0 |
| C | 0 | 64 | 0 |
| D | 0 | 64 | 0 |
| Mode M0 | |||
|---|---|---|---|
| Quadrant | BADHDUFLAG | Total packets | Discarded packets |
| A | 0 | 114947 | 0 |
| B | 0 | 91049 | 0 |
| C | 0 | 71920 | 0 |
| D | 0 | 100581 | 0 |
| Quadrant | Total seconds | Saturated seconds | Saturation percentage |
|---|---|---|---|
| A | 34881 | 2939 | 8.425791% |
| B | 34881 | 1922 | 5.510163% |
| C | 34881 | 474 | 1.358906% |
| D | 34881 | 1958 | 5.613371% |
Noise dominated data is calculated using 1-second bins in cleaned event files. If a bin has >2000 counts, and if more than 50% of those come from <1% of pixels, then it is considered to be noise-dominated and hence unusable.
| Quadrant | # 1 sec bins | Bins with >0 counts | Bins with >2000 counts | High rate bins dominated by noise | Noise dominated (total time) | Noise dominated (detector-on time) | Marked lightcurve |
|---|---|---|---|---|---|---|---|
| A | 41205 | 34879 | 0 | 0 | 0.00% | 0.00% |  |
| B | 41205 | 34870 | 0 | 0 | 0.00% | 0.00% | 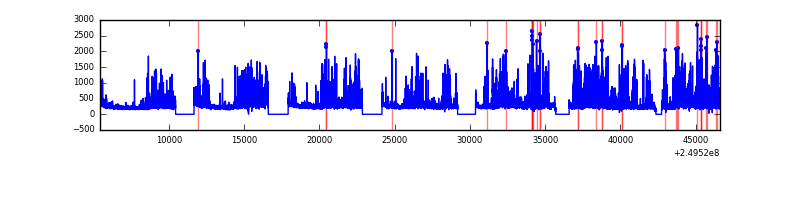 |
| C | 41205 | 34881 | 0 | 0 | 0.00% | 0.00% |  |
| D | 41205 | 34871 | 0 | 0 | 0.00% | 0.00% |  |
Top three noisy pixels from each quadrant. If the there are fewer than three noisy pixels in the level2.evt file, extra rows are filled as -1
| Pixel properties | Quadrant properties | ||||||
|---|---|---|---|---|---|---|---|
| Quadrant | DetID | PixID | Counts | Sigma | Mean | Median | Sigma |
| A | 0 | 29 | 2010 | 11.35 | 535 | 505 | 132.6 |
| A | 7 | 110 | 1690 | 8.94 | 535 | 505 | 132.6 |
| A | 9 | 19 | 1526 | 7.7 | 535 | 505 | 132.6 |
| B | 2 | 9 | 1644 | 10.81 | 535 | 516 | 104.3 |
| B | 5 | 128 | 1347 | 7.96 | 535 | 516 | 104.3 |
| B | 12 | 226 | 1299 | 7.5 | 535 | 516 | 104.3 |
| C | 1 | 80 | 1587 | 7.33 | 560 | 526 | 144.7 |
| C | 1 | 81 | 1562 | 7.16 | 560 | 526 | 144.7 |
| C | 12 | 241 | 1468 | 6.51 | 560 | 526 | 144.7 |
| D | 10 | 189 | 1300 | 6.19 | 511 | 471 | 134.0 |
| D | 7 | 3 | 1282 | 6.05 | 511 | 471 | 134.0 |
| D | 7 | 5 | 1267 | 5.94 | 511 | 471 | 134.0 |
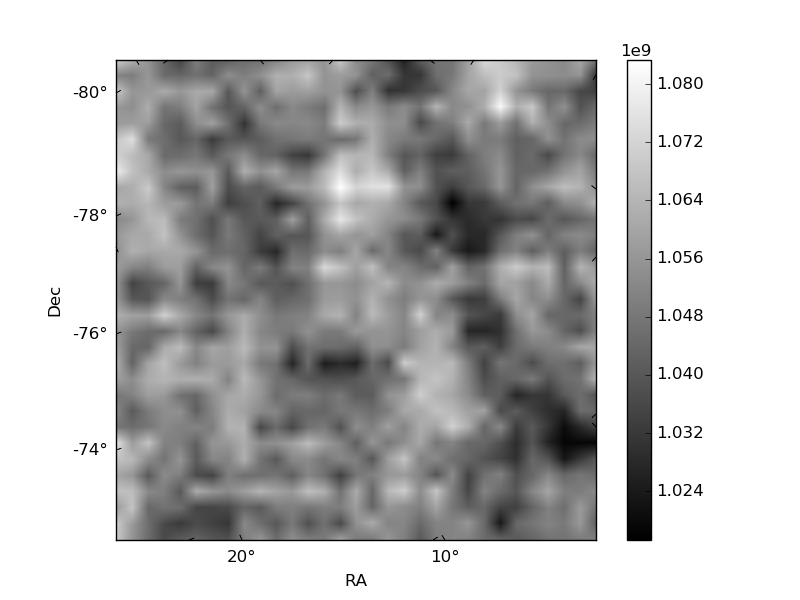
Histogram calculated using DETX and DETY for each event in the final _common_clean file
| Quadrant A | 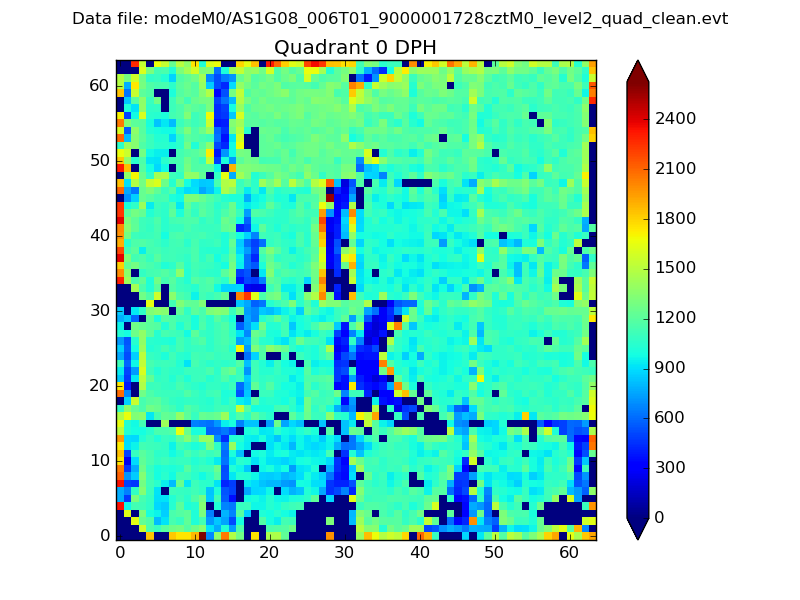 |
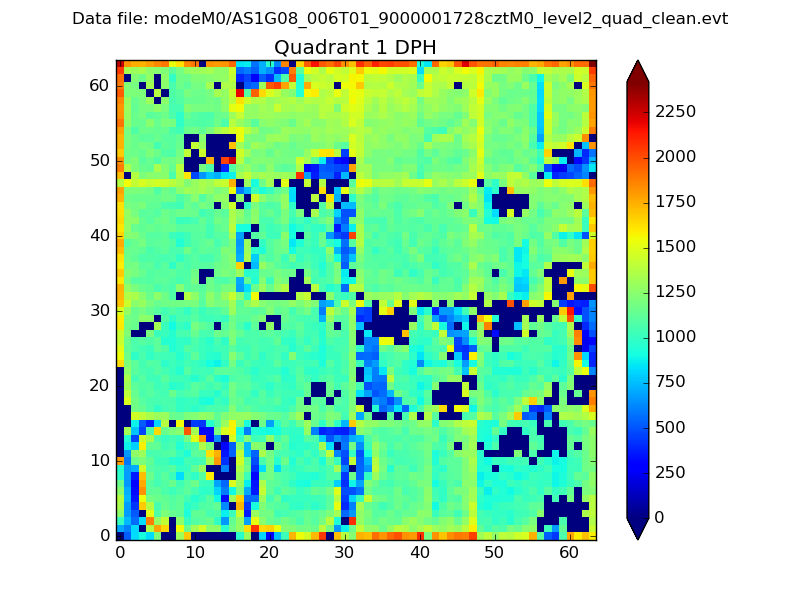 |
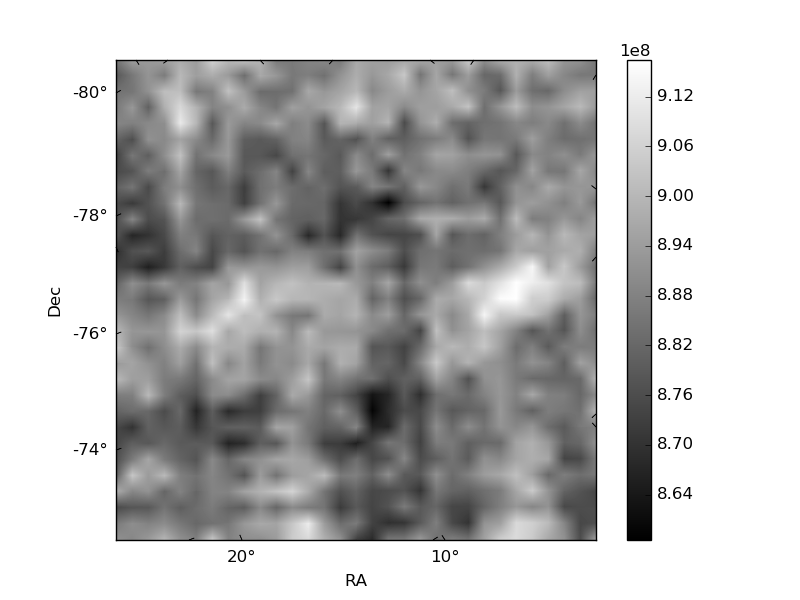
Quadrant B |
|---|---|---|---|
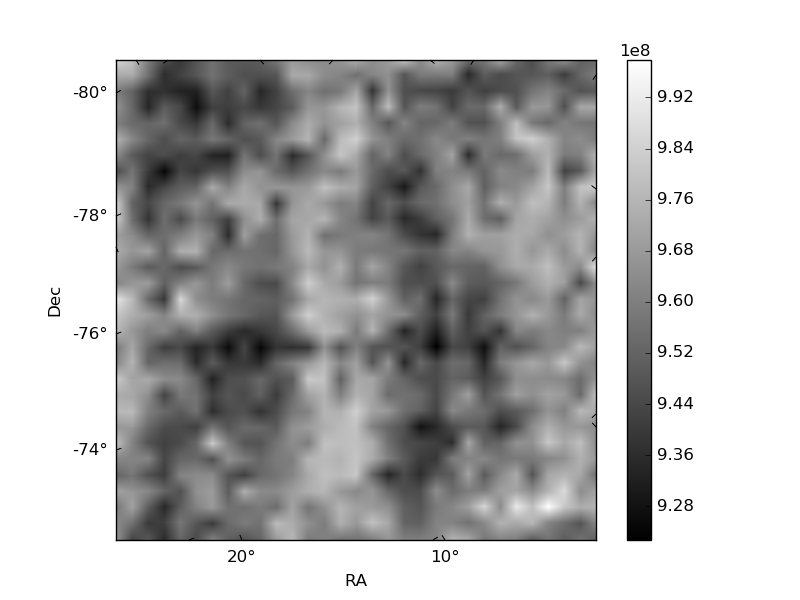
| Quadrant D | 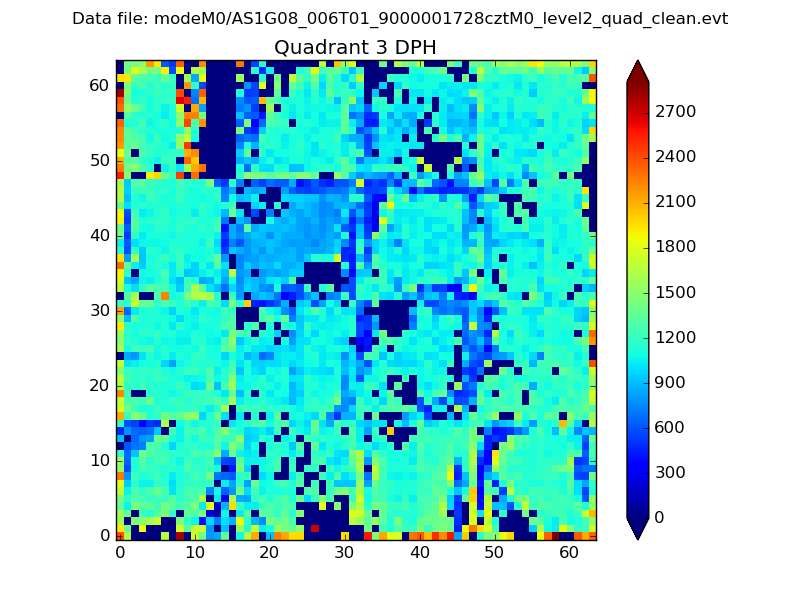 |
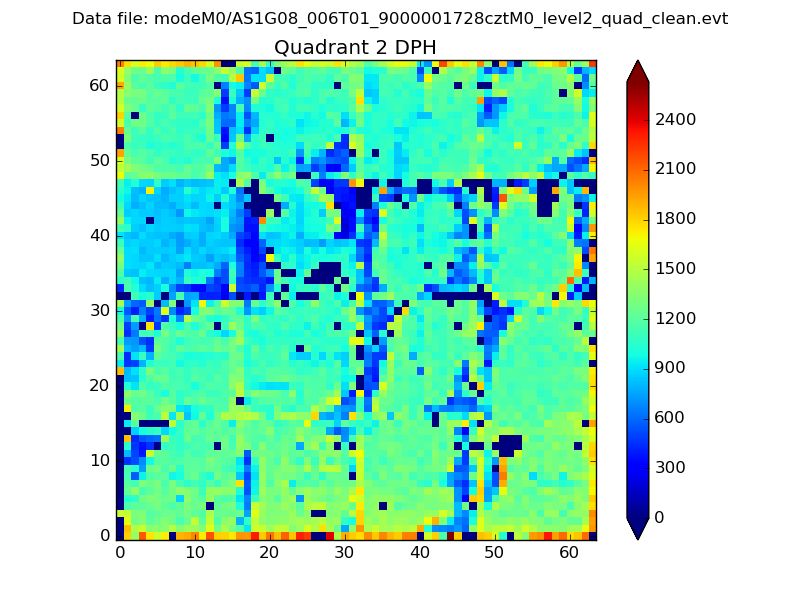 |
Quadrant C |
| Plot type | Count rate plots | Images |
|---|---|---|
| Comparison with Poisson distribution Blue bars denote a histogram of data divided into 1 sec bins. Red curve is a Poisson curve with rate = median count rate of data. |
 |
 |
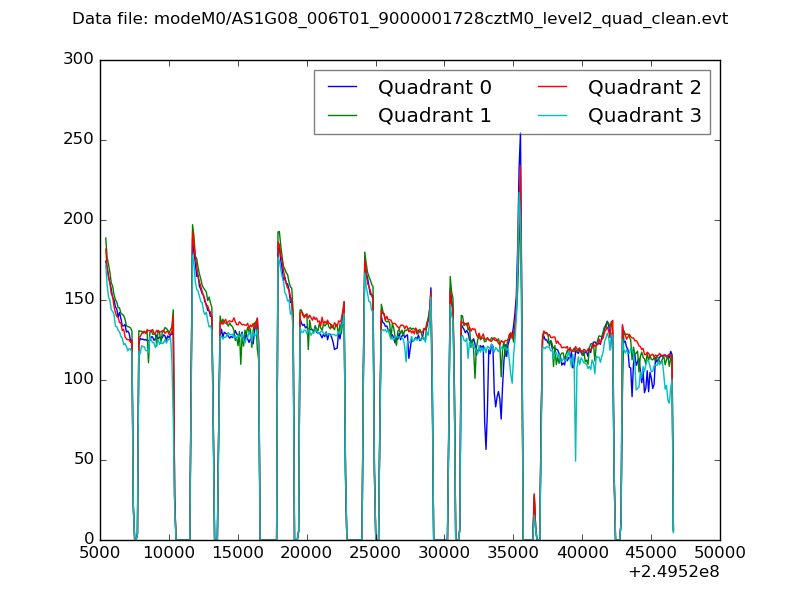
| Quadrant-wise count rates Data is divided into 100 sec bins |
 |
|
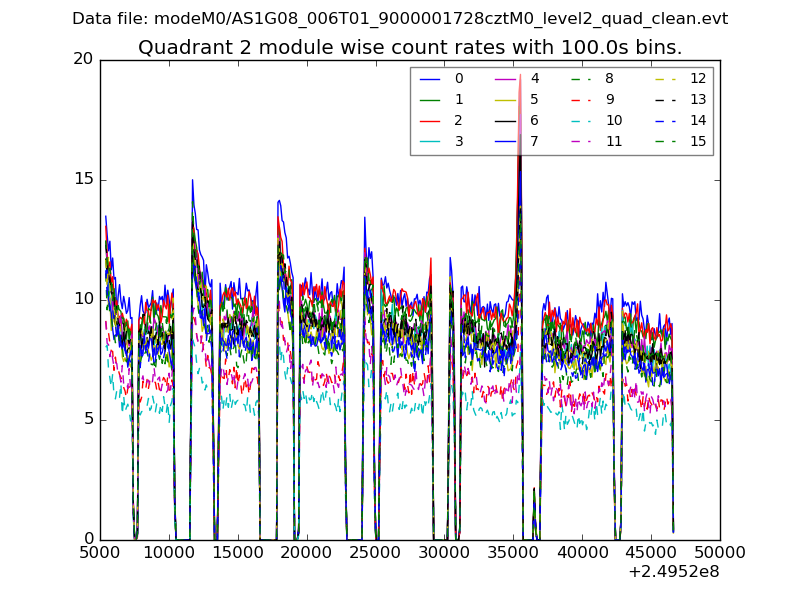
| Module-wise count rates for Quadrant A Data is divided into 100 sec bins |
 |
 |
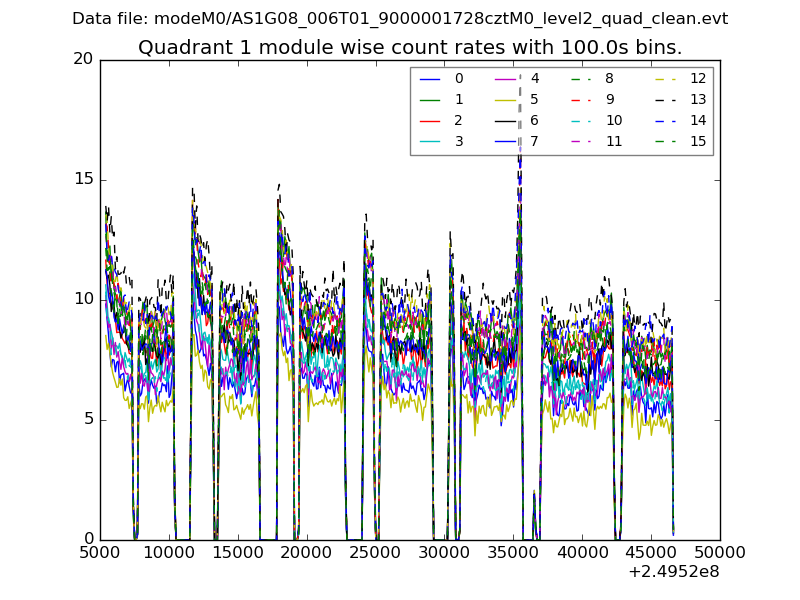
| Module-wise count rates for Quadrant B Data is divided into 100 sec bins |
 |
 |
| Module-wise count rates for Quadrant C Data is divided into 100 sec bins |
 |
 |
| Module-wise count rates for Quadrant D Data is divided into 100 sec bins |
 |
 |
| Parameter | Plot |
|---|---|
| CZT HV Monitor |  |
| D_VDD |  |
| Temperature 1 |  |
| Veto HV Monitor |  |
| Veto LLD | 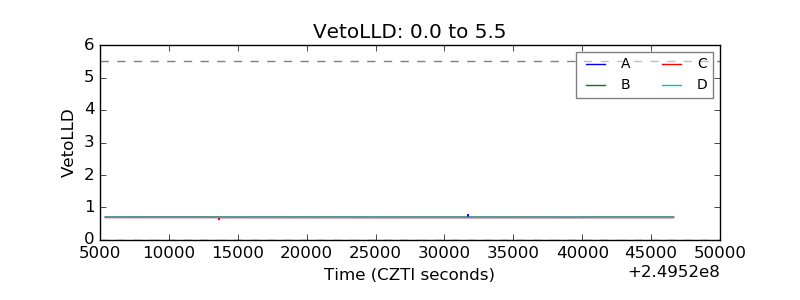 |
| Alpha Counter |  |
| _CPM_Rate |  |
| CZT Counter |  |
| +2.5 Volts monitor |  |
| +5 Volts monitor | 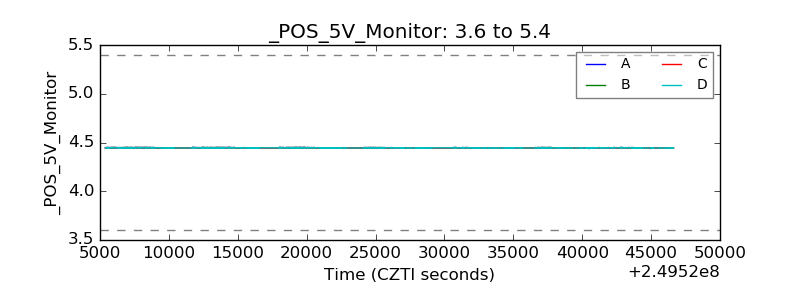 |
| _ROLL_ROT |  |
| _Roll_DEC | 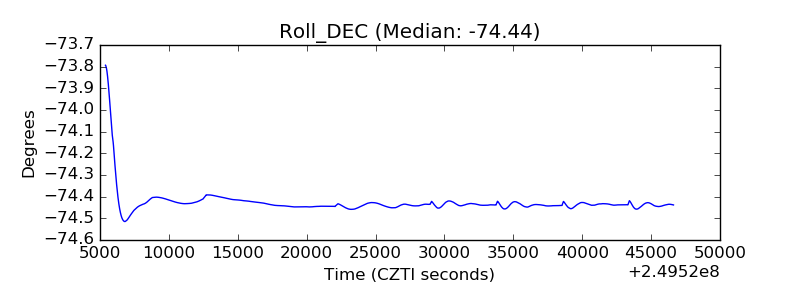 |
| _Roll_RA |  |
| Veto Counter | 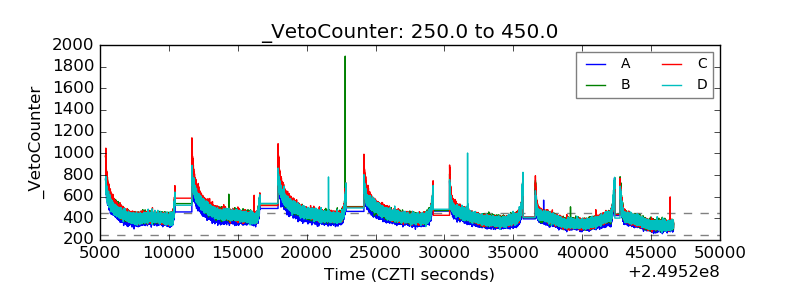 |