| Param | Original file | Final file |
|---|---|---|
| Filename | modeM0/AS1G08_006T01_9000001728_11721cztM0_level2.evt | modeM0/AS1G08_006T01_9000001728_11721cztM0_level2_quad_clean.evt |
| Size (bytes) | 119,805,120 | 33,678,720 |
| Size | 114.3 MB | 32.1 MB |
| Events in quadrant A | 989,909 | 228,541 |
| Events in quadrant B | 825,850 | 238,308 |
| Events in quadrant C | 763,192 | 225,966 |
| Events in quadrant D | 942,889 | 213,566 |
| Mode SS | |||
|---|---|---|---|
| Quadrant | BADHDUFLAG | Total packets | Discarded packets |
| A | 0 | 30 | 0 |
| B | 0 | 30 | 0 |
| C | 0 | 30 | 0 |
| D | 0 | 30 | 0 |
| Mode M9 | |||
|---|---|---|---|
| Quadrant | BADHDUFLAG | Total packets | Discarded packets |
| A | 0 | 1 | 0 |
| B | 0 | 1 | 0 |
| C | 0 | 1 | 0 |
| D | 0 | 1 | 0 |
| Mode M0 | |||
|---|---|---|---|
| Quadrant | BADHDUFLAG | Total packets | Discarded packets |
| A | 0 | 3981 | 2 |
| B | 0 | 3409 | 1 |
| C | 0 | 3180 | 1 |
| D | 0 | 3831 | 1 |
| Quadrant | Total seconds | Saturated seconds | Saturation percentage |
|---|---|---|---|
| A | 1530 | 19 | 1.241830% |
| B | 1530 | 12 | 0.784314% |
| C | 1530 | 4 | 0.261438% |
| D | 1530 | 14 | 0.915033% |
Noise dominated data is calculated using 1-second bins in cleaned event files. If a bin has >2000 counts, and if more than 50% of those come from <1% of pixels, then it is considered to be noise-dominated and hence unusable.
| Quadrant | # 1 sec bins | Bins with >0 counts | Bins with >2000 counts | High rate bins dominated by noise | Noise dominated (total time) | Noise dominated (detector-on time) | Marked lightcurve |
|---|---|---|---|---|---|---|---|
| A | 1531 | 1531 | 8 | 8 | 0.52% | 0.52% | 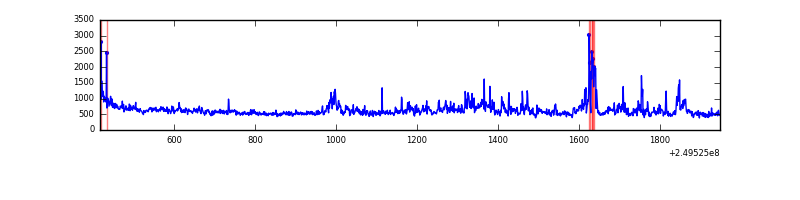 |
| B | 1531 | 1531 | 1 | 1 | 0.07% | 0.07% | 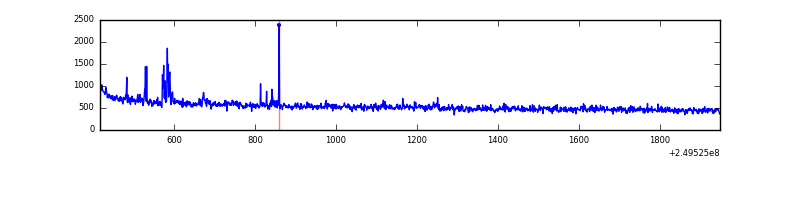 |
| C | 1531 | 1531 | 0 | 0 | 0.00% | 0.00% | 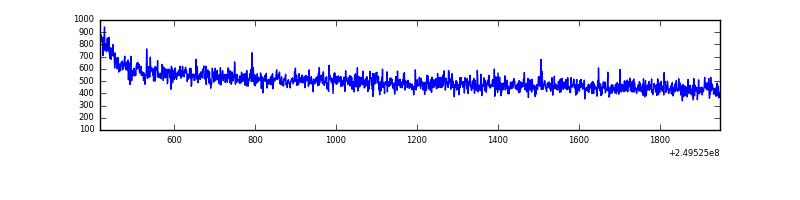 |
| D | 1531 | 1531 | 11 | 11 | 0.72% | 0.72% | 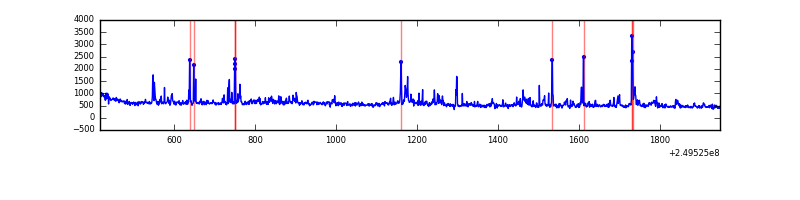 |
Top three noisy pixels from each quadrant. If the there are fewer than three noisy pixels in the level2.evt file, extra rows are filled as -1
| Pixel properties | Quadrant properties | ||||||
|---|---|---|---|---|---|---|---|
| Quadrant | DetID | PixID | Counts | Sigma | Mean | Median | Sigma |
| A | 8 | 15 | 179528 | 4397.92 | 195 | 191 | 40.8 |
| A | 1 | 162 | 19912 | 483.62 | 195 | 191 | 40.8 |
| A | 14 | 111 | 9971 | 239.84 | 195 | 191 | 40.8 |
| B | 10 | 245 | 10365 | 258.08 | 202 | 197 | 39.4 |
| B | 3 | 64 | 7016 | 173.08 | 202 | 197 | 39.4 |
| B | 4 | 81 | 6708 | 165.26 | 202 | 197 | 39.4 |
| C | 13 | 61 | 1442 | 26.75 | 195 | 197 | 46.5 |
| C | 3 | 202 | 470 | 5.87 | 195 | 197 | 46.5 |
| C | -1 | -1 | -1 | -1.0 | 195 | 197 | 46.5 |
| D | 8 | 195 | 87736 | 1886.44 | 189 | 184 | 46.4 |
| D | 5 | 222 | 53732 | 1153.77 | 189 | 184 | 46.4 |
| D | 4 | 95 | 29152 | 624.16 | 189 | 184 | 46.4 |
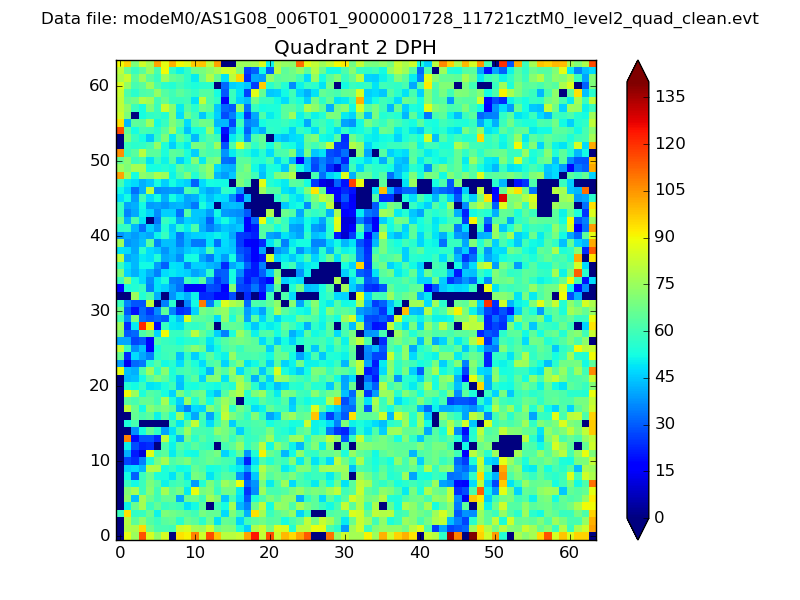
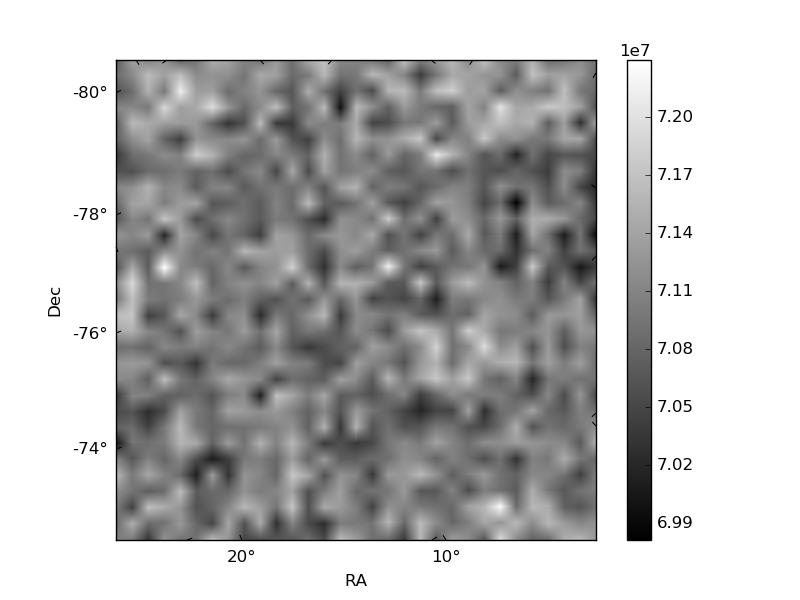
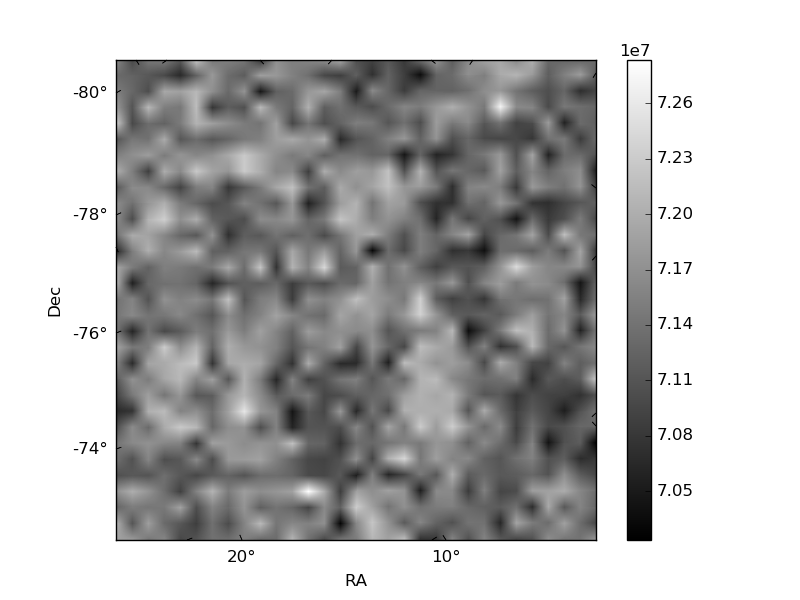
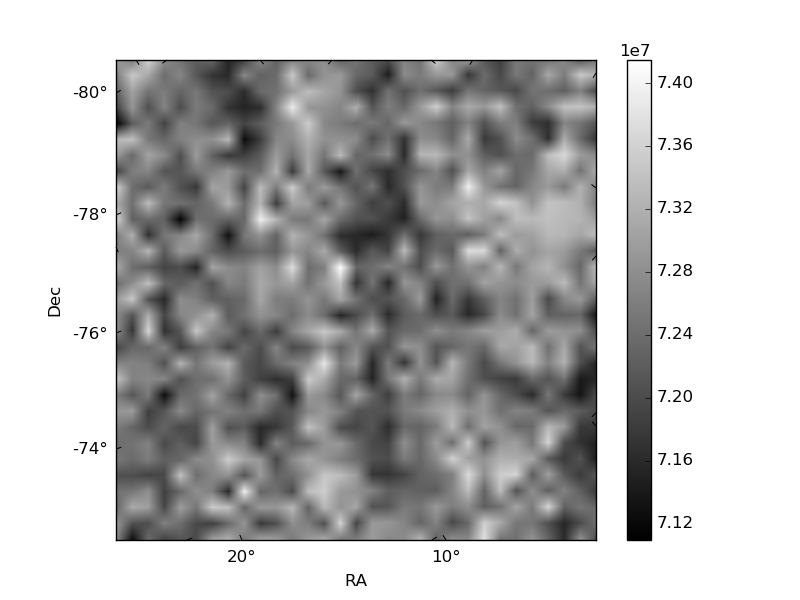
Histogram calculated using DETX and DETY for each event in the final _common_clean file
| Quadrant A | 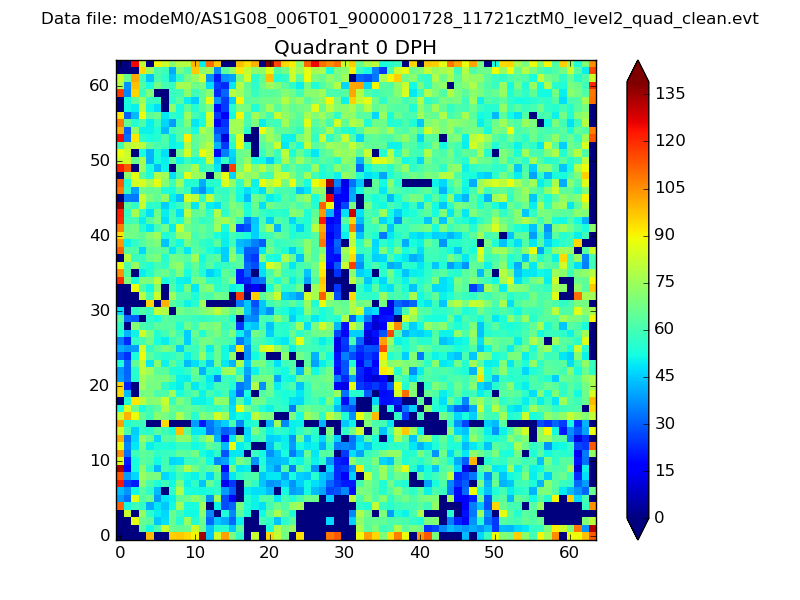 |
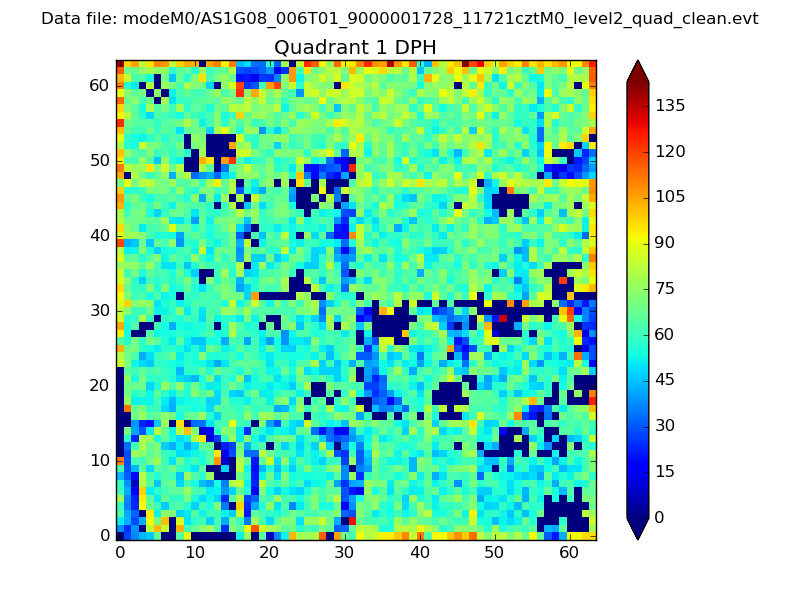 |
Quadrant B |
|---|---|---|---|
| Quadrant D | 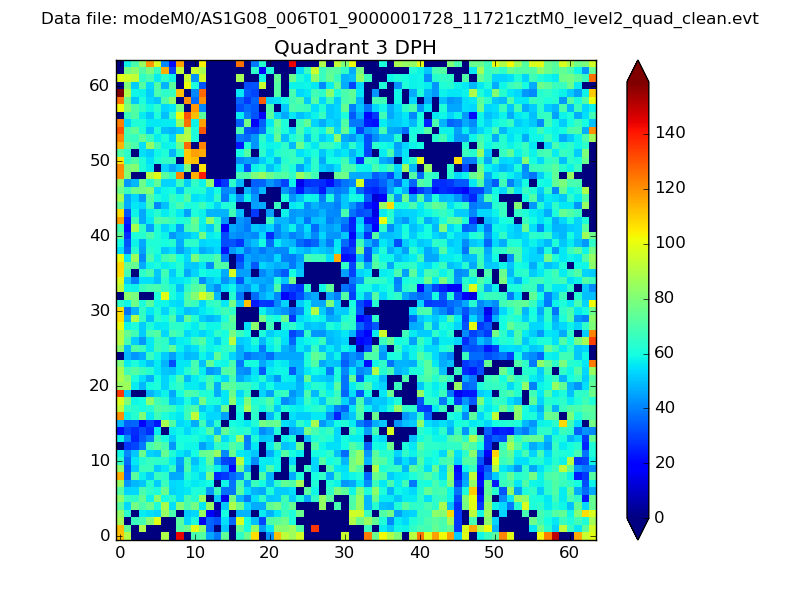 |
 |
Quadrant C |
| Plot type | Count rate plots | Images |
|---|---|---|
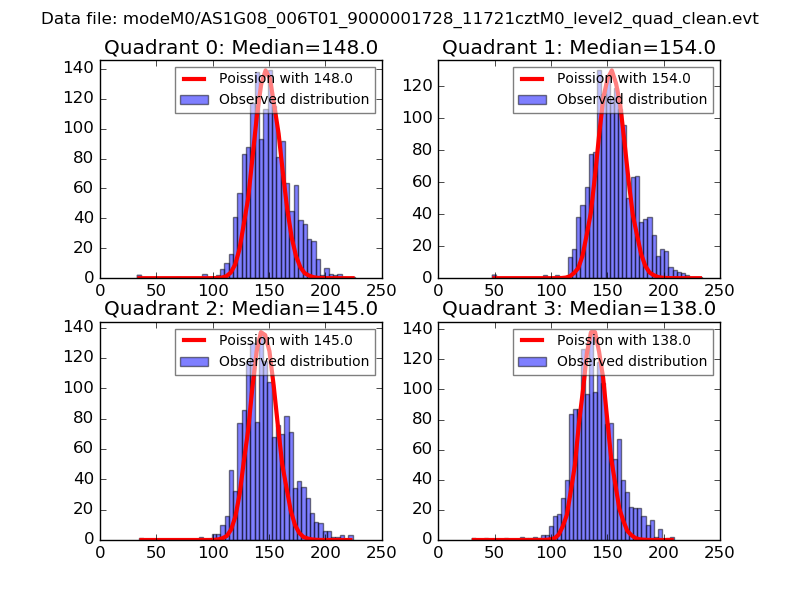
| Comparison with Poisson distribution Blue bars denote a histogram of data divided into 1 sec bins. Red curve is a Poisson curve with rate = median count rate of data. |
 |
 |
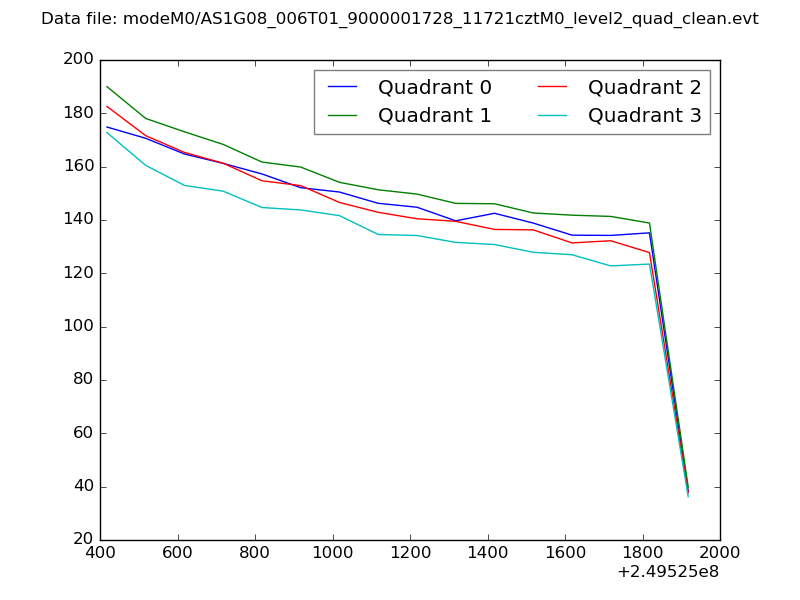
| Quadrant-wise count rates Data is divided into 100 sec bins |
 |
|
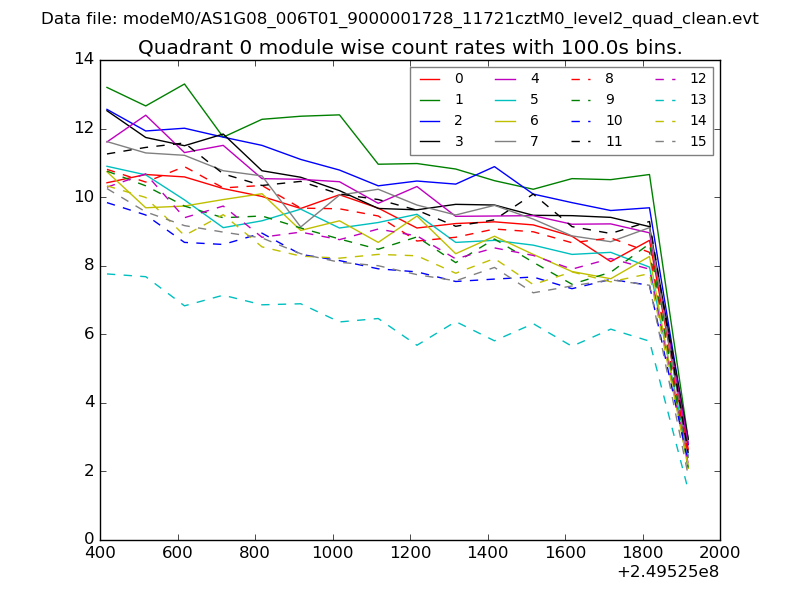
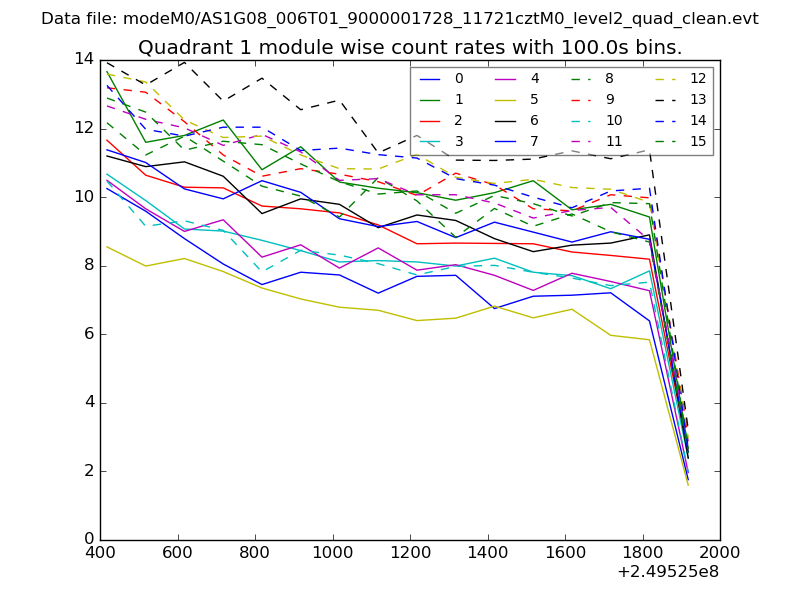
| Module-wise count rates for Quadrant A Data is divided into 100 sec bins |
 |
 |
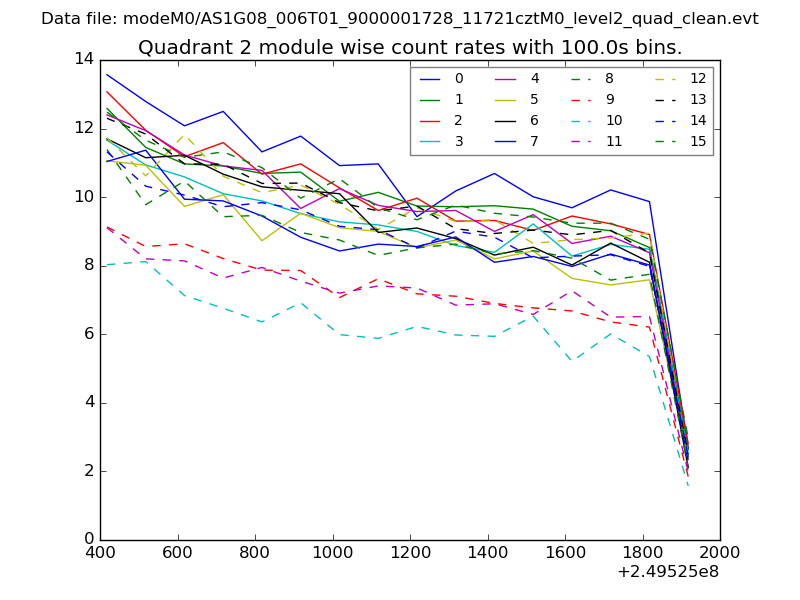
| Module-wise count rates for Quadrant B Data is divided into 100 sec bins |
 |
 |
| Module-wise count rates for Quadrant C Data is divided into 100 sec bins |
 |
 |
| Module-wise count rates for Quadrant D Data is divided into 100 sec bins |
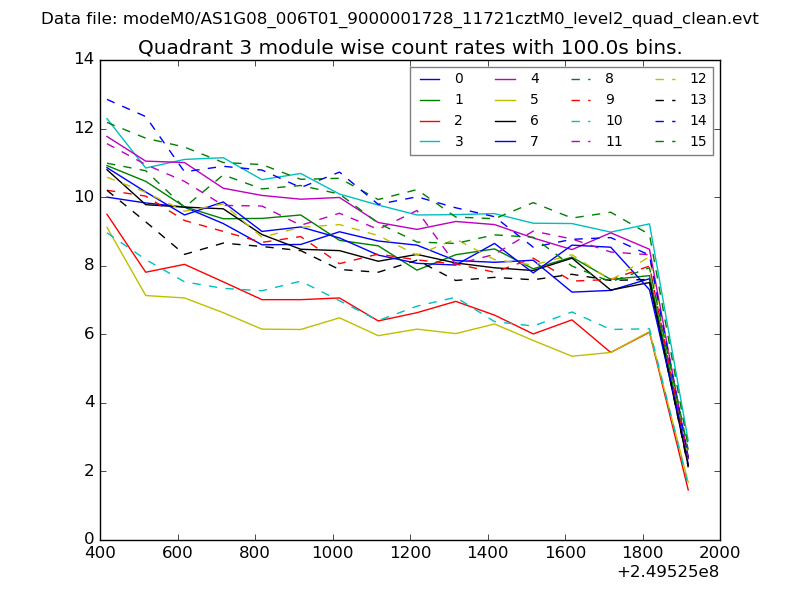 |
 |
| Parameter | Plot |
|---|---|
| CZT HV Monitor | 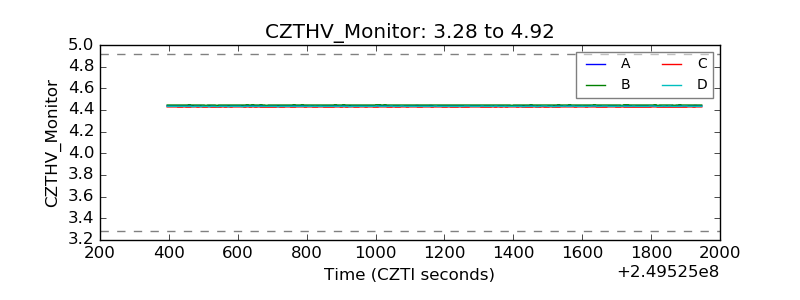 |
| D_VDD | 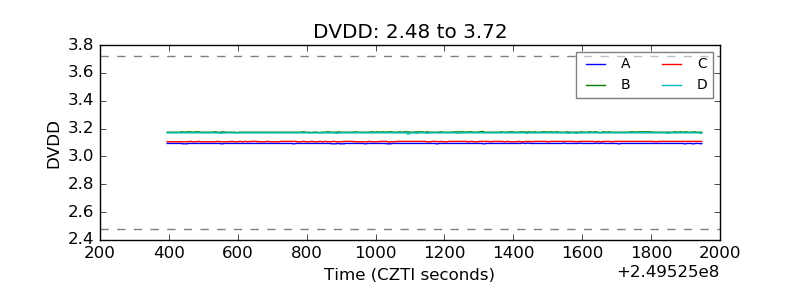 |
| Temperature 1 | 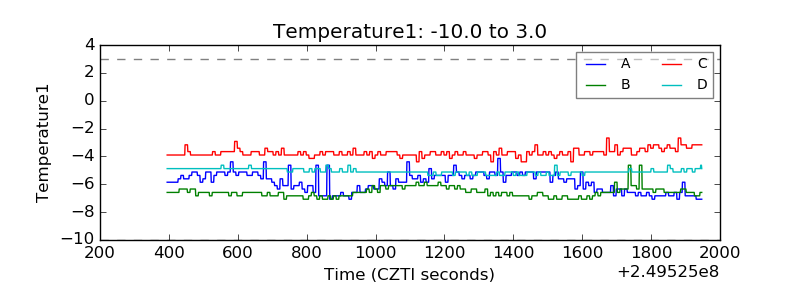 |
| Veto HV Monitor | 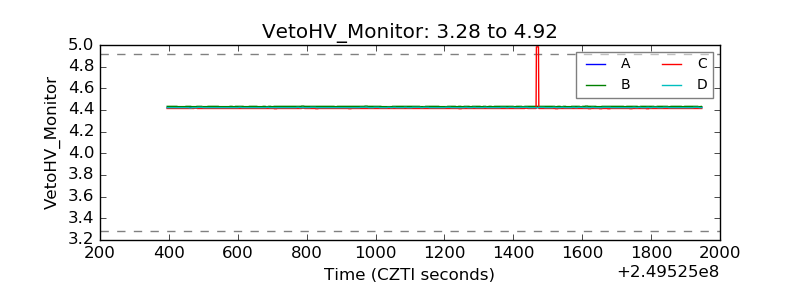 |
| Veto LLD | 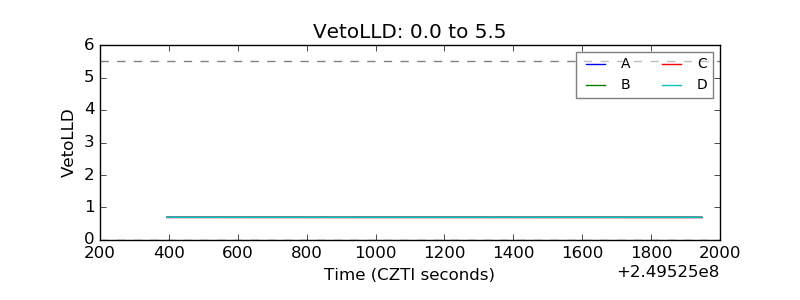 |
| Alpha Counter | 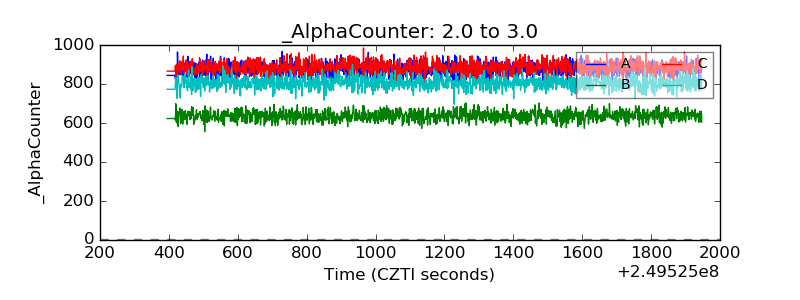 |
| _CPM_Rate | 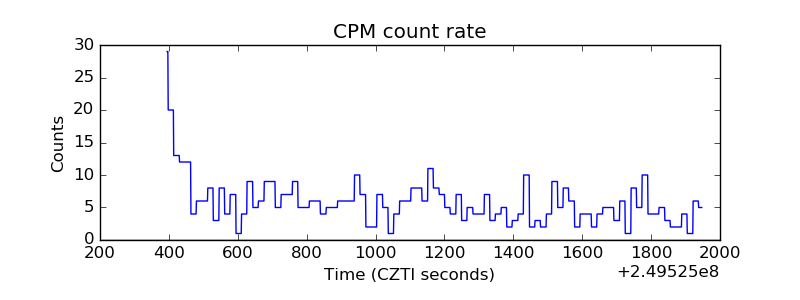 |
| CZT Counter | 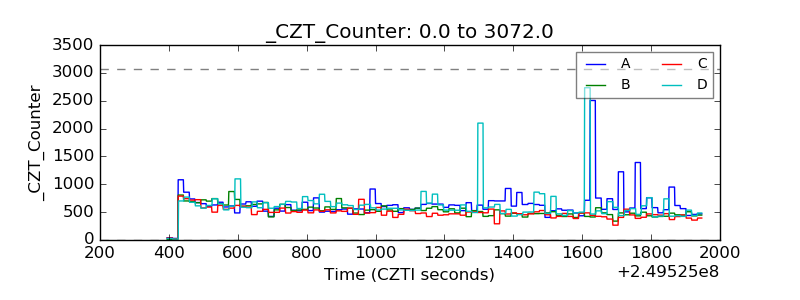 |
| +2.5 Volts monitor |  |
| +5 Volts monitor | 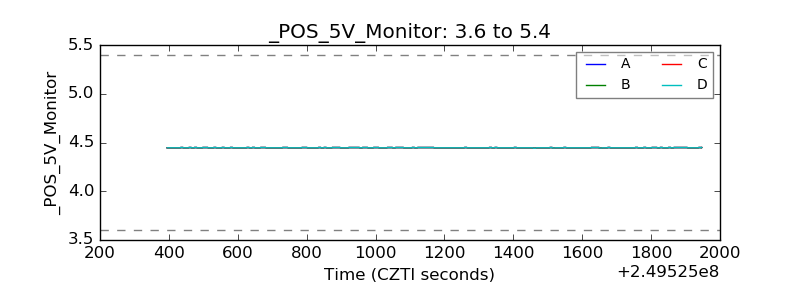 |
| _ROLL_ROT | 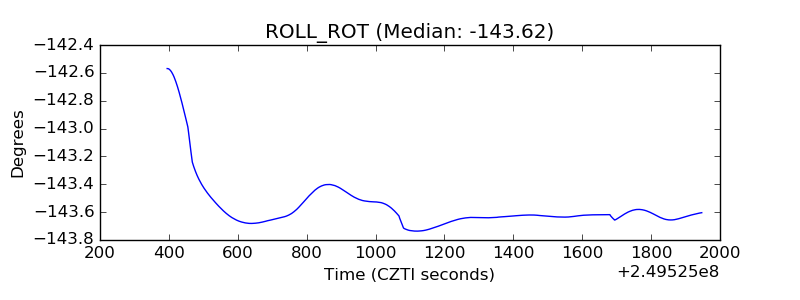 |
| _Roll_DEC | 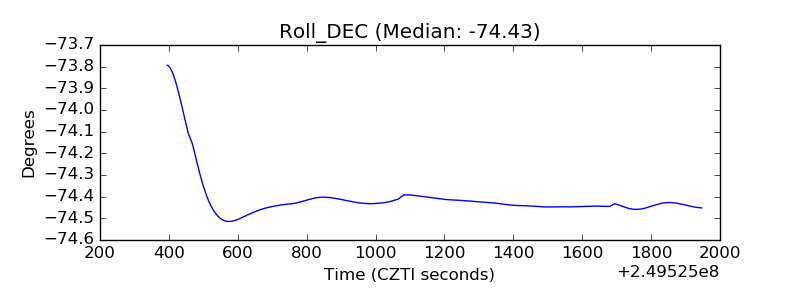 |
| _Roll_RA | 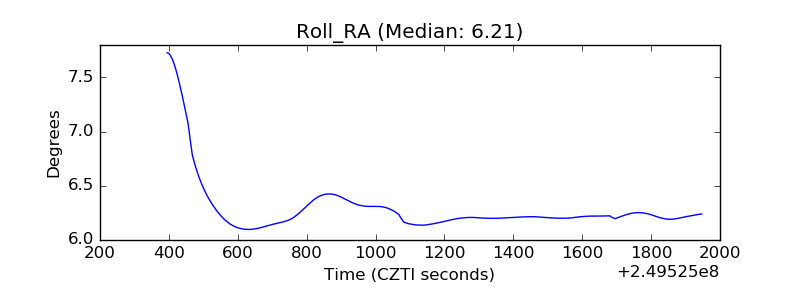 |
| Veto Counter | 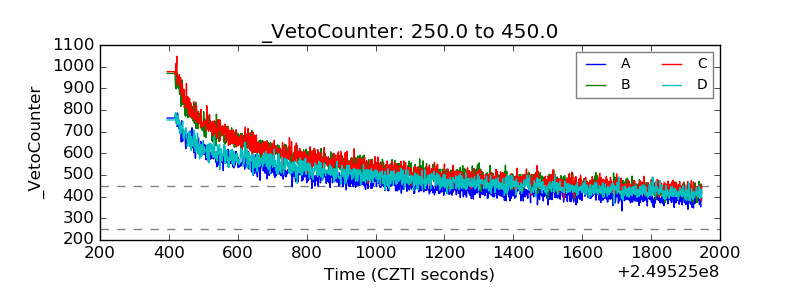 |