| Param | Original file | Final file |
|---|---|---|
| Filename | modeM0/AS1G08_006T01_9000001728_11722cztM0_level2.evt | modeM0/AS1G08_006T01_9000001728_11722cztM0_level2_quad_clean.evt |
| Size (bytes) | 488,471,040 | 118,304,640 |
| Size | 465.8 MB | 112.8 MB |
| Events in quadrant A | 4,139,557 | 790,720 |
| Events in quadrant B | 3,478,389 | 818,559 |
| Events in quadrant C | 2,910,042 | 800,712 |
| Events in quadrant D | 3,851,401 | 747,028 |
| Mode SS | |||
|---|---|---|---|
| Quadrant | BADHDUFLAG | Total packets | Discarded packets |
| A | 0 | 124 | 0 |
| B | 0 | 124 | 0 |
| C | 0 | 124 | 0 |
| D | 0 | 124 | 0 |
| Mode M9 | |||
|---|---|---|---|
| Quadrant | BADHDUFLAG | Total packets | Discarded packets |
| A | 0 | 12 | 0 |
| B | 0 | 12 | 0 |
| C | 0 | 12 | 0 |
| D | 0 | 12 | 0 |
| Mode M0 | |||
|---|---|---|---|
| Quadrant | BADHDUFLAG | Total packets | Discarded packets |
| A | 0 | 16447 | 2 |
| B | 0 | 14188 | 1 |
| C | 0 | 12585 | 1 |
| D | 0 | 15345 | 1 |
| Quadrant | Total seconds | Saturated seconds | Saturation percentage |
|---|---|---|---|
| A | 6102 | 90 | 1.474926% |
| B | 6102 | 126 | 2.064897% |
| C | 6102 | 28 | 0.458866% |
| D | 6102 | 180 | 2.949853% |
Noise dominated data is calculated using 1-second bins in cleaned event files. If a bin has >2000 counts, and if more than 50% of those come from <1% of pixels, then it is considered to be noise-dominated and hence unusable.
| Quadrant | # 1 sec bins | Bins with >0 counts | Bins with >2000 counts | High rate bins dominated by noise | Noise dominated (total time) | Noise dominated (detector-on time) | Marked lightcurve |
|---|---|---|---|---|---|---|---|
| A | 7333 | 6104 | 11 | 11 | 0.15% | 0.18% | 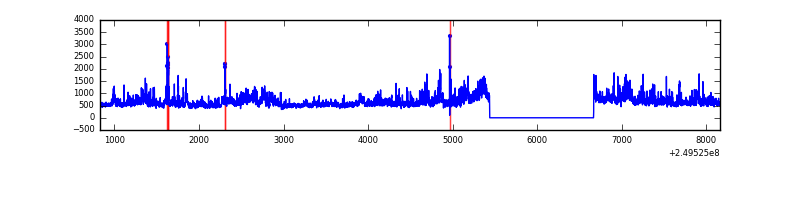 |
| B | 7333 | 6104 | 48 | 48 | 0.65% | 0.79% | 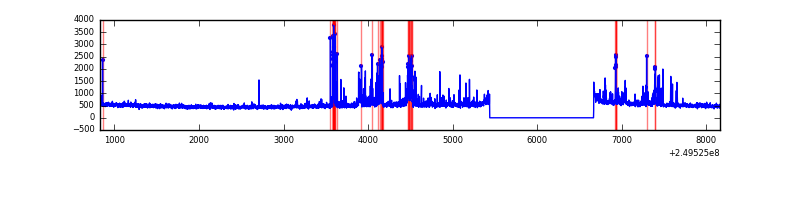 |
| C | 7333 | 6104 | 0 | 0 | 0.00% | 0.00% | 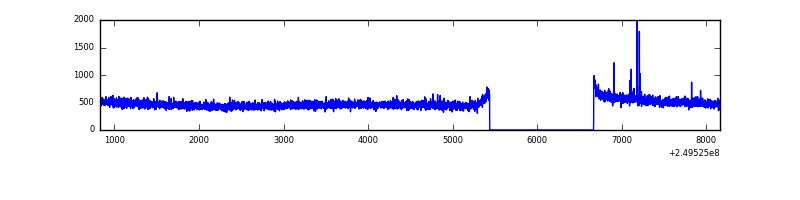 |
| D | 7333 | 6104 | 104 | 104 | 1.42% | 1.70% | 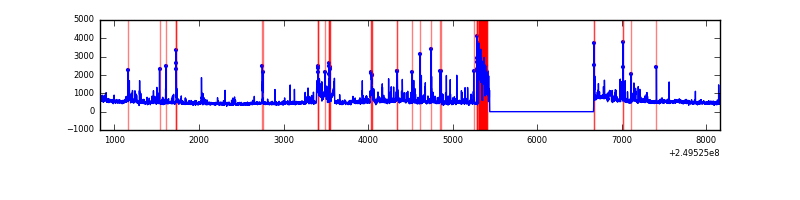 |
Top three noisy pixels from each quadrant. If the there are fewer than three noisy pixels in the level2.evt file, extra rows are filled as -1
| Pixel properties | Quadrant properties | ||||||
|---|---|---|---|---|---|---|---|
| Quadrant | DetID | PixID | Counts | Sigma | Mean | Median | Sigma |
| A | 8 | 15 | 933728 | 6225.98 | 751 | 735 | 149.9 |
| A | 1 | 162 | 109776 | 727.64 | 751 | 735 | 149.9 |
| A | 1 | 178 | 61387 | 404.74 | 751 | 735 | 149.9 |
| B | 4 | 239 | 274532 | 1953.38 | 758 | 741 | 140.2 |
| B | 3 | 64 | 73572 | 519.62 | 758 | 741 | 140.2 |
| B | 10 | 245 | 64839 | 457.31 | 758 | 741 | 140.2 |
| C | 12 | 4 | 13063 | 72.95 | 743 | 747 | 168.8 |
| C | 13 | 61 | 5474 | 28.0 | 743 | 747 | 168.8 |
| C | 3 | 202 | 1862 | 6.6 | 743 | 747 | 168.8 |
| D | 1 | 52 | 489623 | 2900.81 | 722 | 703 | 168.5 |
| D | 8 | 195 | 214551 | 1268.78 | 722 | 703 | 168.5 |
| D | 4 | 95 | 105404 | 621.2 | 722 | 703 | 168.5 |
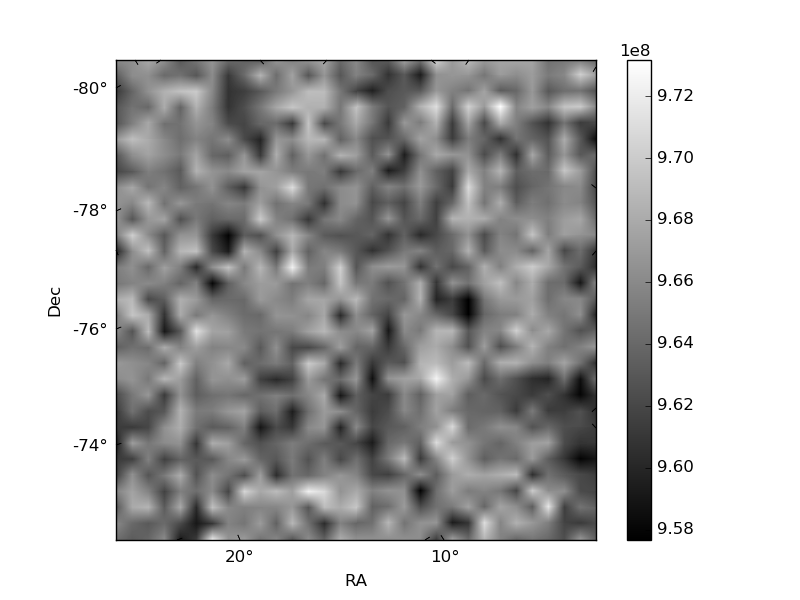
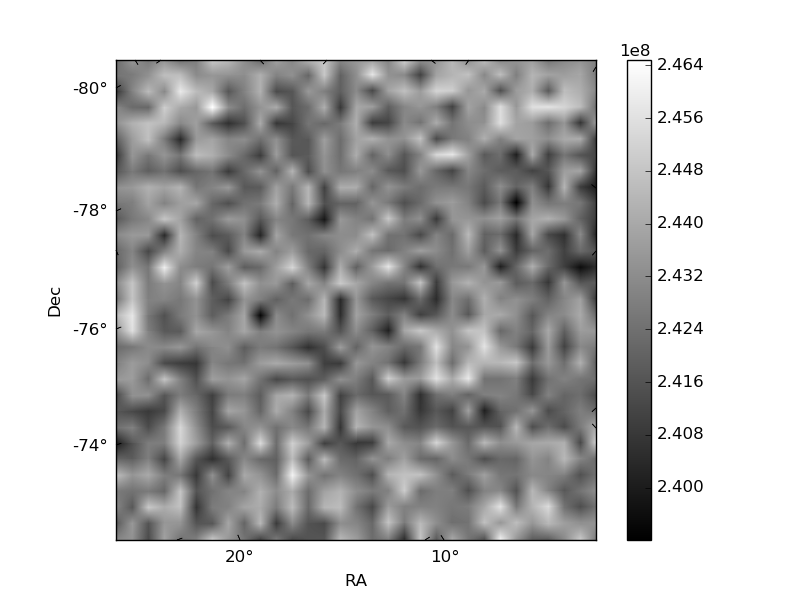
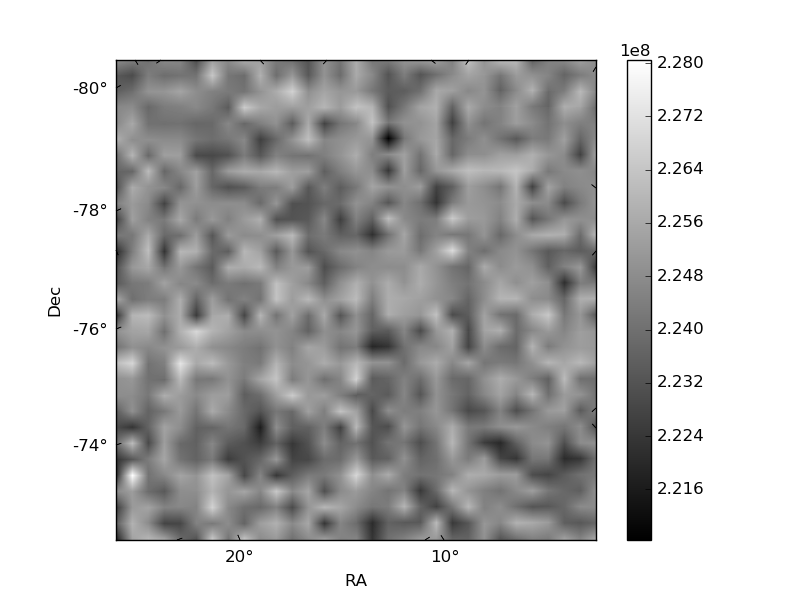
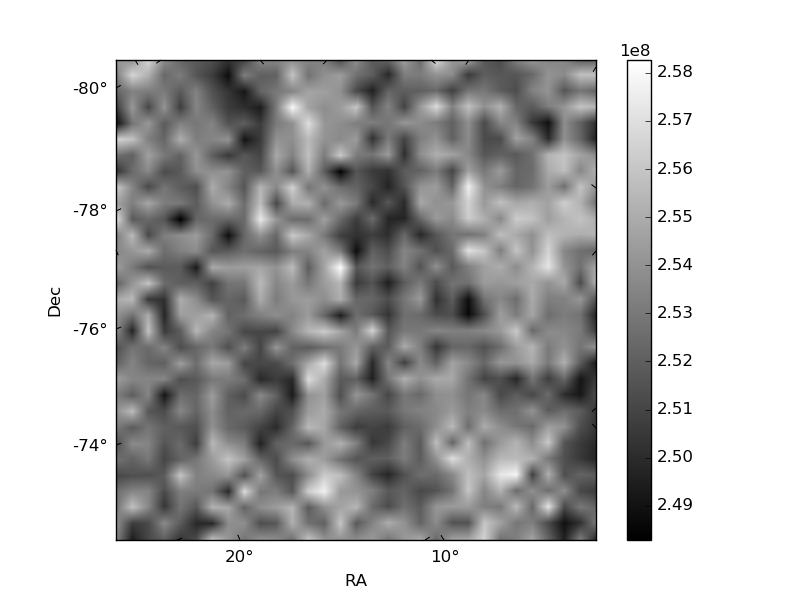
Histogram calculated using DETX and DETY for each event in the final _common_clean file
| Quadrant A | 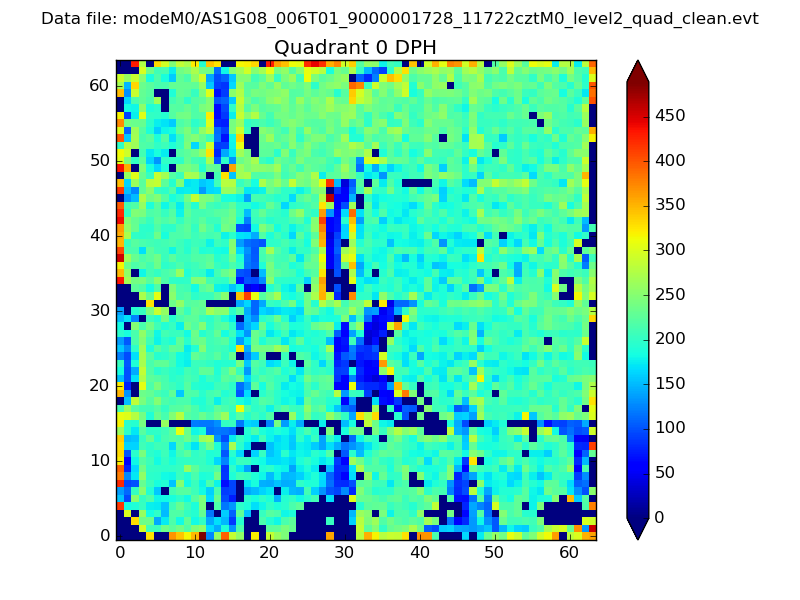 |
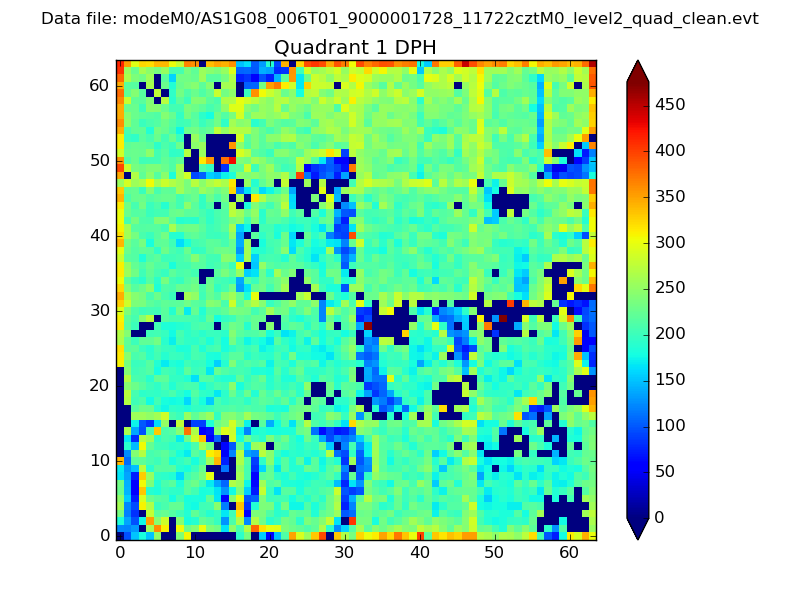 |
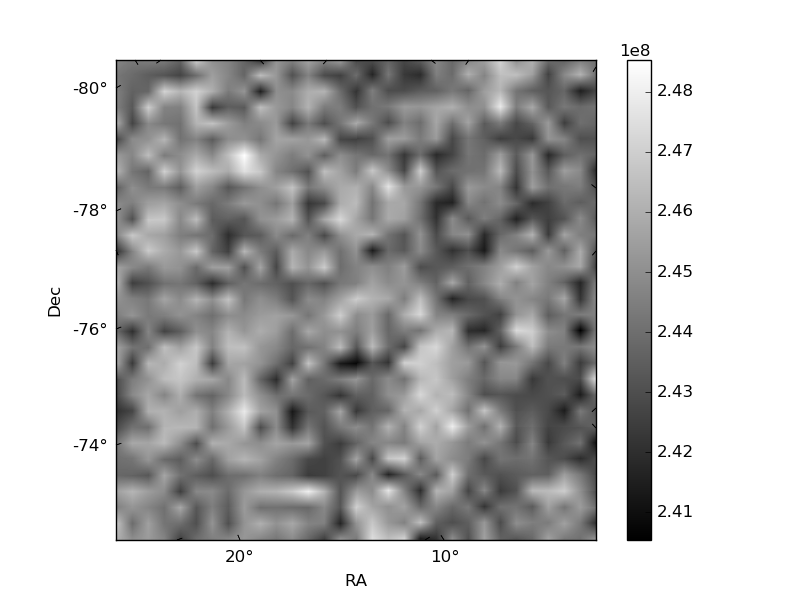
Quadrant B |
|---|---|---|---|
| Quadrant D | 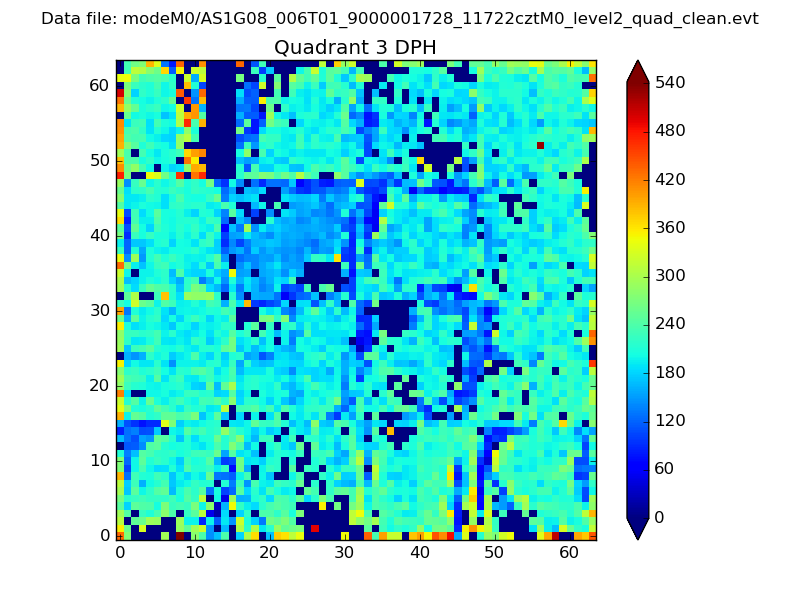 |
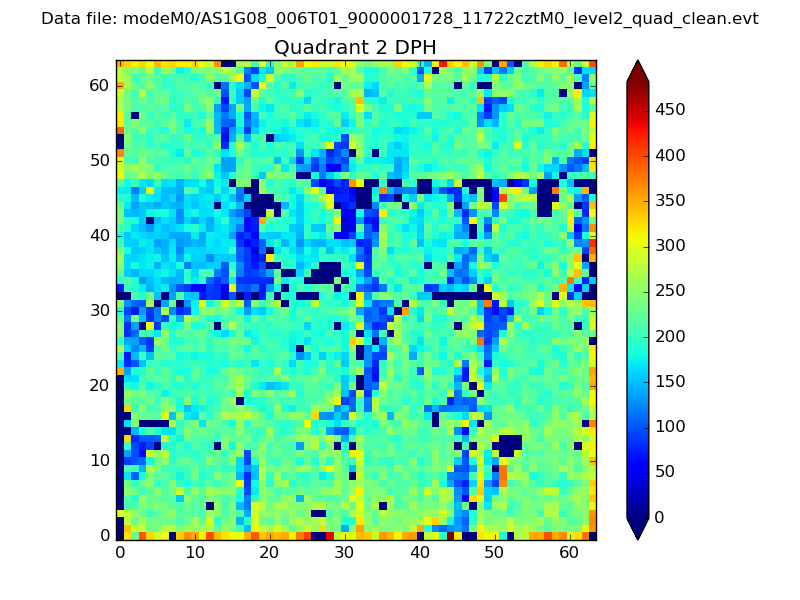 |
Quadrant C |
| Plot type | Count rate plots | Images |
|---|---|---|
| Comparison with Poisson distribution Blue bars denote a histogram of data divided into 1 sec bins. Red curve is a Poisson curve with rate = median count rate of data. |
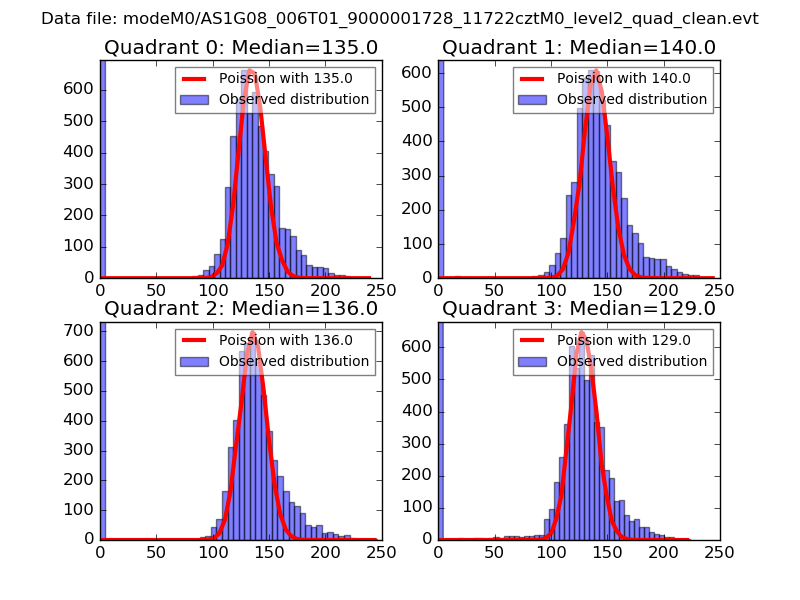 |
 |
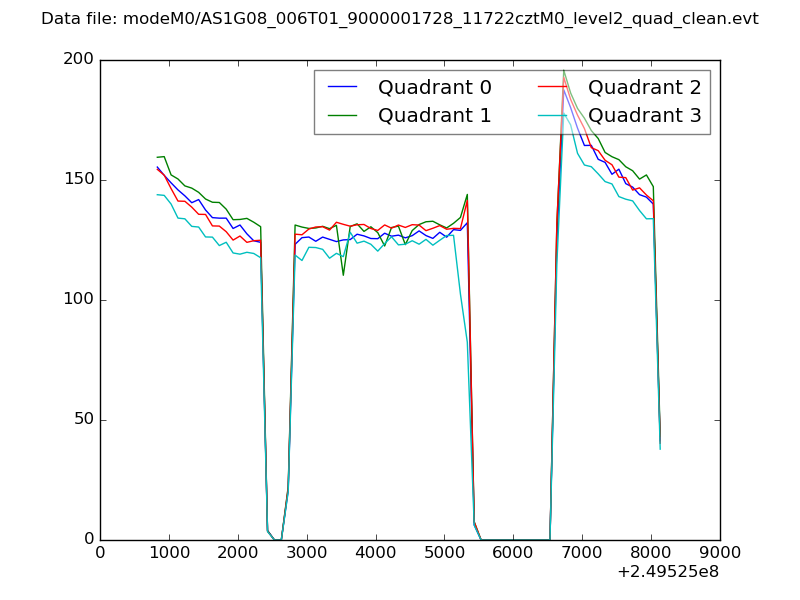
| Quadrant-wise count rates Data is divided into 100 sec bins |
 |
|
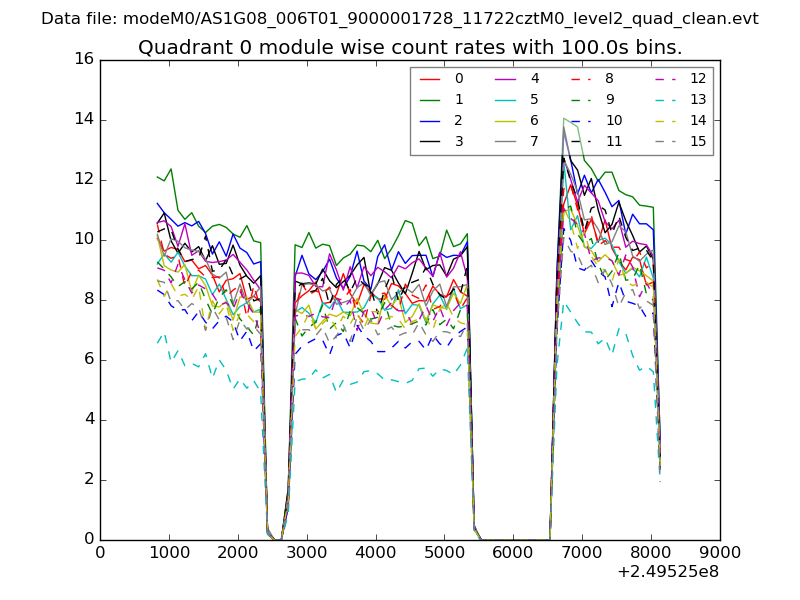
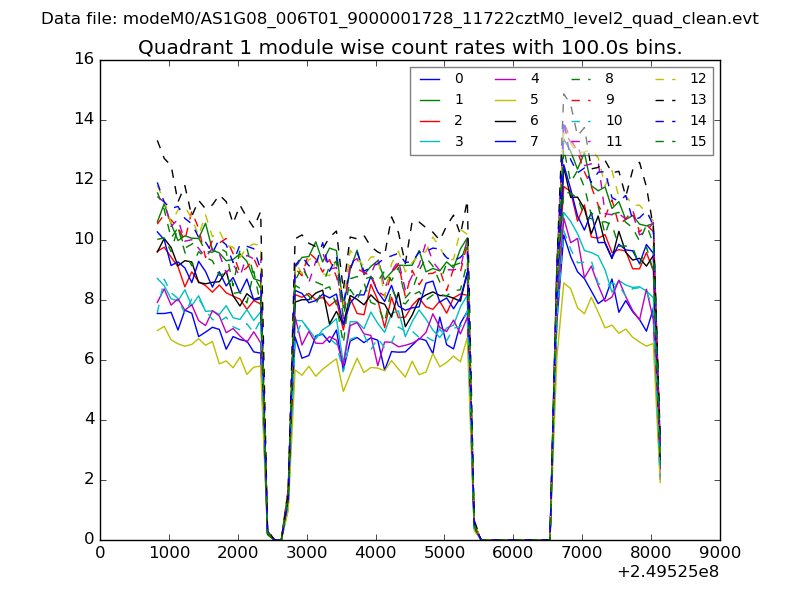
| Module-wise count rates for Quadrant A Data is divided into 100 sec bins |
 |
 |
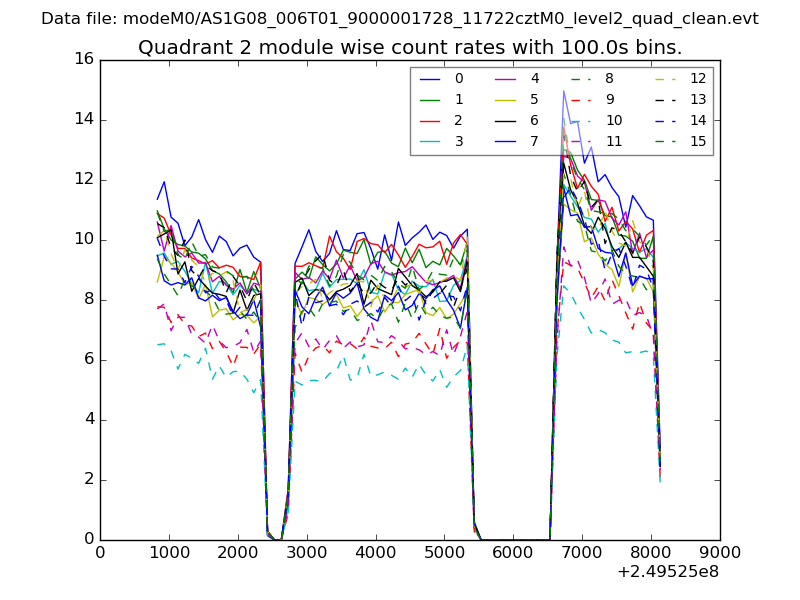
| Module-wise count rates for Quadrant B Data is divided into 100 sec bins |
 |
 |
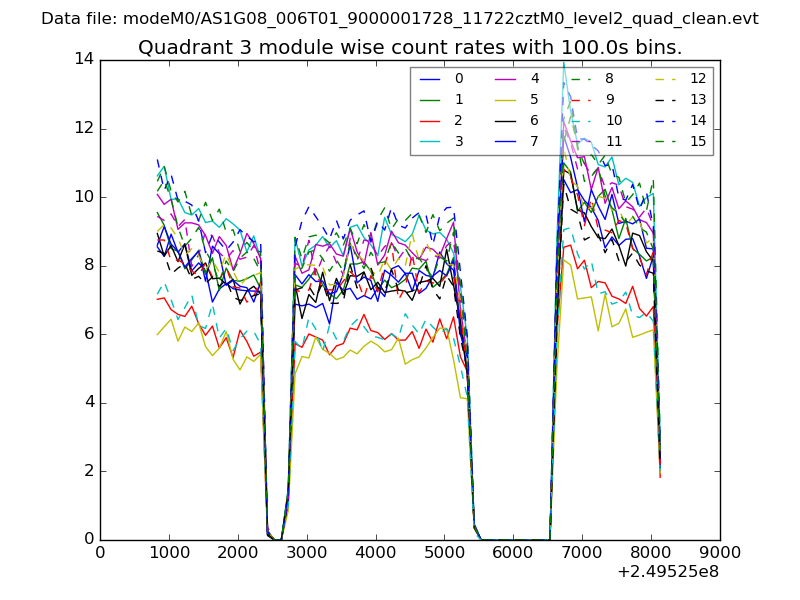
| Module-wise count rates for Quadrant C Data is divided into 100 sec bins |
 |
 |
| Module-wise count rates for Quadrant D Data is divided into 100 sec bins |
 |
 |
| Parameter | Plot |
|---|---|
| CZT HV Monitor | 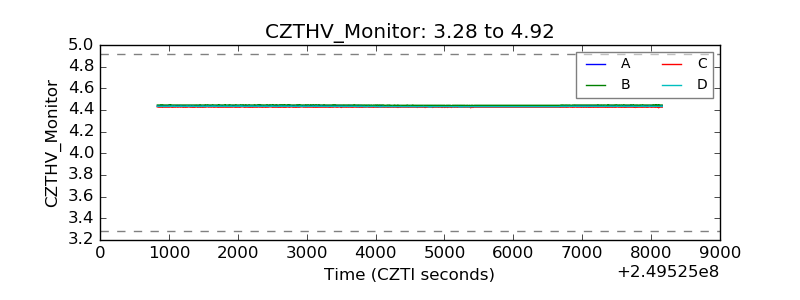 |
| D_VDD | 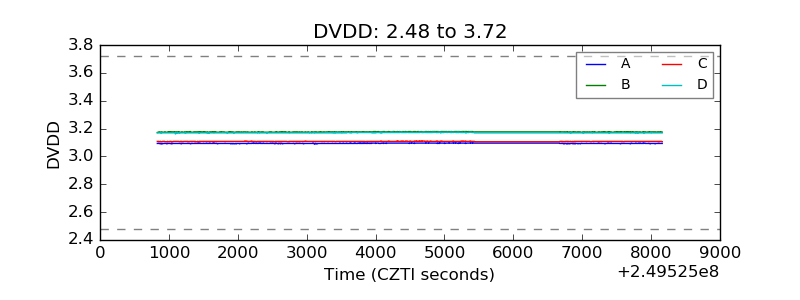 |
| Temperature 1 | 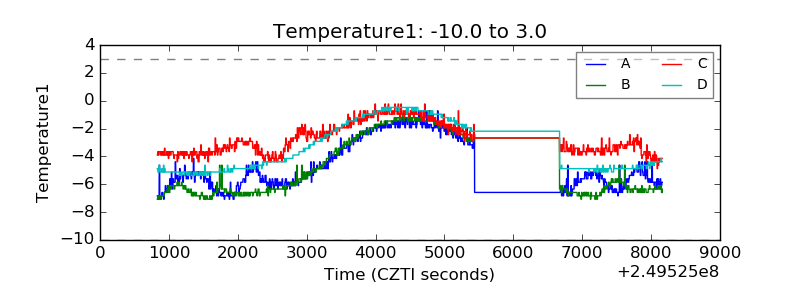 |
| Veto HV Monitor |  |
| Veto LLD | 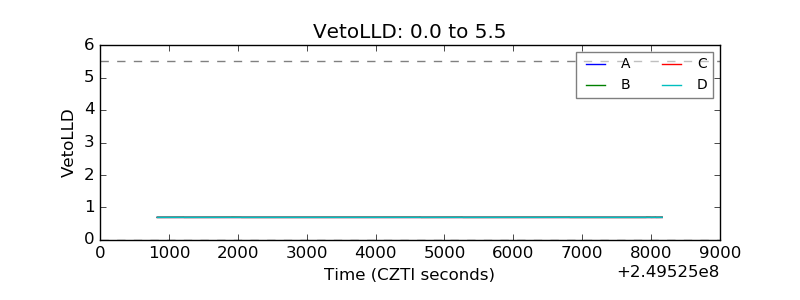 |
| Alpha Counter | 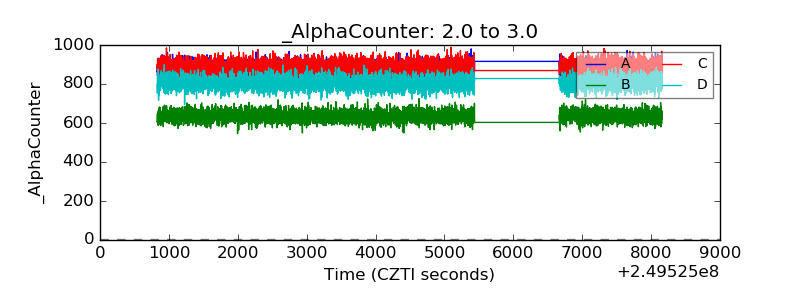 |
| _CPM_Rate | 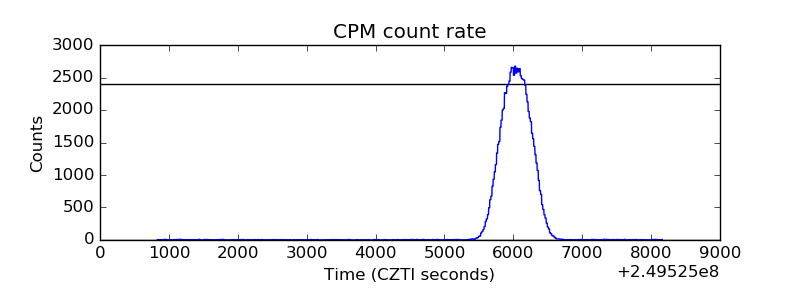 |
| CZT Counter | 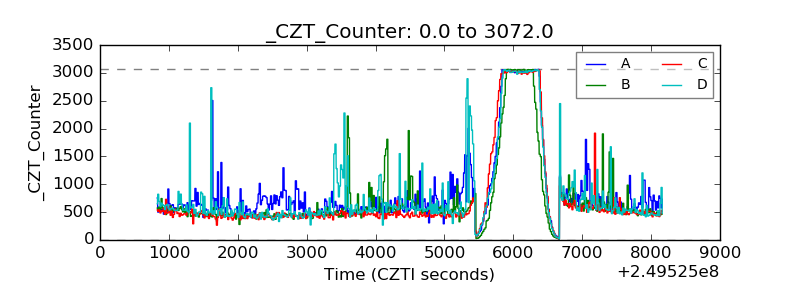 |
| +2.5 Volts monitor |  |
| +5 Volts monitor |  |
| _ROLL_ROT | 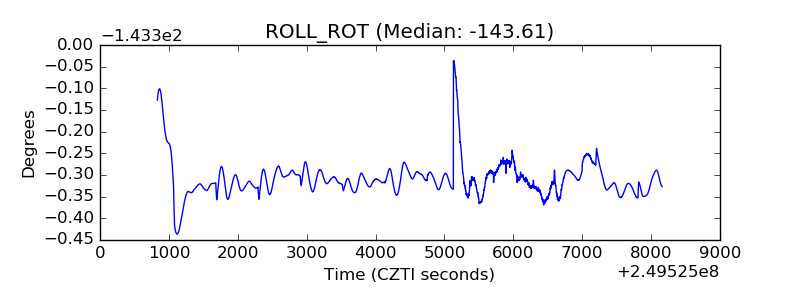 |
| _Roll_DEC | 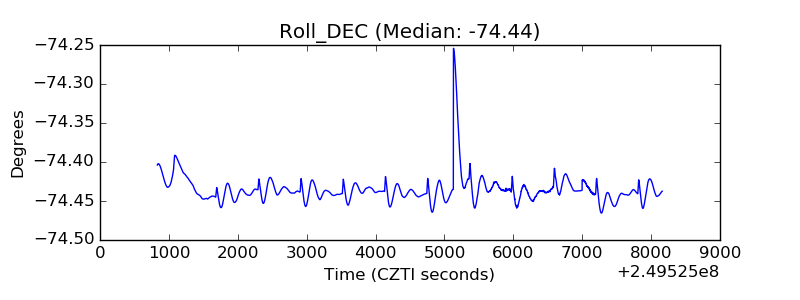 |
| _Roll_RA | 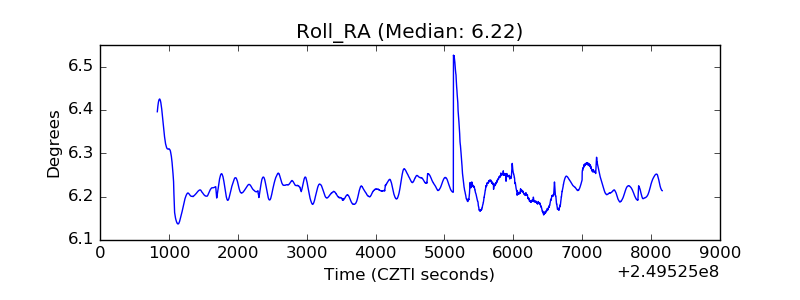 |
| Veto Counter |  |