| Param | Original file | Final file |
|---|---|---|
| Filename | modeM0/AS1G08_006T01_9000001728_11723cztM0_level2.evt | modeM0/AS1G08_006T01_9000001728_11723cztM0_level2_quad_clean.evt |
| Size (bytes) | 555,589,440 | 124,810,560 |
| Size | 529.9 MB | 119.0 MB |
| Events in quadrant A | 5,174,906 | 825,840 |
| Events in quadrant B | 4,232,321 | 855,634 |
| Events in quadrant C | 3,166,228 | 854,249 |
| Events in quadrant D | 3,823,348 | 801,957 |
| Mode SS | |||
|---|---|---|---|
| Quadrant | BADHDUFLAG | Total packets | Discarded packets |
| A | 0 | 130 | 0 |
| B | 0 | 130 | 0 |
| C | 0 | 130 | 0 |
| D | 0 | 130 | 0 |
| Mode M9 | |||
|---|---|---|---|
| Quadrant | BADHDUFLAG | Total packets | Discarded packets |
| A | 0 | 16 | 0 |
| B | 0 | 16 | 0 |
| C | 0 | 16 | 0 |
| D | 0 | 17 | 0 |
| Mode M0 | |||
|---|---|---|---|
| Quadrant | BADHDUFLAG | Total packets | Discarded packets |
| A | 0 | 19861 | 3 |
| B | 0 | 16661 | 2 |
| C | 0 | 13314 | 2 |
| D | 0 | 15372 | 2 |
| Quadrant | Total seconds | Saturated seconds | Saturation percentage |
|---|---|---|---|
| A | 6336 | 244 | 3.851010% |
| B | 6336 | 292 | 4.608586% |
| C | 6336 | 27 | 0.426136% |
| D | 6336 | 88 | 1.388889% |
Noise dominated data is calculated using 1-second bins in cleaned event files. If a bin has >2000 counts, and if more than 50% of those come from <1% of pixels, then it is considered to be noise-dominated and hence unusable.
| Quadrant | # 1 sec bins | Bins with >0 counts | Bins with >2000 counts | High rate bins dominated by noise | Noise dominated (total time) | Noise dominated (detector-on time) | Marked lightcurve |
|---|---|---|---|---|---|---|---|
| A | 7657 | 6338 | 71 | 71 | 0.93% | 1.12% | 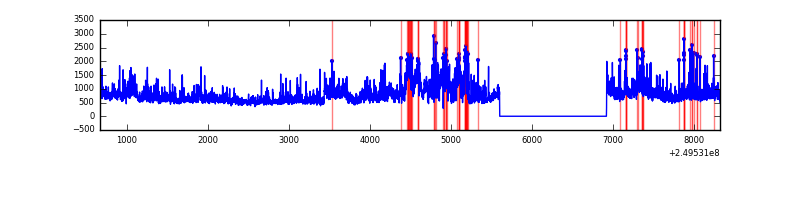 |
| B | 7657 | 6338 | 116 | 116 | 1.51% | 1.83% | 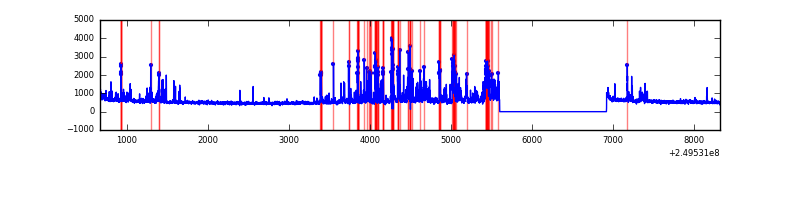 |
| C | 7657 | 6338 | 0 | 0 | 0.00% | 0.00% | 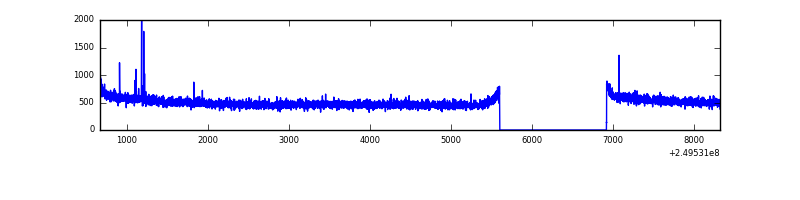 |
| D | 7657 | 6338 | 38 | 38 | 0.50% | 0.60% | 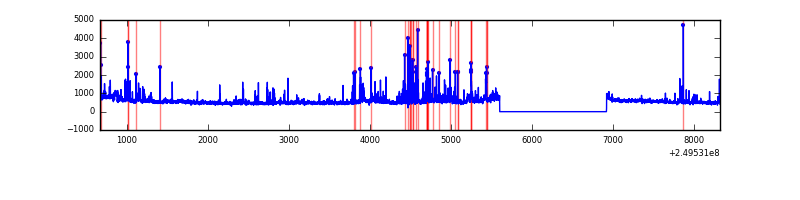 |
Top three noisy pixels from each quadrant. If the there are fewer than three noisy pixels in the level2.evt file, extra rows are filled as -1
| Pixel properties | Quadrant properties | ||||||
|---|---|---|---|---|---|---|---|
| Quadrant | DetID | PixID | Counts | Sigma | Mean | Median | Sigma |
| A | 8 | 15 | 1621681 | 10098.41 | 808 | 794 | 160.5 |
| A | 1 | 162 | 154428 | 957.17 | 808 | 794 | 160.5 |
| A | 1 | 178 | 92108 | 568.9 | 808 | 794 | 160.5 |
| B | 4 | 239 | 523579 | 3525.78 | 813 | 796 | 148.3 |
| B | 3 | 64 | 323186 | 2174.28 | 813 | 796 | 148.3 |
| B | 15 | 204 | 139435 | 935.02 | 813 | 796 | 148.3 |
| C | 12 | 4 | 13936 | 71.83 | 808 | 813 | 182.7 |
| C | 13 | 61 | 6022 | 28.51 | 808 | 813 | 182.7 |
| C | 3 | 202 | 1971 | 6.34 | 808 | 813 | 182.7 |
| D | 8 | 195 | 220985 | 1180.01 | 794 | 773 | 186.6 |
| D | 4 | 95 | 192703 | 1028.46 | 794 | 773 | 186.6 |
| D | 1 | 52 | 139238 | 741.97 | 794 | 773 | 186.6 |
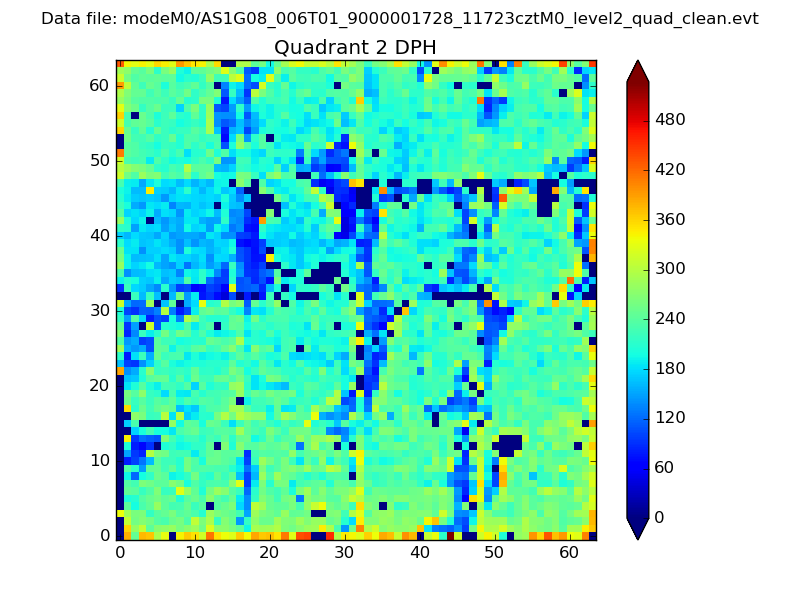
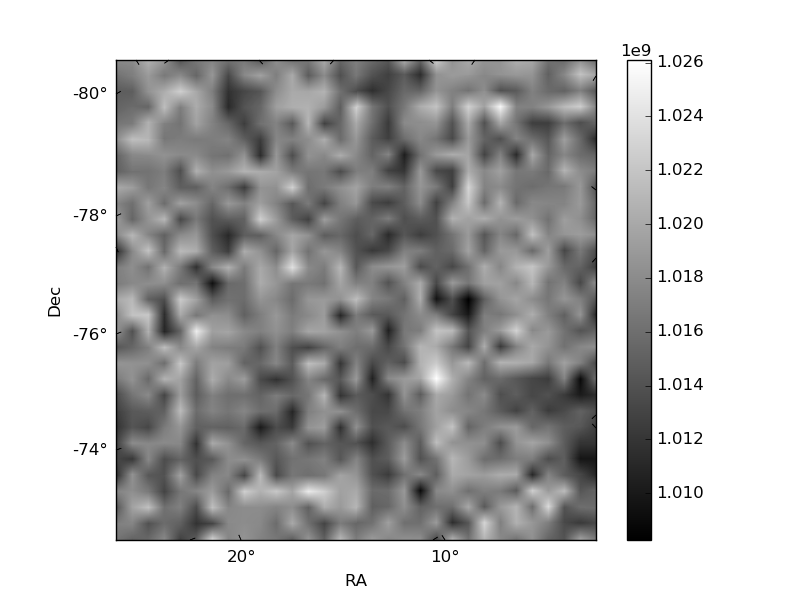
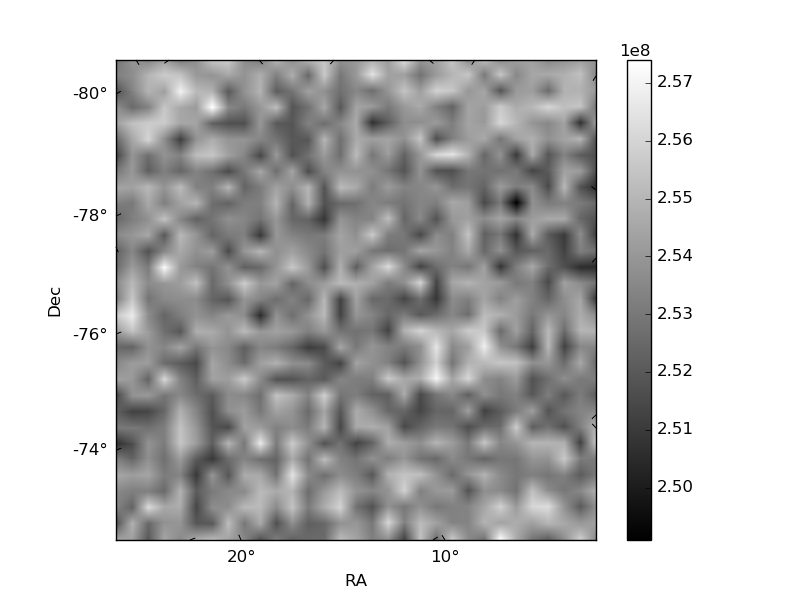
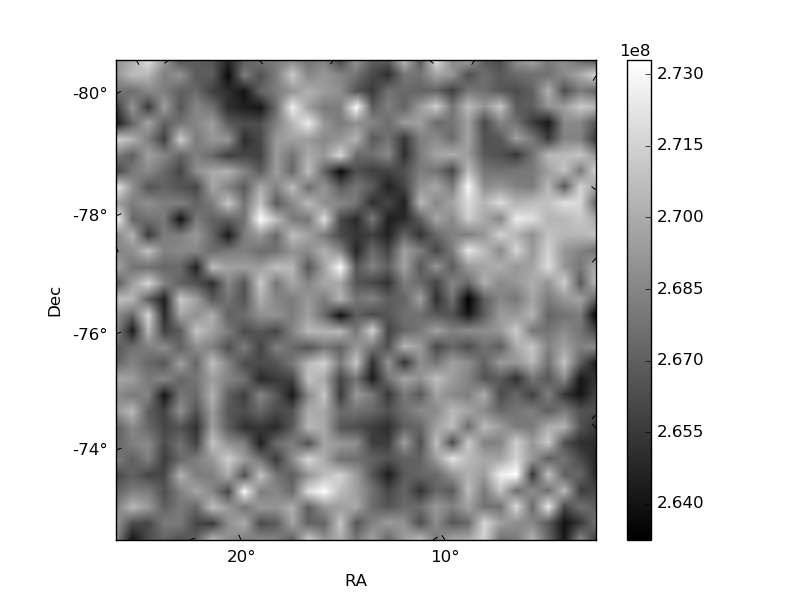
Histogram calculated using DETX and DETY for each event in the final _common_clean file
| Quadrant A | 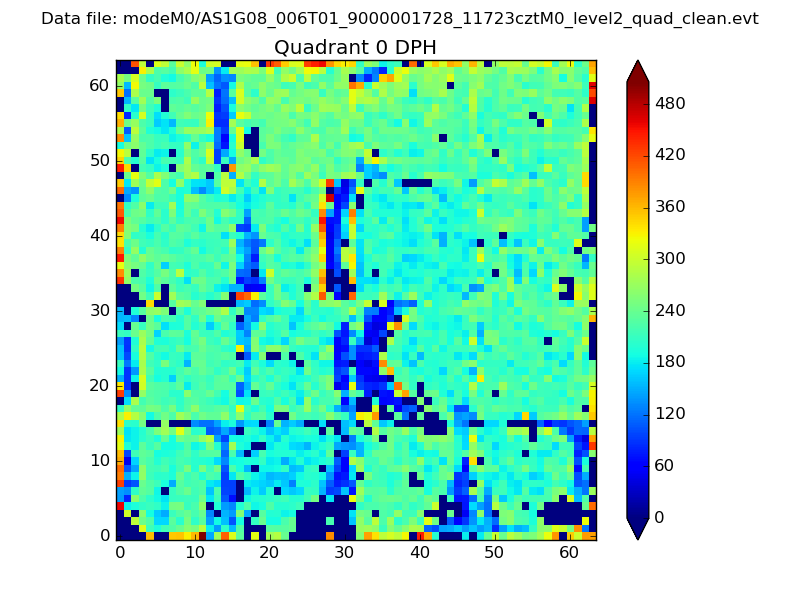 |
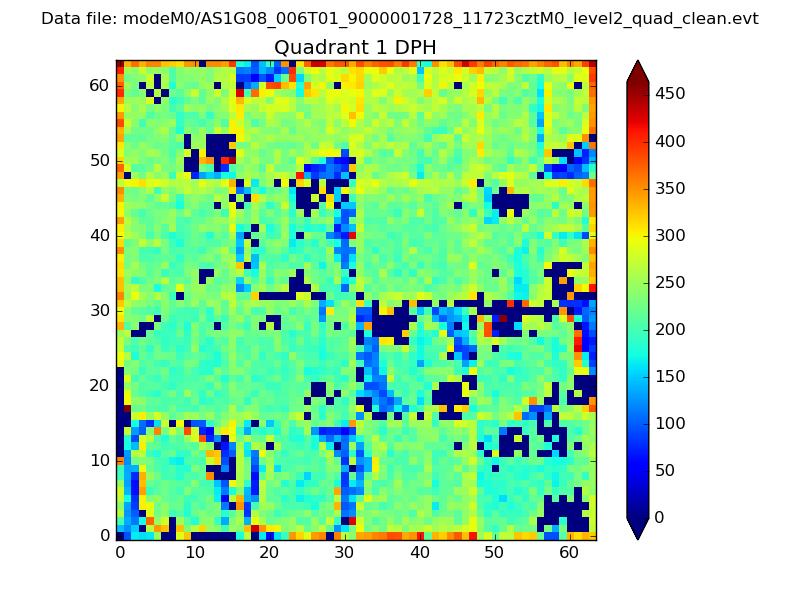 |
Quadrant B |
|---|---|---|---|
| Quadrant D | 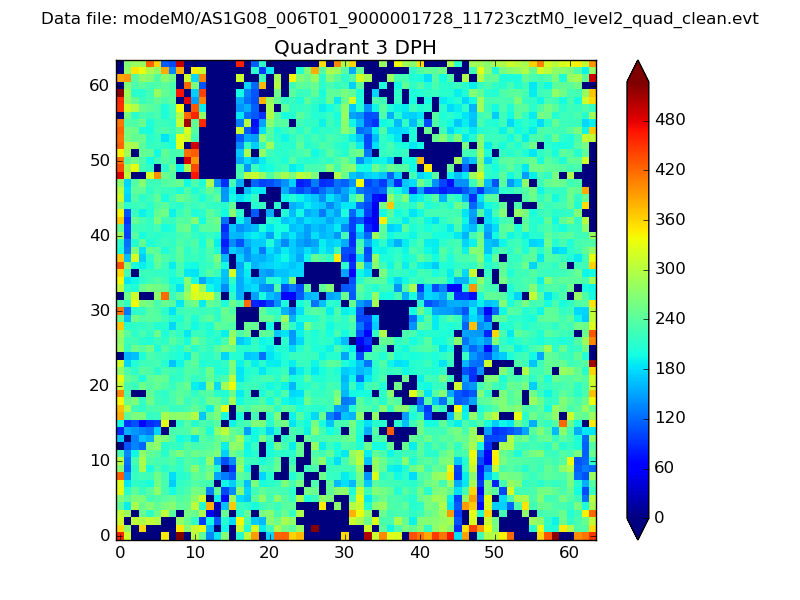 |
 |
Quadrant C |
| Plot type | Count rate plots | Images |
|---|---|---|
| Comparison with Poisson distribution Blue bars denote a histogram of data divided into 1 sec bins. Red curve is a Poisson curve with rate = median count rate of data. |
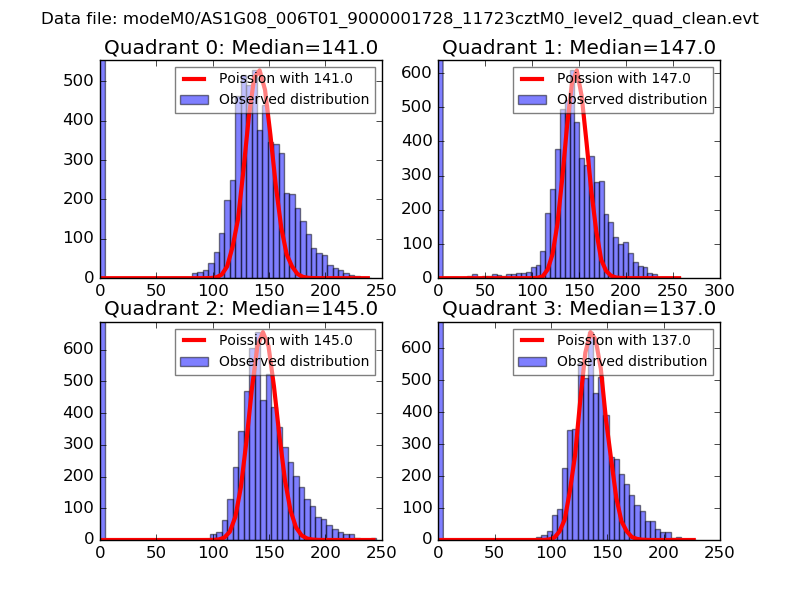 |
 |
| Quadrant-wise count rates Data is divided into 100 sec bins |
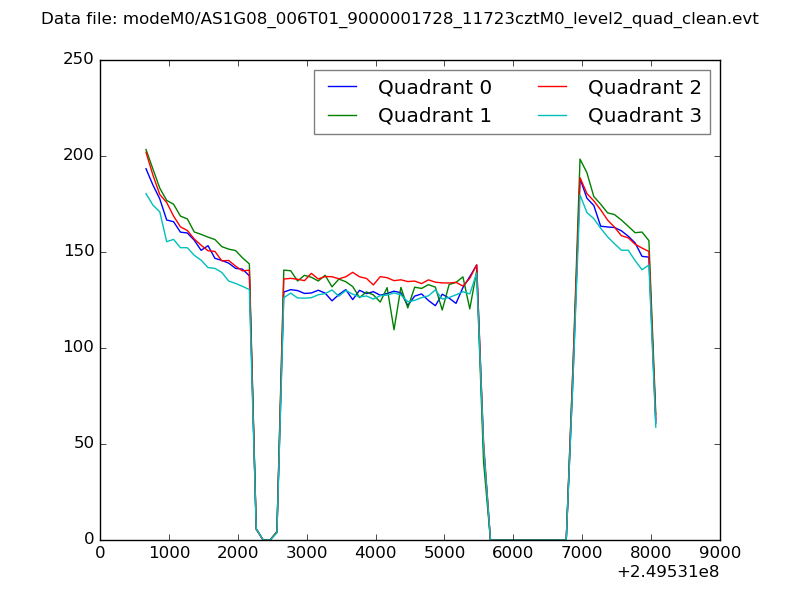 |
|
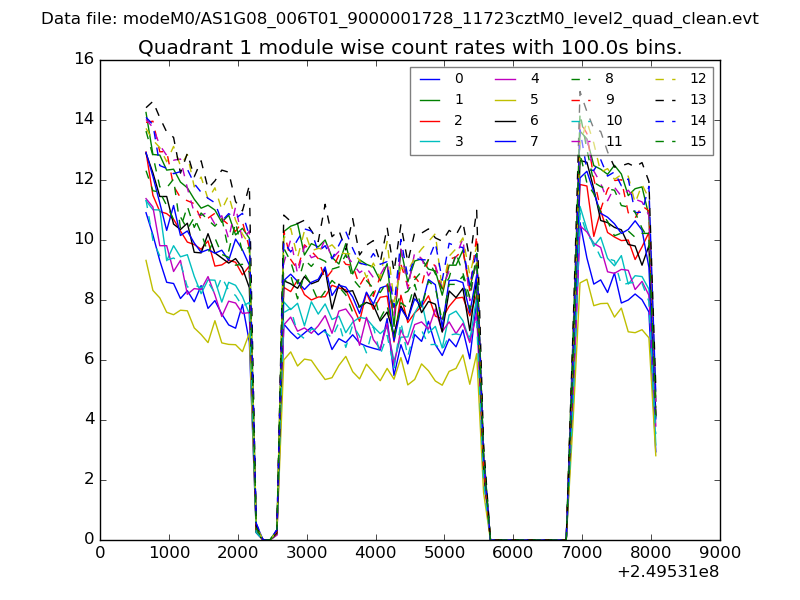
| Module-wise count rates for Quadrant A Data is divided into 100 sec bins |
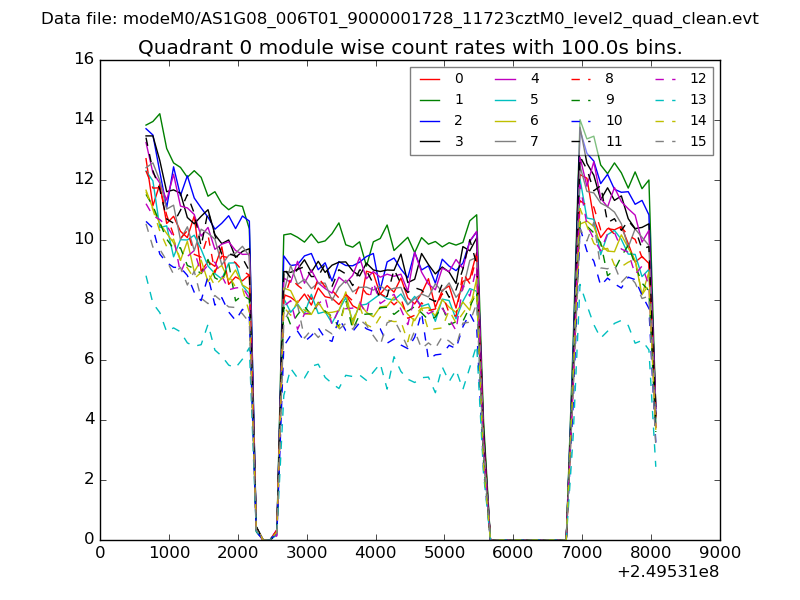 |
 |
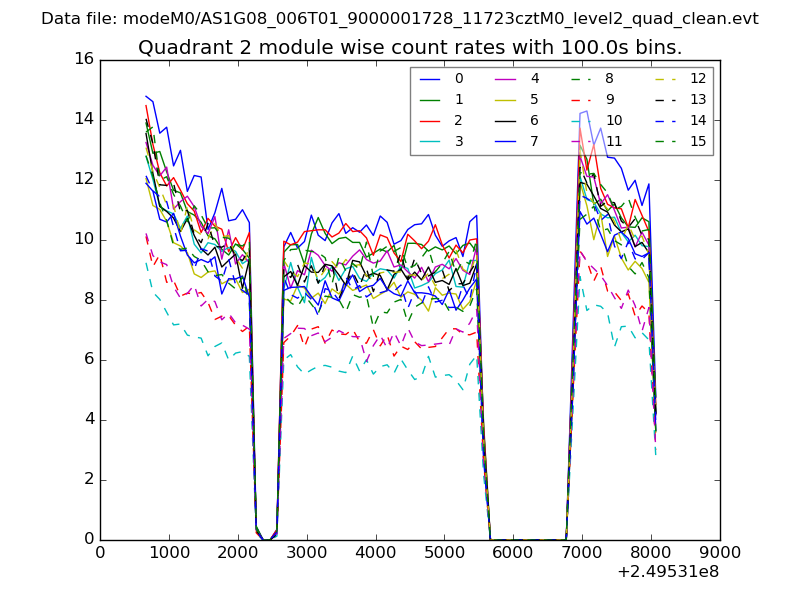
| Module-wise count rates for Quadrant B Data is divided into 100 sec bins |
 |
 |
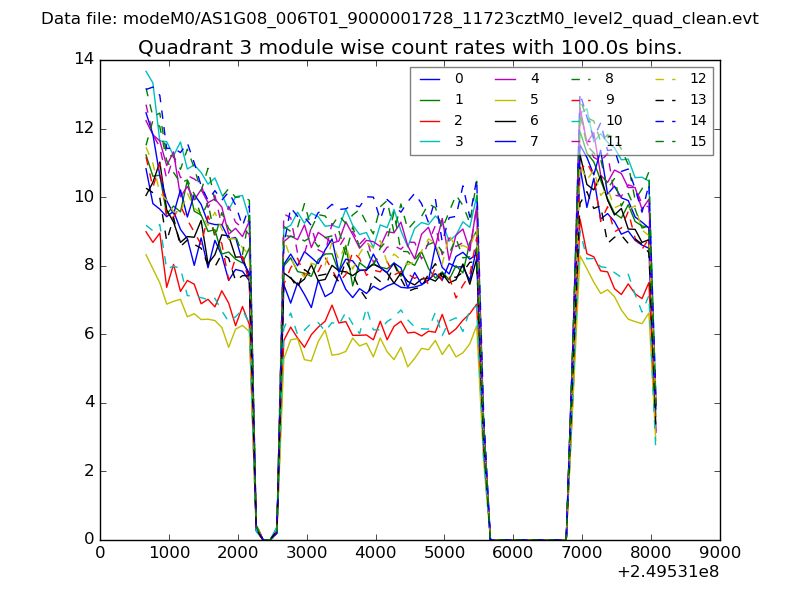
| Module-wise count rates for Quadrant C Data is divided into 100 sec bins |
 |
 |
| Module-wise count rates for Quadrant D Data is divided into 100 sec bins |
 |
 |
| Parameter | Plot |
|---|---|
| CZT HV Monitor | 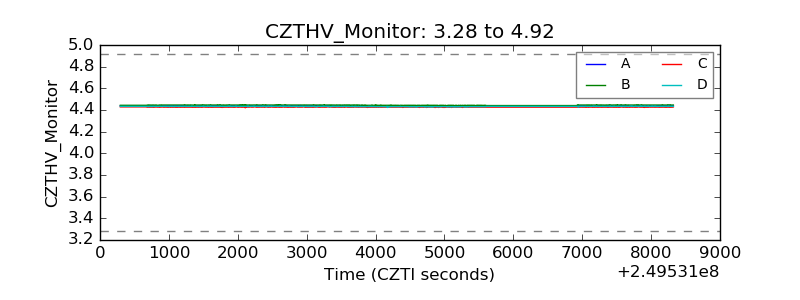 |
| D_VDD | 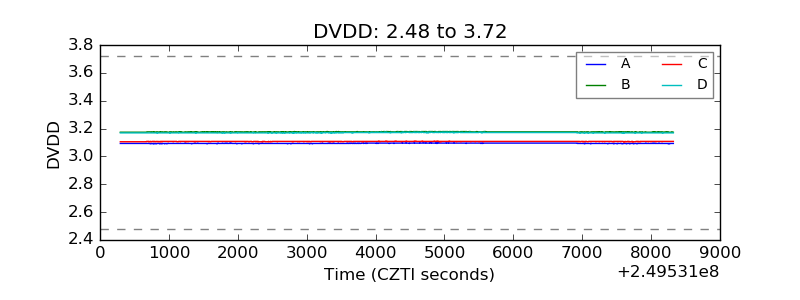 |
| Temperature 1 | 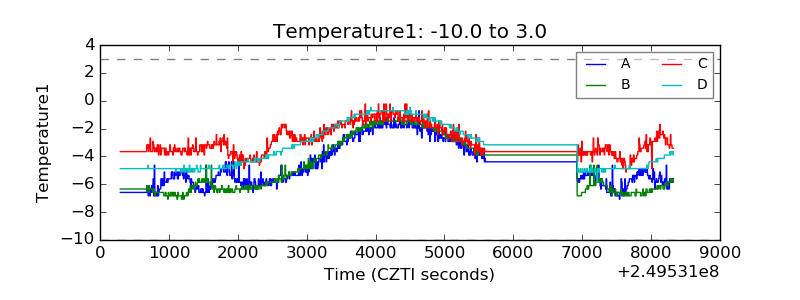 |
| Veto HV Monitor | 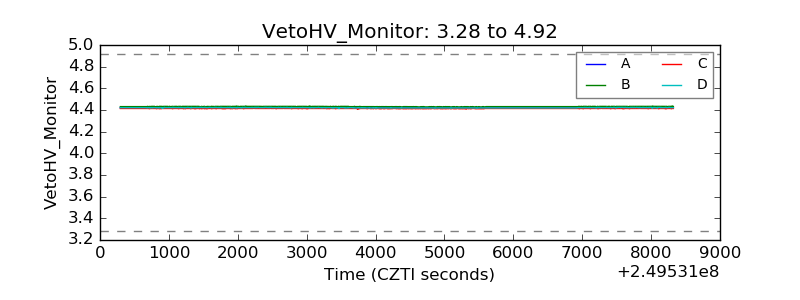 |
| Veto LLD | 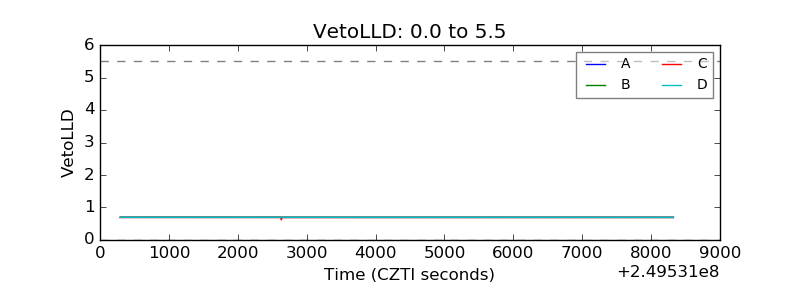 |
| Alpha Counter | 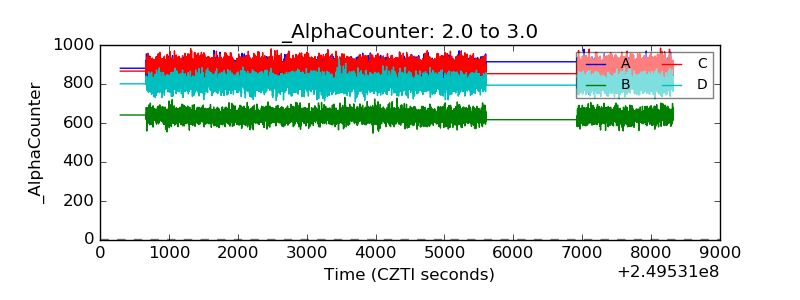 |
| _CPM_Rate | 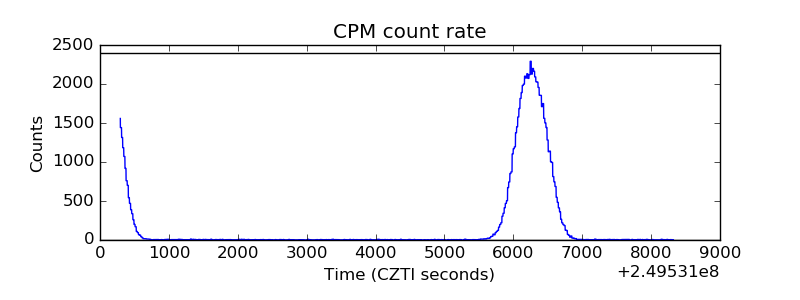 |
| CZT Counter | 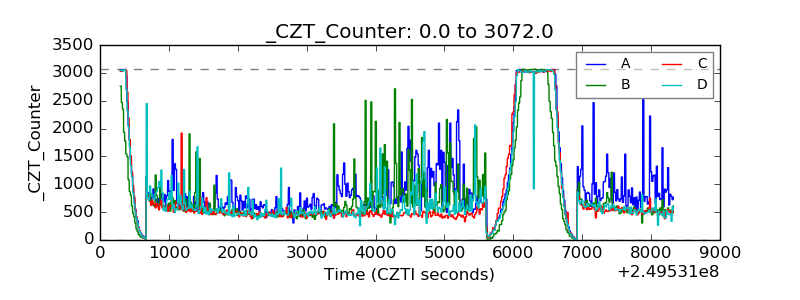 |
| +2.5 Volts monitor | 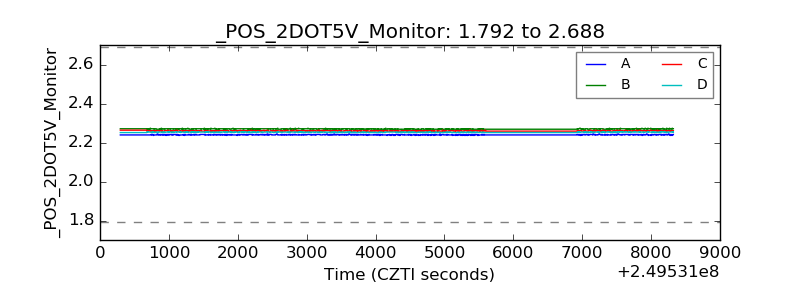 |
| +5 Volts monitor |  |
| _ROLL_ROT | 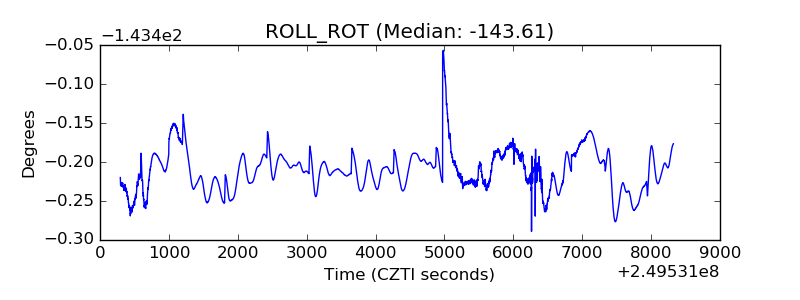 |
| _Roll_DEC | 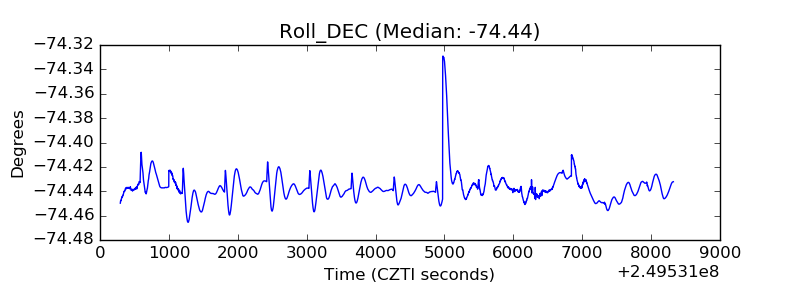 |
| _Roll_RA | 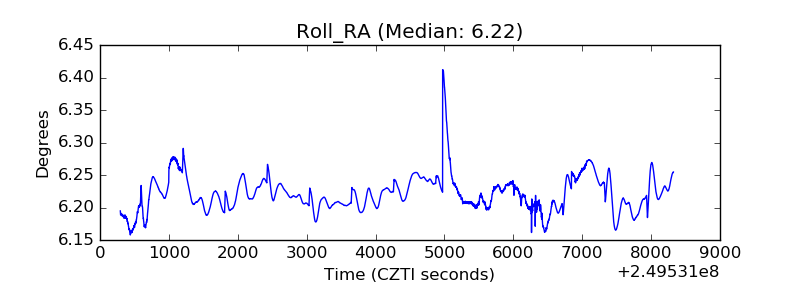 |
| Veto Counter | 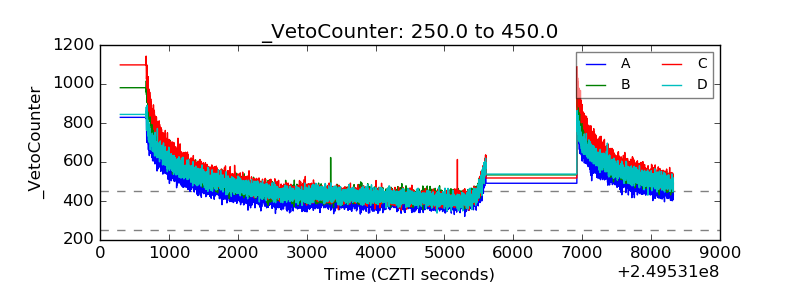 |