| Param | Original file | Final file |
|---|---|---|
| Filename | modeM0/AS1G08_006T01_9000001728_11724cztM0_level2.evt | modeM0/AS1G08_006T01_9000001728_11724cztM0_level2_quad_clean.evt |
| Size (bytes) | 517,092,480 | 110,355,840 |
| Size | 493.1 MB | 105.2 MB |
| Events in quadrant A | 5,210,999 | 718,649 |
| Events in quadrant B | 3,721,023 | 749,876 |
| Events in quadrant C | 2,933,027 | 748,764 |
| Events in quadrant D | 3,391,284 | 708,526 |
| Mode SS | |||
|---|---|---|---|
| Quadrant | BADHDUFLAG | Total packets | Discarded packets |
| A | 0 | 120 | 0 |
| B | 0 | 120 | 0 |
| C | 0 | 120 | 0 |
| D | 0 | 120 | 0 |
| Mode M9 | |||
|---|---|---|---|
| Quadrant | BADHDUFLAG | Total packets | Discarded packets |
| A | 0 | 13 | 0 |
| B | 0 | 13 | 0 |
| C | 0 | 13 | 0 |
| D | 0 | 13 | 0 |
| Mode M0 | |||
|---|---|---|---|
| Quadrant | BADHDUFLAG | Total packets | Discarded packets |
| A | 0 | 19652 | 2 |
| B | 0 | 14620 | 1 |
| C | 0 | 12334 | 1 |
| D | 0 | 13611 | 1 |
| Quadrant | Total seconds | Saturated seconds | Saturation percentage |
|---|---|---|---|
| A | 5963 | 322 | 5.399966% |
| B | 5963 | 223 | 3.739728% |
| C | 5963 | 57 | 0.955895% |
| D | 5963 | 83 | 1.391917% |
Noise dominated data is calculated using 1-second bins in cleaned event files. If a bin has >2000 counts, and if more than 50% of those come from <1% of pixels, then it is considered to be noise-dominated and hence unusable.
| Quadrant | # 1 sec bins | Bins with >0 counts | Bins with >2000 counts | High rate bins dominated by noise | Noise dominated (total time) | Noise dominated (detector-on time) | Marked lightcurve |
|---|---|---|---|---|---|---|---|
| A | 7269 | 5965 | 130 | 130 | 1.79% | 2.18% | 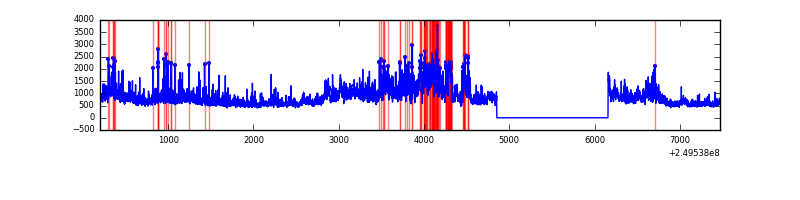 |
| B | 7269 | 5965 | 72 | 72 | 0.99% | 1.21% | 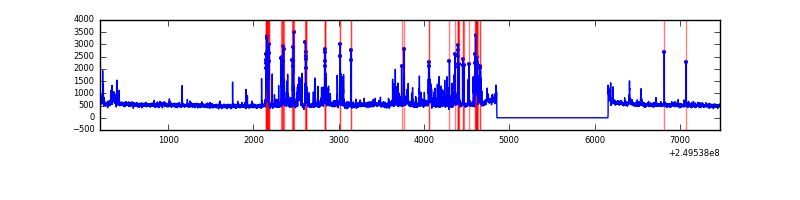 |
| C | 7269 | 5965 | 0 | 0 | 0.00% | 0.00% | 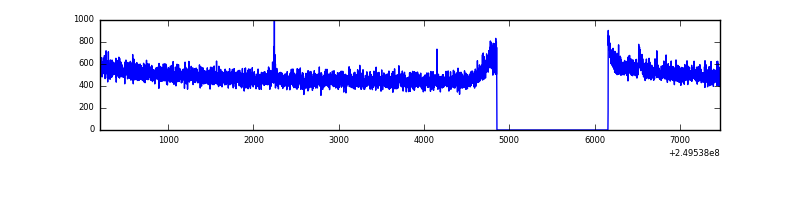 |
| D | 7269 | 5965 | 28 | 28 | 0.39% | 0.47% | 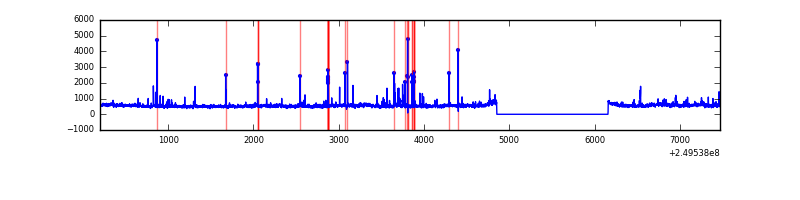 |
Top three noisy pixels from each quadrant. If the there are fewer than three noisy pixels in the level2.evt file, extra rows are filled as -1
| Pixel properties | Quadrant properties | ||||||
|---|---|---|---|---|---|---|---|
| Quadrant | DetID | PixID | Counts | Sigma | Mean | Median | Sigma |
| A | 8 | 15 | 1964112 | 13204.35 | 750 | 735 | 148.7 |
| A | 1 | 162 | 119999 | 802.09 | 750 | 735 | 148.7 |
| A | 1 | 178 | 67533 | 449.24 | 750 | 735 | 148.7 |
| B | 4 | 239 | 528872 | 3808.2 | 758 | 741 | 138.7 |
| B | 15 | 204 | 91340 | 653.28 | 758 | 741 | 138.7 |
| B | 10 | 245 | 85131 | 608.51 | 758 | 741 | 138.7 |
| C | 4 | 222 | 5945 | 30.71 | 749 | 754 | 169.0 |
| C | 13 | 61 | 5656 | 29.0 | 749 | 754 | 169.0 |
| C | 14 | 234 | 4068 | 19.61 | 749 | 754 | 169.0 |
| D | 8 | 195 | 322373 | 1875.06 | 740 | 721 | 171.5 |
| D | 13 | 249 | 85319 | 493.16 | 740 | 721 | 171.5 |
| D | 13 | 137 | 40973 | 234.65 | 740 | 721 | 171.5 |
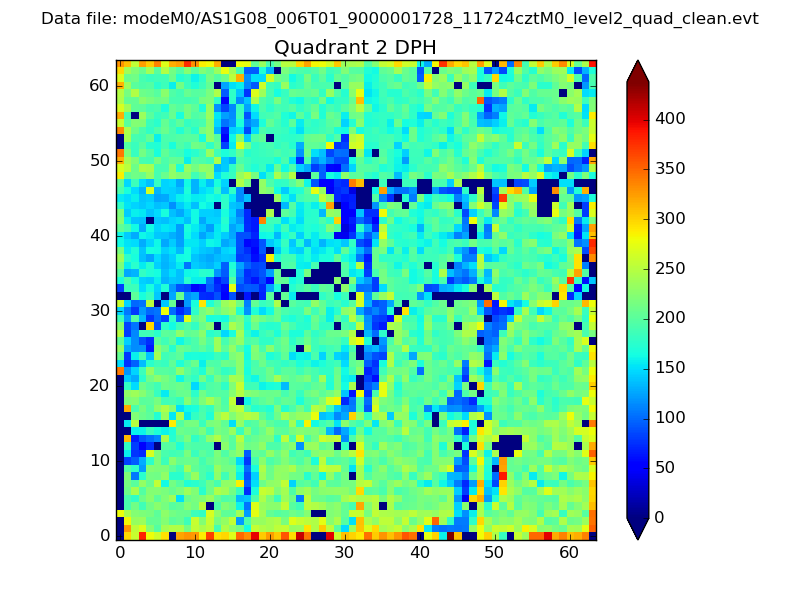
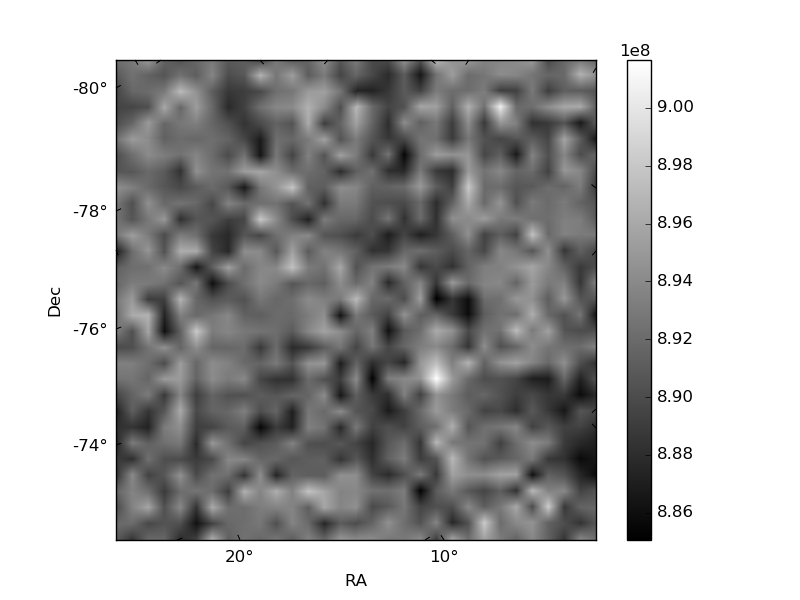
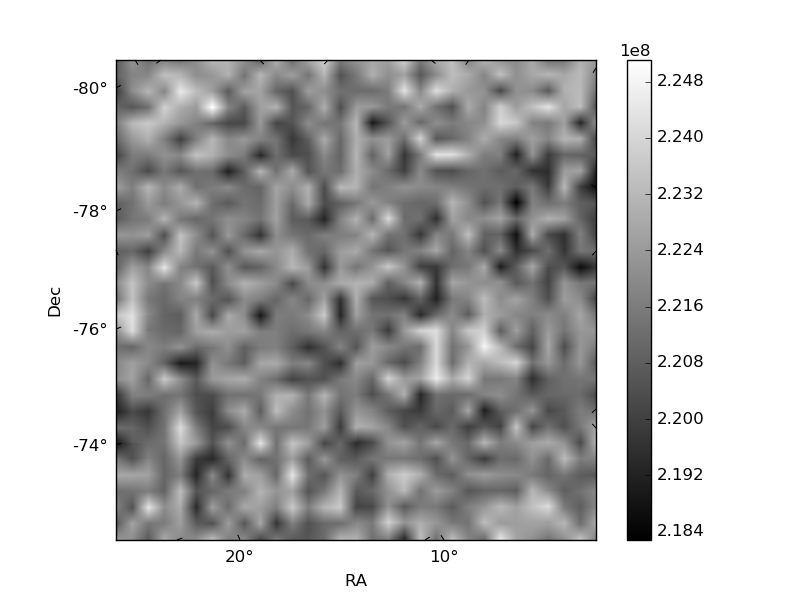
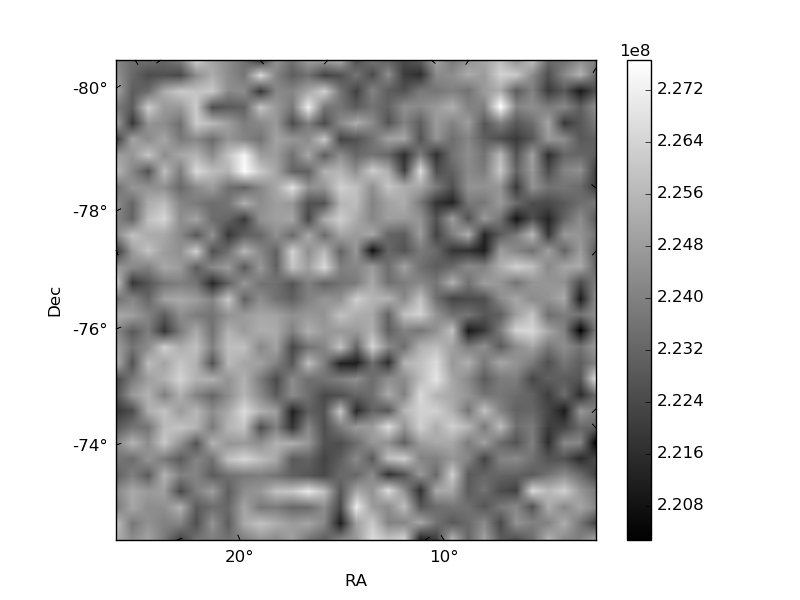
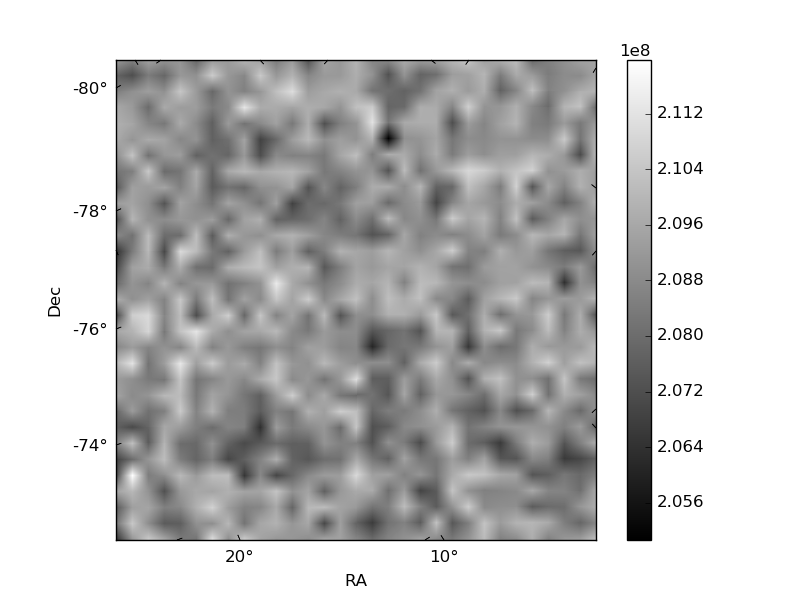
Histogram calculated using DETX and DETY for each event in the final _common_clean file
| Quadrant A | 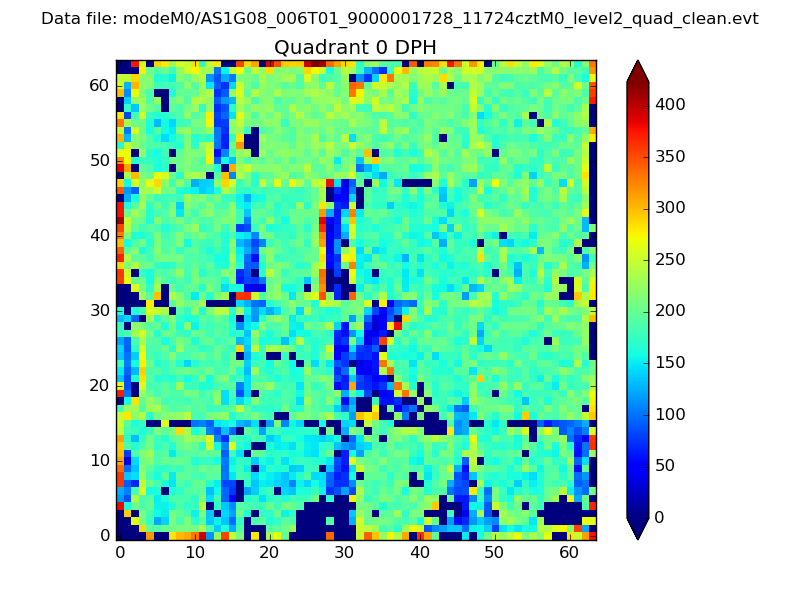 |
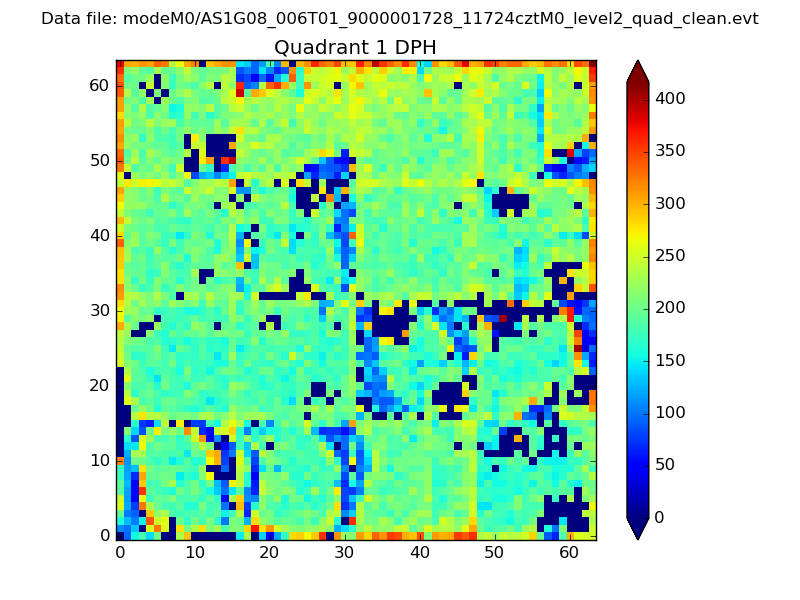 |
Quadrant B |
|---|---|---|---|
| Quadrant D | 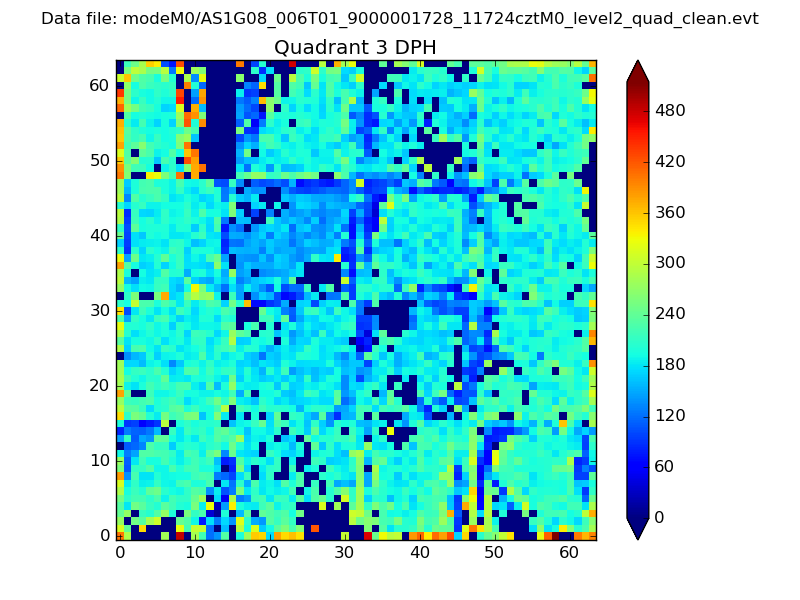 |
 |
Quadrant C |
| Plot type | Count rate plots | Images |
|---|---|---|
| Comparison with Poisson distribution Blue bars denote a histogram of data divided into 1 sec bins. Red curve is a Poisson curve with rate = median count rate of data. |
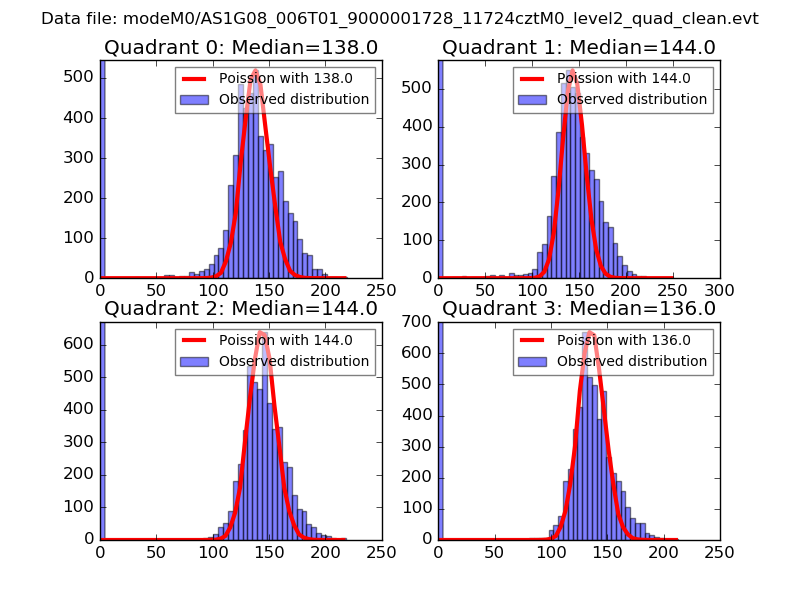 |
 |
| Quadrant-wise count rates Data is divided into 100 sec bins |
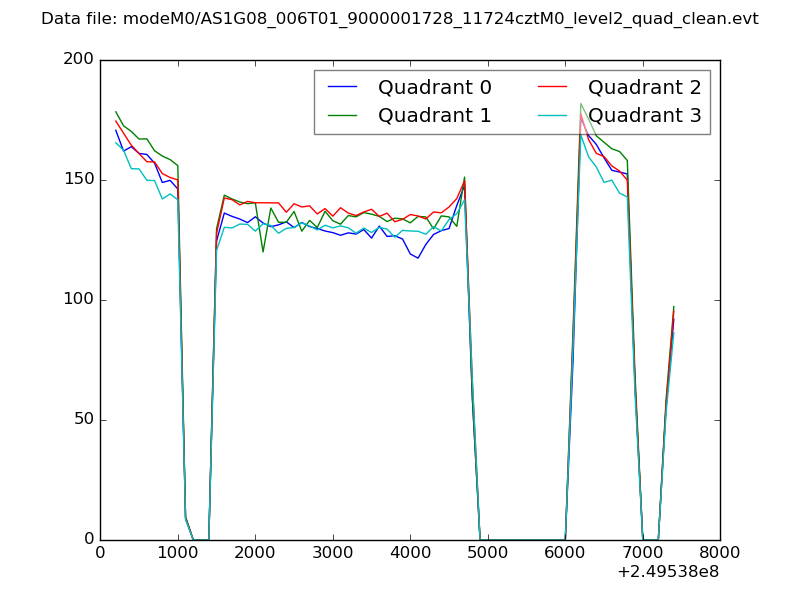 |
|
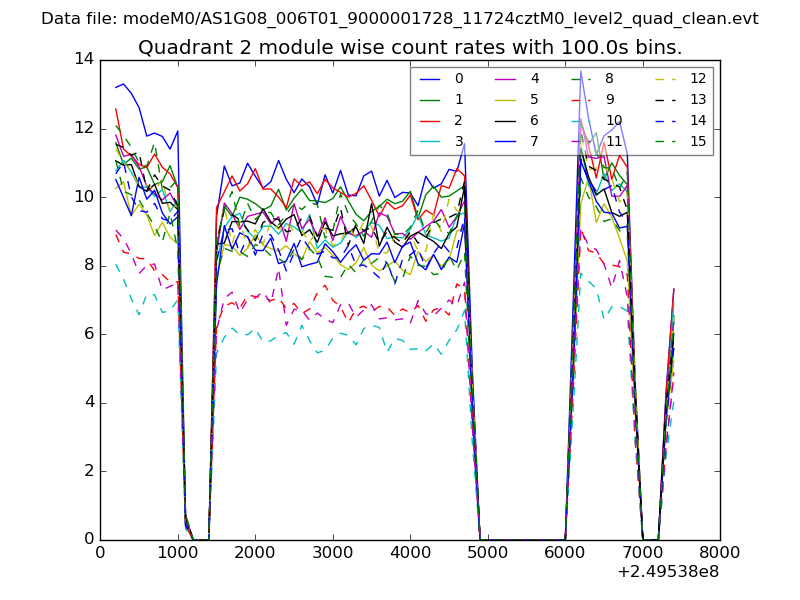
| Module-wise count rates for Quadrant A Data is divided into 100 sec bins |
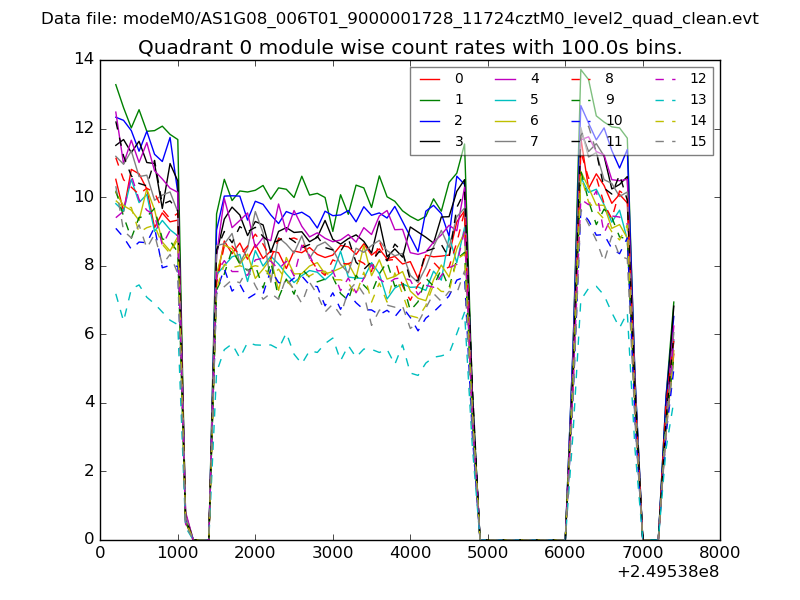 |
 |
| Module-wise count rates for Quadrant B Data is divided into 100 sec bins |
 |
 |
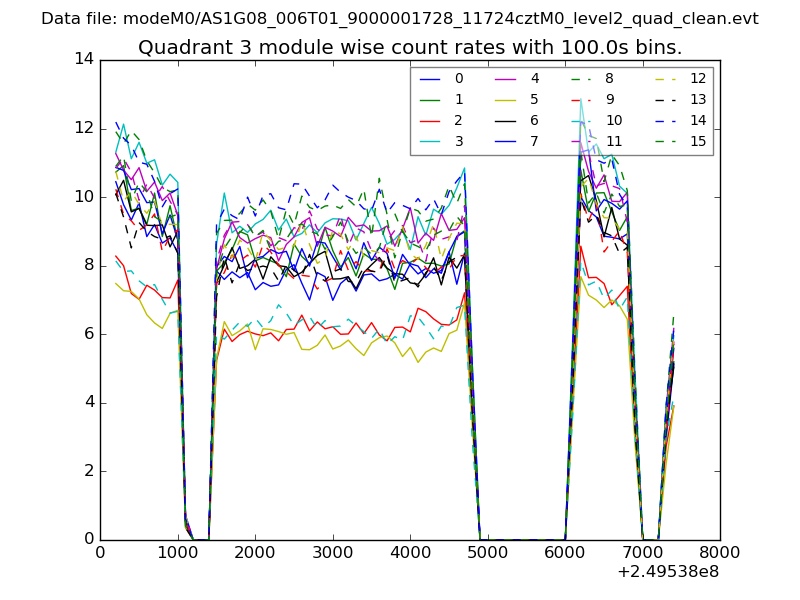
| Module-wise count rates for Quadrant C Data is divided into 100 sec bins |
 |
 |
| Module-wise count rates for Quadrant D Data is divided into 100 sec bins |
 |
 |
| Parameter | Plot |
|---|---|
| CZT HV Monitor | 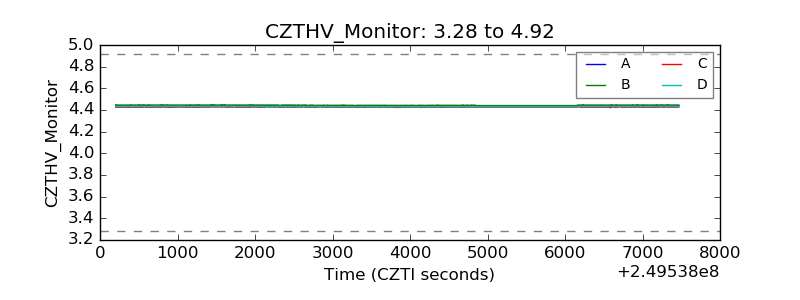 |
| D_VDD | 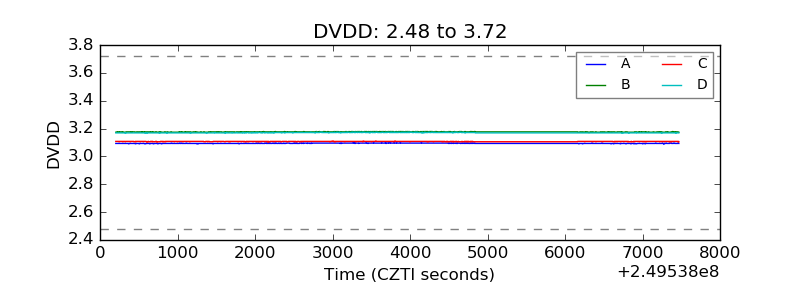 |
| Temperature 1 | 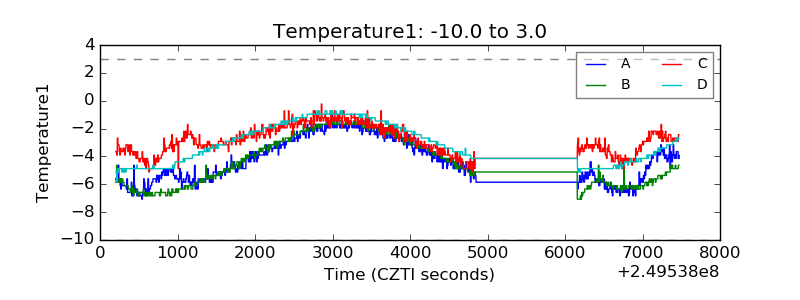 |
| Veto HV Monitor | 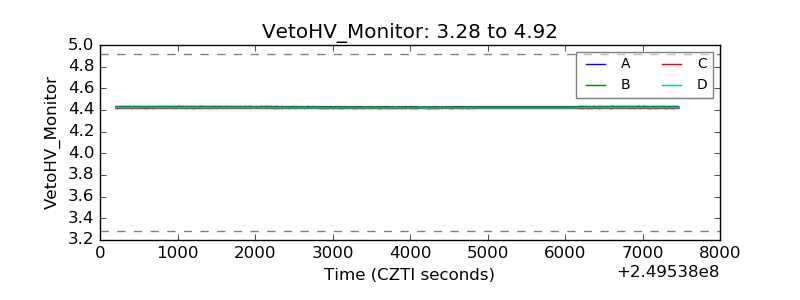 |
| Veto LLD | 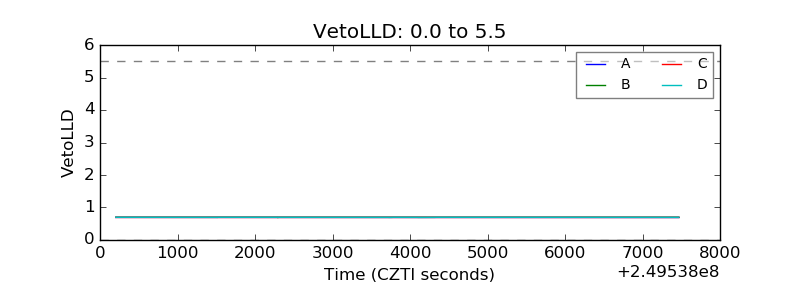 |
| Alpha Counter | 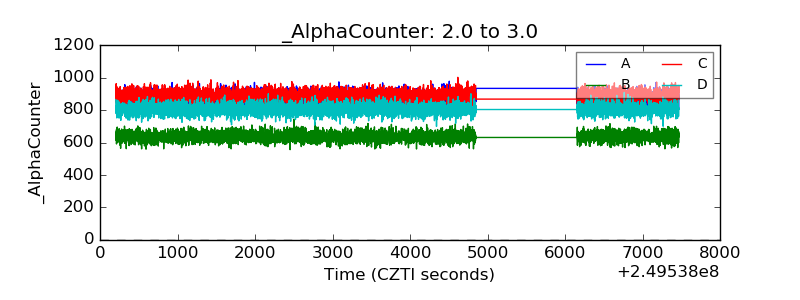 |
| _CPM_Rate | 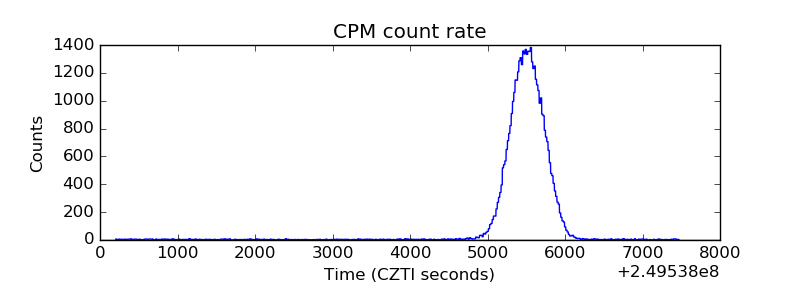 |
| CZT Counter | 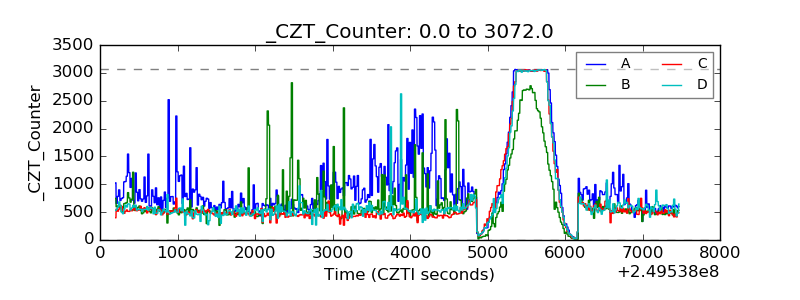 |
| +2.5 Volts monitor |  |
| +5 Volts monitor | 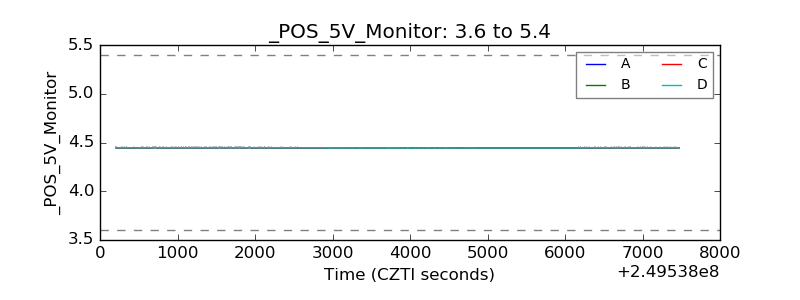 |
| _ROLL_ROT | 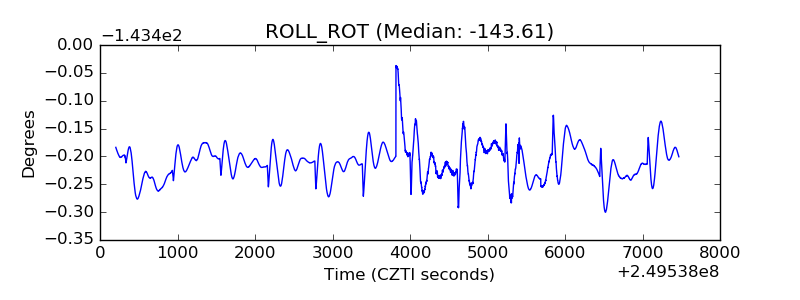 |
| _Roll_DEC | 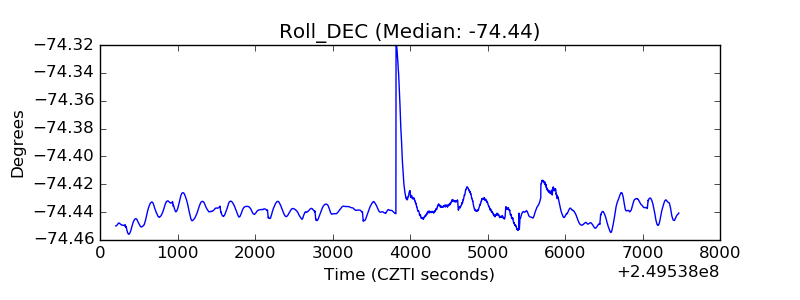 |
| _Roll_RA | 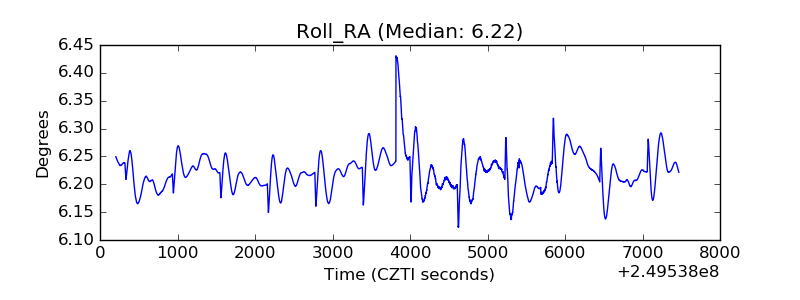 |
| Veto Counter | 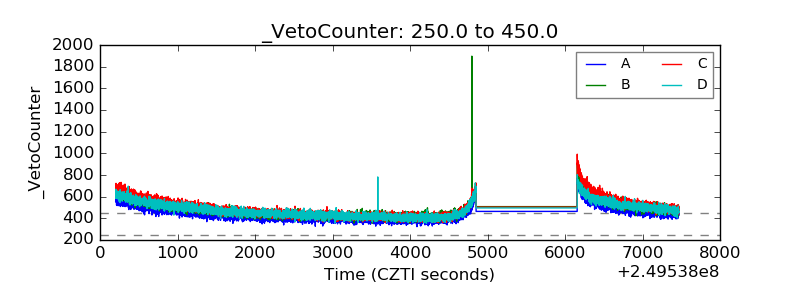 |