| Param | Original file | Final file |
|---|---|---|
| Filename | modeM0/AS1G08_006T01_9000001728_11727cztM0_level2.evt | modeM0/AS1G08_006T01_9000001728_11727cztM0_level2_quad_clean.evt |
| Size (bytes) | 755,884,800 | 127,851,840 |
| Size | 720.9 MB | 121.9 MB |
| Events in quadrant A | 6,739,033 | 832,483 |
| Events in quadrant B | 5,351,221 | 853,638 |
| Events in quadrant C | 3,316,072 | 874,893 |
| Events in quadrant D | 6,990,838 | 800,590 |
| Mode SS | |||
|---|---|---|---|
| Quadrant | BADHDUFLAG | Total packets | Discarded packets |
| A | 0 | 148 | 0 |
| B | 0 | 148 | 0 |
| C | 0 | 148 | 0 |
| D | 0 | 148 | 0 |
| Mode M9 | |||
|---|---|---|---|
| Quadrant | BADHDUFLAG | Total packets | Discarded packets |
| A | 0 | 4 | 0 |
| B | 0 | 4 | 0 |
| C | 0 | 4 | 0 |
| D | 0 | 4 | 0 |
| Mode M0 | |||
|---|---|---|---|
| Quadrant | BADHDUFLAG | Total packets | Discarded packets |
| A | 0 | 25258 | 2 |
| B | 0 | 20692 | 1 |
| C | 0 | 15046 | 1 |
| D | 0 | 25772 | 1 |
| Quadrant | Total seconds | Saturated seconds | Saturation percentage |
|---|---|---|---|
| A | 7328 | 780 | 10.644105% |
| B | 7328 | 656 | 8.951965% |
| C | 7328 | 156 | 2.128821% |
| D | 7328 | 690 | 9.415939% |
Noise dominated data is calculated using 1-second bins in cleaned event files. If a bin has >2000 counts, and if more than 50% of those come from <1% of pixels, then it is considered to be noise-dominated and hence unusable.
| Quadrant | # 1 sec bins | Bins with >0 counts | Bins with >2000 counts | High rate bins dominated by noise | Noise dominated (total time) | Noise dominated (detector-on time) | Marked lightcurve |
|---|---|---|---|---|---|---|---|
| A | 7714 | 7330 | 298 | 298 | 3.86% | 4.07% | 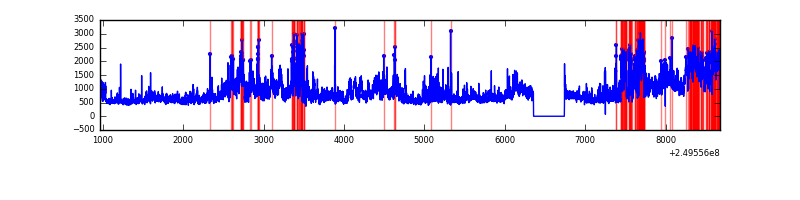 |
| B | 7714 | 7330 | 261 | 261 | 3.38% | 3.56% | 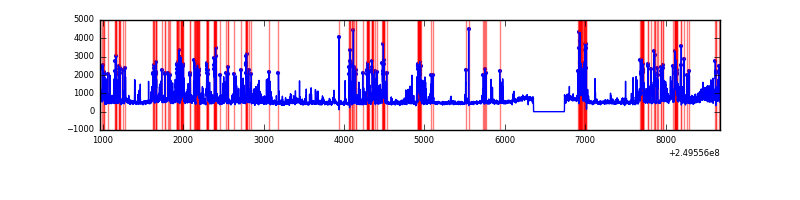 |
| C | 7714 | 7330 | 0 | 0 | 0.00% | 0.00% | 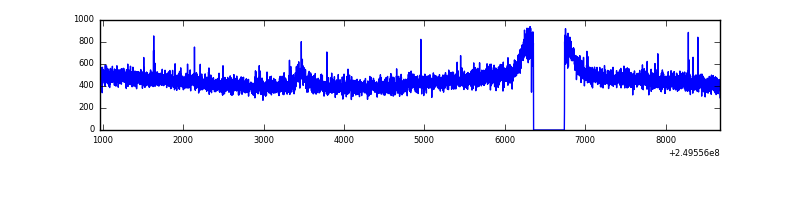 |
| D | 7714 | 7330 | 563 | 563 | 7.30% | 7.68% | 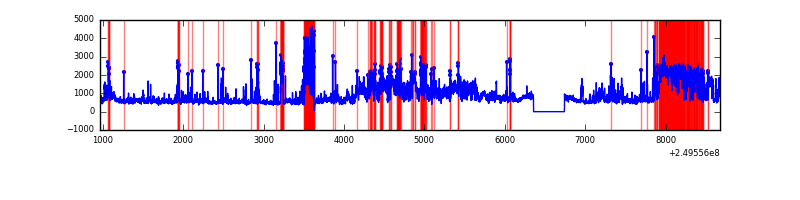 |
Top three noisy pixels from each quadrant. If the there are fewer than three noisy pixels in the level2.evt file, extra rows are filled as -1
| Pixel properties | Quadrant properties | ||||||
|---|---|---|---|---|---|---|---|
| Quadrant | DetID | PixID | Counts | Sigma | Mean | Median | Sigma |
| A | 8 | 15 | 2714427 | 15897.58 | 843 | 822 | 170.7 |
| A | 1 | 162 | 226510 | 1322.19 | 843 | 822 | 170.7 |
| A | 9 | 143 | 167295 | 975.28 | 843 | 822 | 170.7 |
| B | 4 | 239 | 1024906 | 6443.35 | 846 | 823 | 158.9 |
| B | 3 | 64 | 507021 | 3184.91 | 846 | 823 | 158.9 |
| B | 15 | 204 | 196537 | 1231.4 | 846 | 823 | 158.9 |
| C | 4 | 222 | 23340 | 116.38 | 843 | 845 | 193.3 |
| C | 13 | 61 | 6158 | 27.49 | 843 | 845 | 193.3 |
| C | 8 | 222 | 4275 | 17.75 | 843 | 845 | 193.3 |
| D | 1 | 52 | 2572810 | 13000.64 | 824 | 798 | 197.8 |
| D | 8 | 195 | 486110 | 2453.09 | 824 | 798 | 197.8 |
| D | 13 | 137 | 228186 | 1149.37 | 824 | 798 | 197.8 |
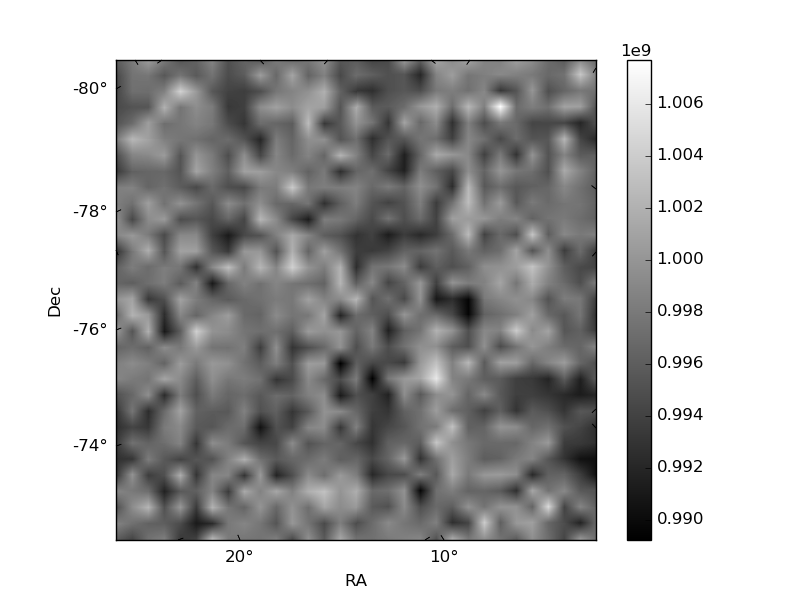
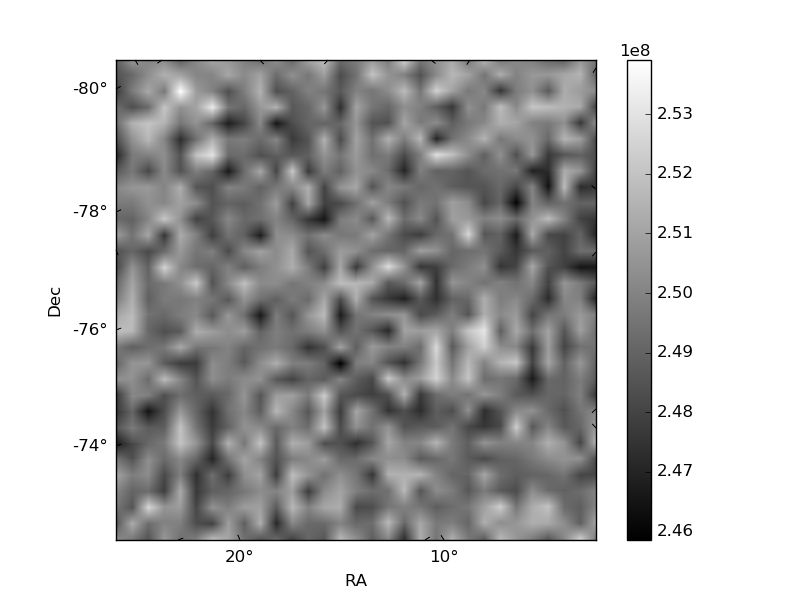
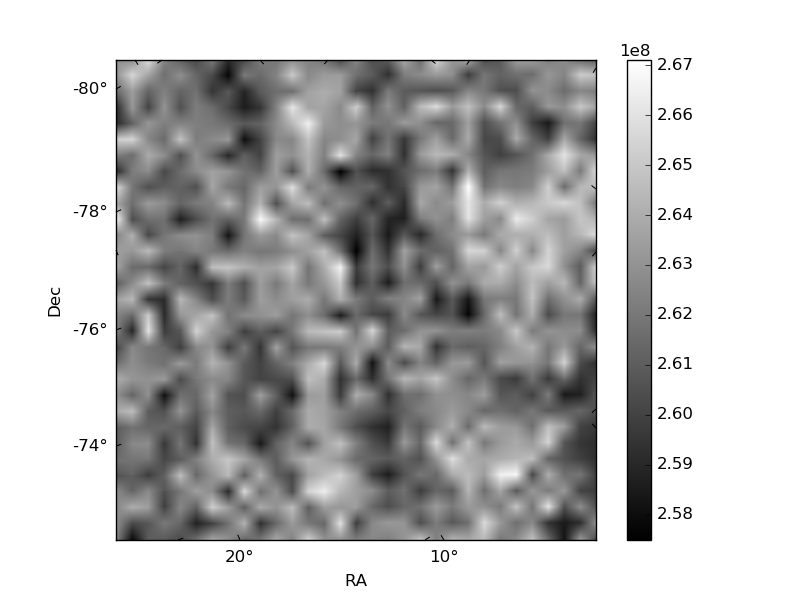
Histogram calculated using DETX and DETY for each event in the final _common_clean file
| Quadrant A | 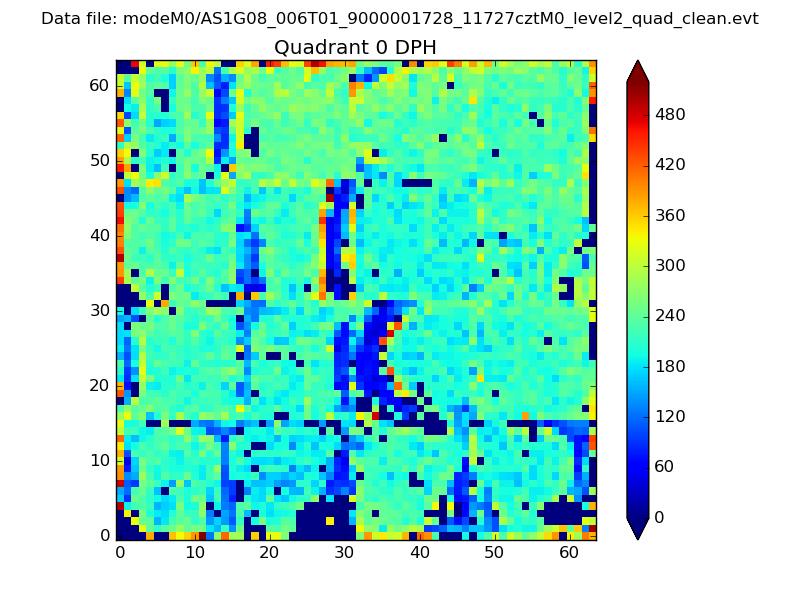 |
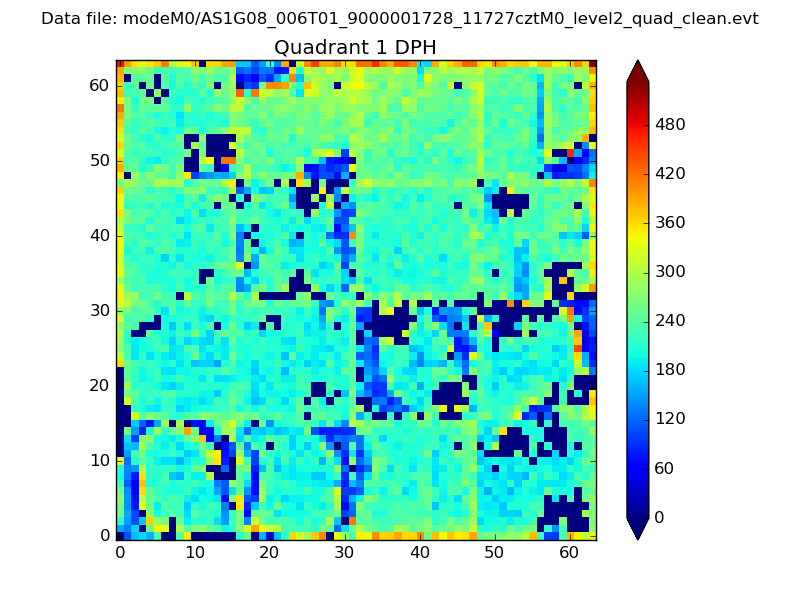 |
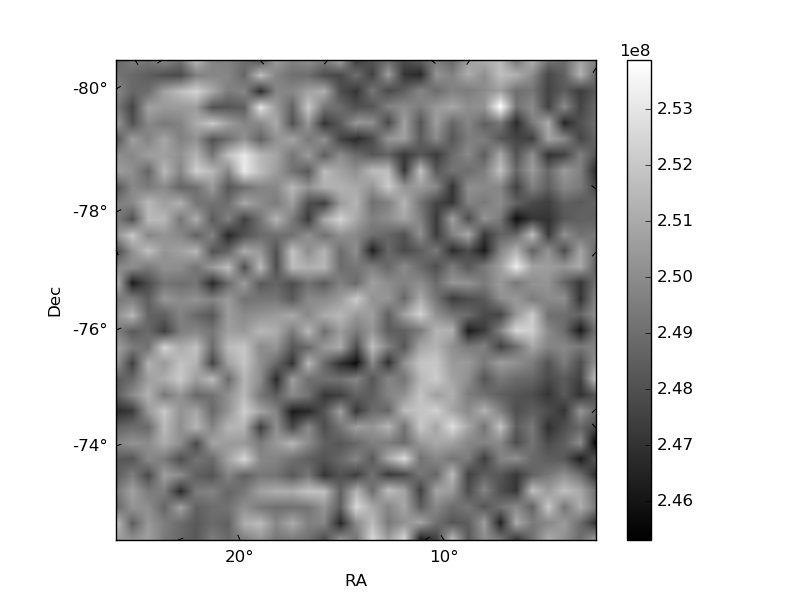
Quadrant B |
|---|---|---|---|
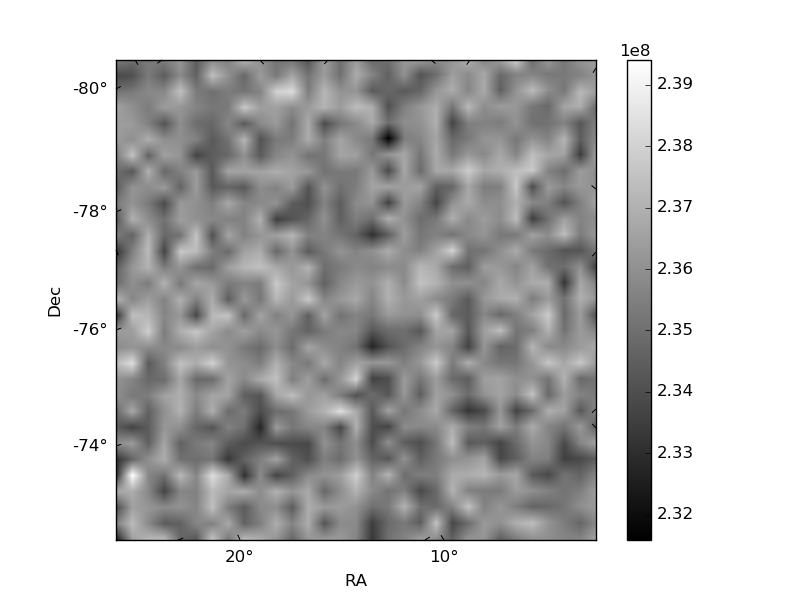
| Quadrant D | 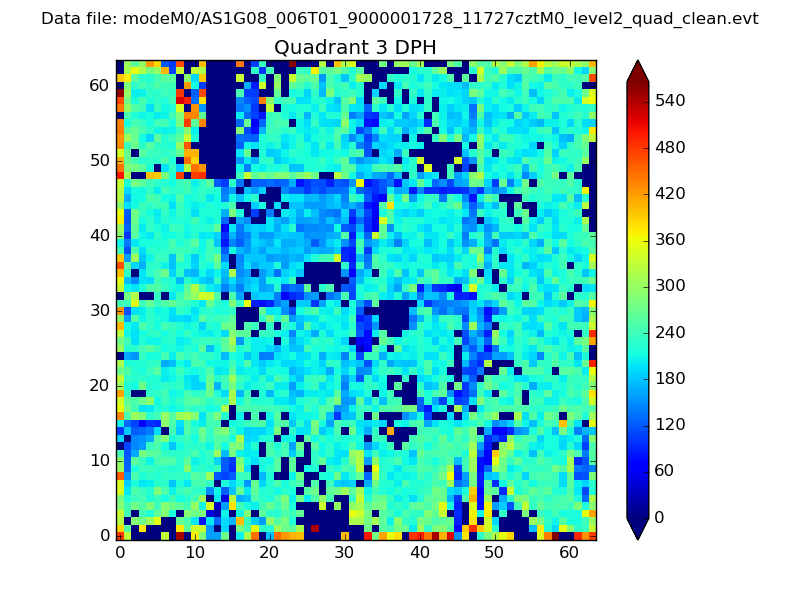 |
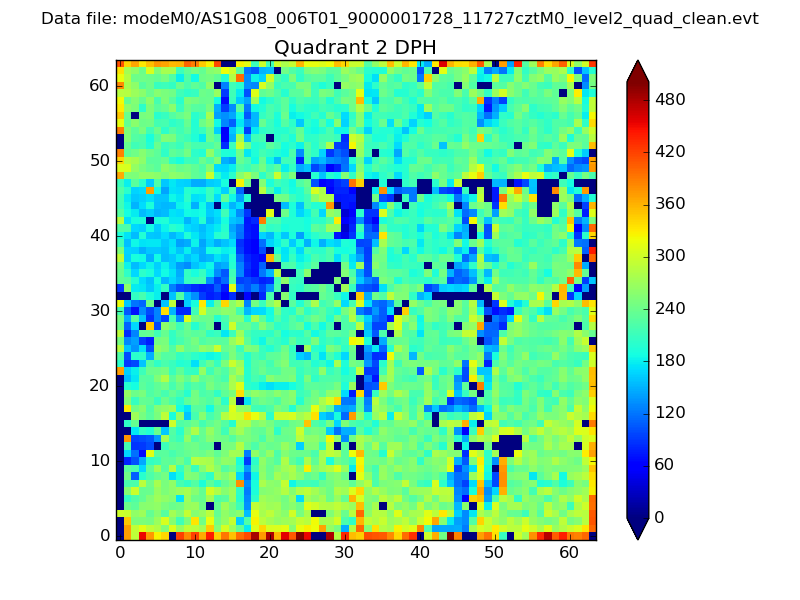 |
Quadrant C |
| Plot type | Count rate plots | Images |
|---|---|---|
| Comparison with Poisson distribution Blue bars denote a histogram of data divided into 1 sec bins. Red curve is a Poisson curve with rate = median count rate of data. |
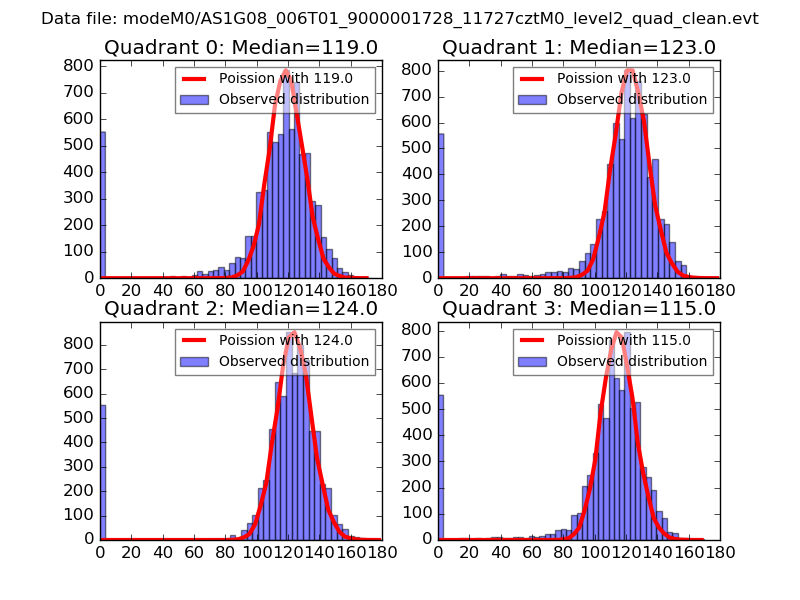 |
 |
| Quadrant-wise count rates Data is divided into 100 sec bins |
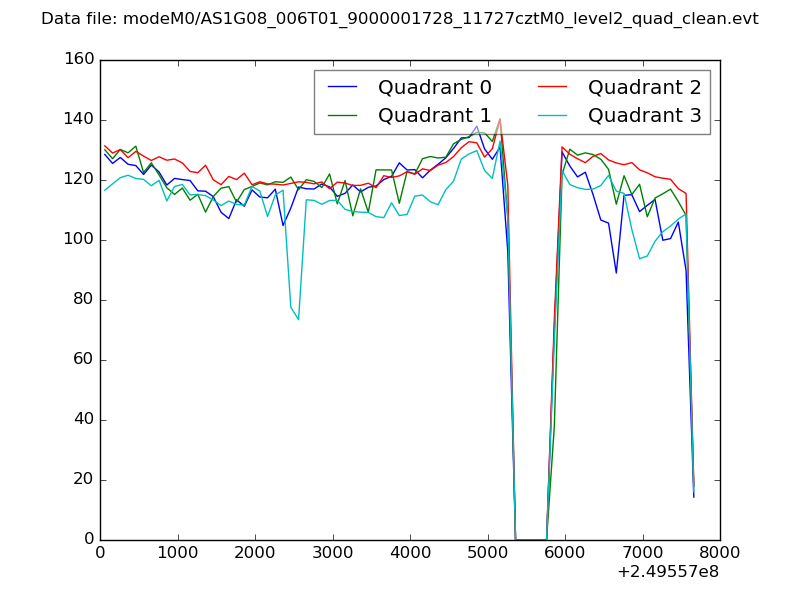 |
|
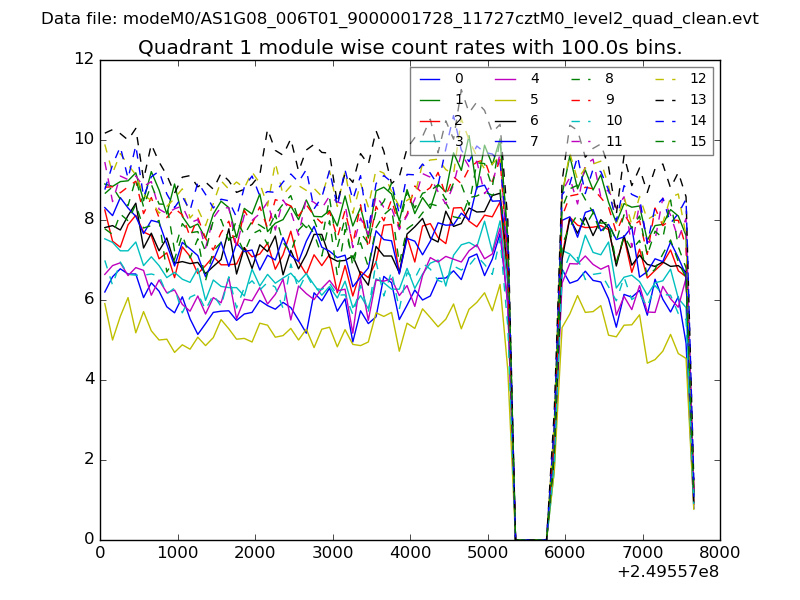
| Module-wise count rates for Quadrant A Data is divided into 100 sec bins |
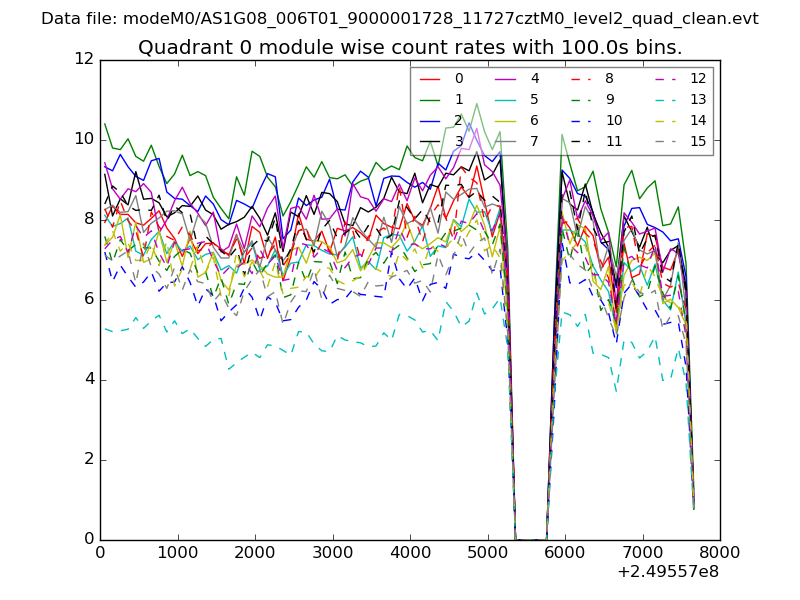 |
 |
| Module-wise count rates for Quadrant B Data is divided into 100 sec bins |
 |
 |
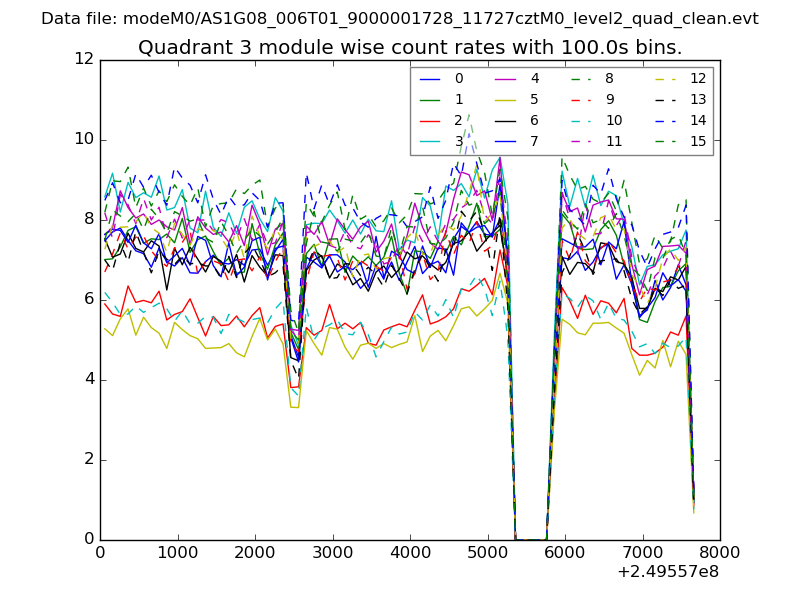
| Module-wise count rates for Quadrant C Data is divided into 100 sec bins |
 |
 |
| Module-wise count rates for Quadrant D Data is divided into 100 sec bins |
 |
 |
| Parameter | Plot |
|---|---|
| CZT HV Monitor | 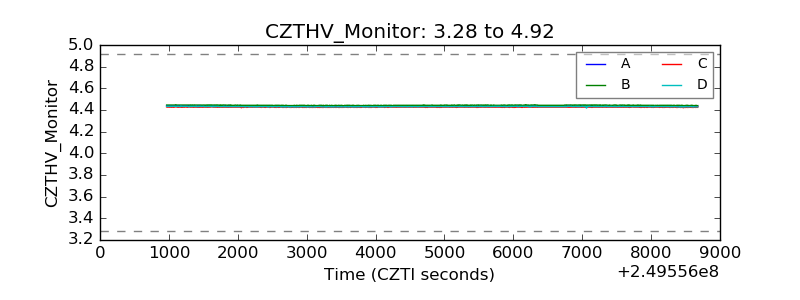 |
| D_VDD | 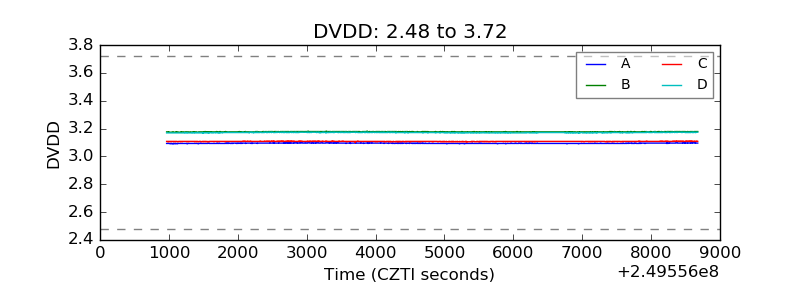 |
| Temperature 1 | 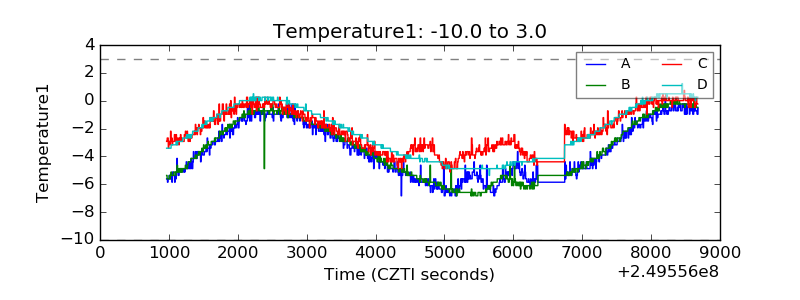 |
| Veto HV Monitor | 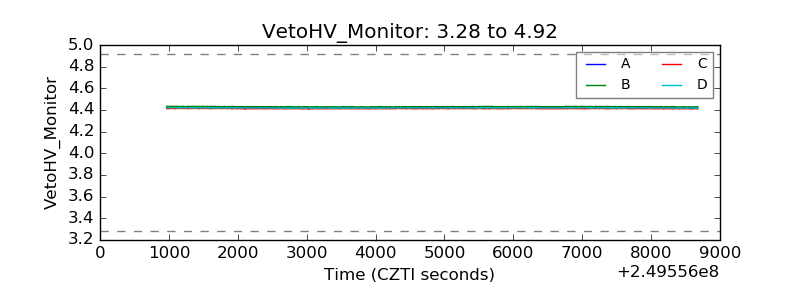 |
| Veto LLD | 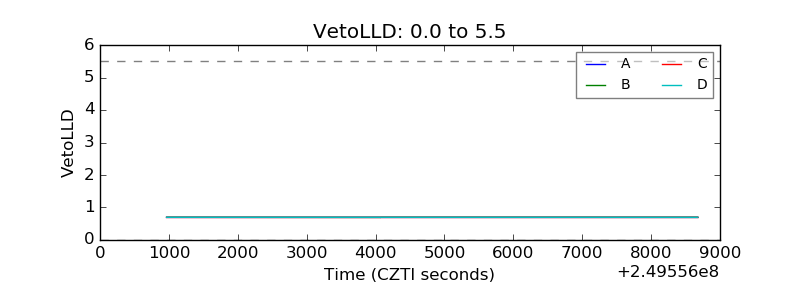 |
| Alpha Counter | 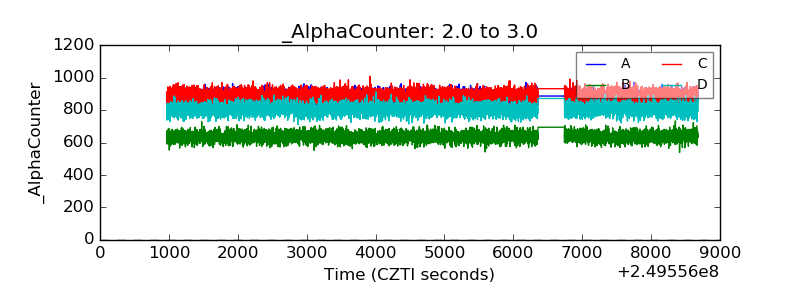 |
| _CPM_Rate | 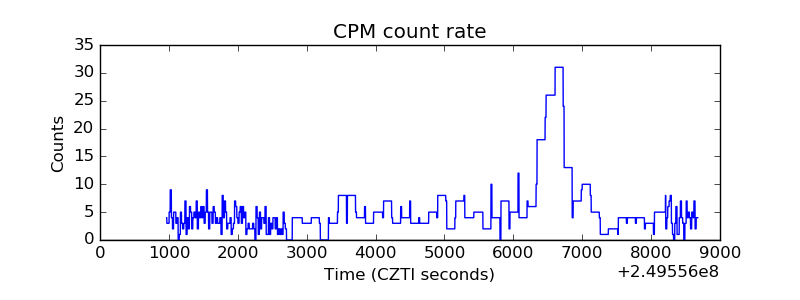 |
| CZT Counter | 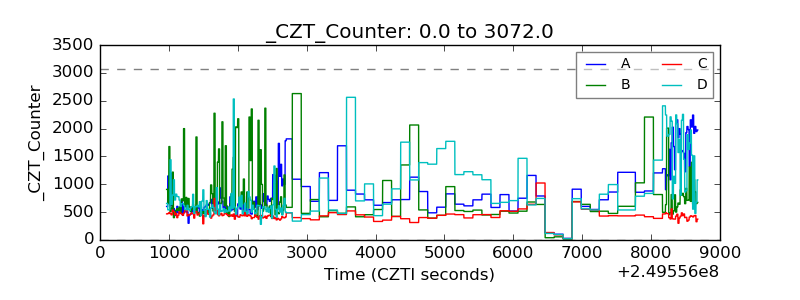 |
| +2.5 Volts monitor |  |
| +5 Volts monitor |  |
| _ROLL_ROT | 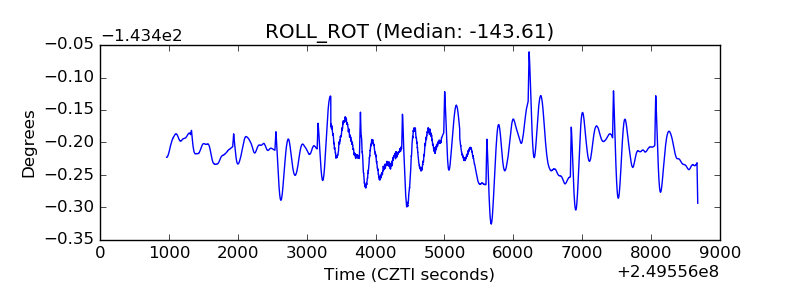 |
| _Roll_DEC | 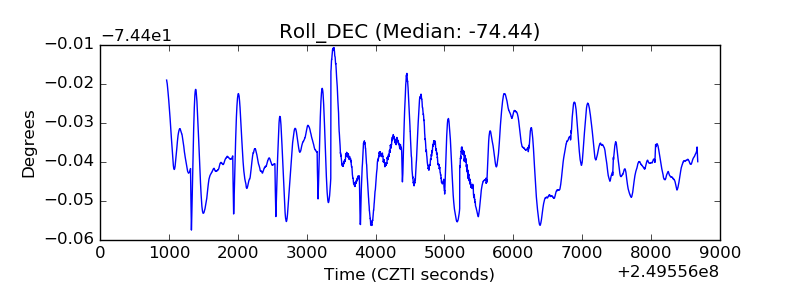 |
| _Roll_RA | 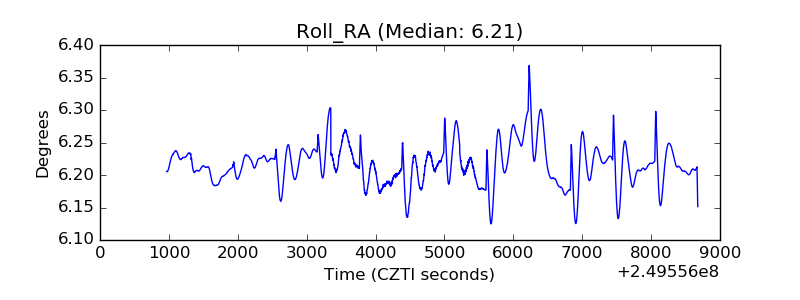 |
| Veto Counter | 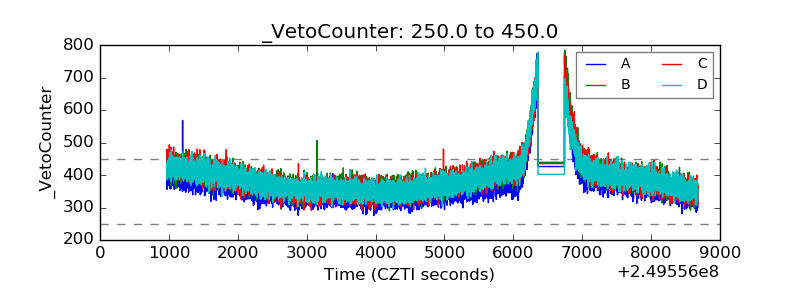 |