| Param | Original file | Final file |
|---|---|---|
| Filename | modeM0/AS1G08_006T01_9000001728_11728cztM0_level2.evt | modeM0/AS1G08_006T01_9000001728_11728cztM0_level2_quad_clean.evt |
| Size (bytes) | 331,024,320 | 43,951,680 |
| Size | 315.7 MB | 41.9 MB |
| Events in quadrant A | 3,190,546 | 279,681 |
| Events in quadrant B | 2,051,936 | 292,516 |
| Events in quadrant C | 1,026,706 | 302,445 |
| Events in quadrant D | 3,578,855 | 269,362 |
| Mode SS | |||
|---|---|---|---|
| Quadrant | BADHDUFLAG | Total packets | Discarded packets |
| A | 0 | 52 | 0 |
| B | 0 | 52 | 0 |
| C | 0 | 52 | 0 |
| D | 0 | 52 | 0 |
| Mode M0 | |||
|---|---|---|---|
| Quadrant | BADHDUFLAG | Total packets | Discarded packets |
| A | 0 | 11318 | 0 |
| B | 0 | 7850 | 0 |
| C | 0 | 5200 | 0 |
| D | 0 | 12442 | 0 |
| Quadrant | Total seconds | Saturated seconds | Saturation percentage |
|---|---|---|---|
| A | 2596 | 553 | 21.302003% |
| B | 2596 | 125 | 4.815100% |
| C | 2596 | 1 | 0.038521% |
| D | 2596 | 520 | 20.030817% |
Noise dominated data is calculated using 1-second bins in cleaned event files. If a bin has >2000 counts, and if more than 50% of those come from <1% of pixels, then it is considered to be noise-dominated and hence unusable.
| Quadrant | # 1 sec bins | Bins with >0 counts | Bins with >2000 counts | High rate bins dominated by noise | Noise dominated (total time) | Noise dominated (detector-on time) | Marked lightcurve |
|---|---|---|---|---|---|---|---|
| A | 2597 | 2597 | 391 | 391 | 15.06% | 15.06% |  |
| B | 2597 | 2597 | 89 | 89 | 3.43% | 3.43% | 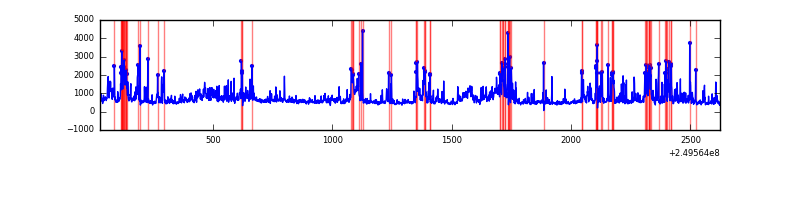 |
| C | 2597 | 2597 | 1 | 1 | 0.04% | 0.04% | 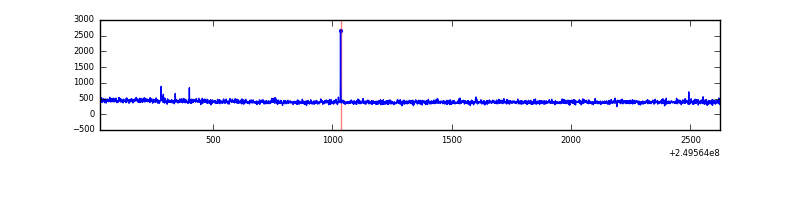 |
| D | 2597 | 2597 | 714 | 714 | 27.49% | 27.49% | 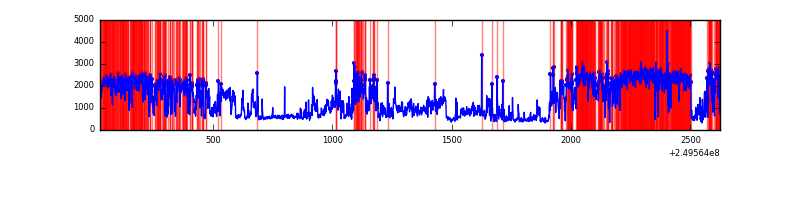 |
Top three noisy pixels from each quadrant. If the there are fewer than three noisy pixels in the level2.evt file, extra rows are filled as -1
| Pixel properties | Quadrant properties | ||||||
|---|---|---|---|---|---|---|---|
| Quadrant | DetID | PixID | Counts | Sigma | Mean | Median | Sigma |
| A | 8 | 15 | 1849654 | 32807.95 | 264 | 258 | 56.4 |
| A | 1 | 162 | 96189 | 1701.8 | 264 | 258 | 56.4 |
| A | 9 | 143 | 56788 | 1002.83 | 264 | 258 | 56.4 |
| B | 3 | 64 | 363168 | 6899.99 | 271 | 266 | 52.6 |
| B | 4 | 239 | 296653 | 5635.32 | 271 | 266 | 52.6 |
| B | 15 | 204 | 170864 | 3243.64 | 271 | 266 | 52.6 |
| C | 0 | 207 | 5033 | 77.25 | 261 | 262 | 61.8 |
| C | 8 | 222 | 2437 | 35.22 | 261 | 262 | 61.8 |
| C | 13 | 61 | 2073 | 29.32 | 261 | 262 | 61.8 |
| D | 1 | 52 | 2067285 | 33033.53 | 252 | 245 | 62.6 |
| D | 8 | 195 | 235055 | 3752.52 | 252 | 245 | 62.6 |
| D | 4 | 95 | 123049 | 1962.54 | 252 | 245 | 62.6 |
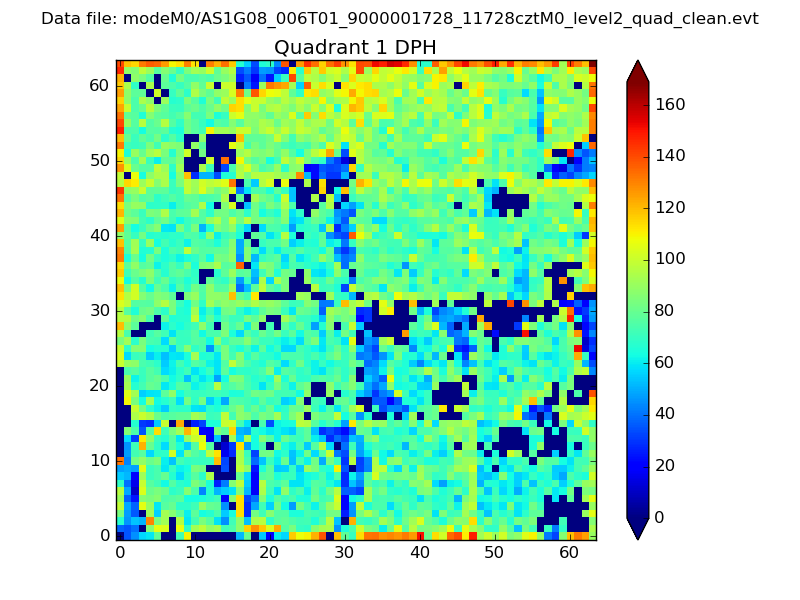
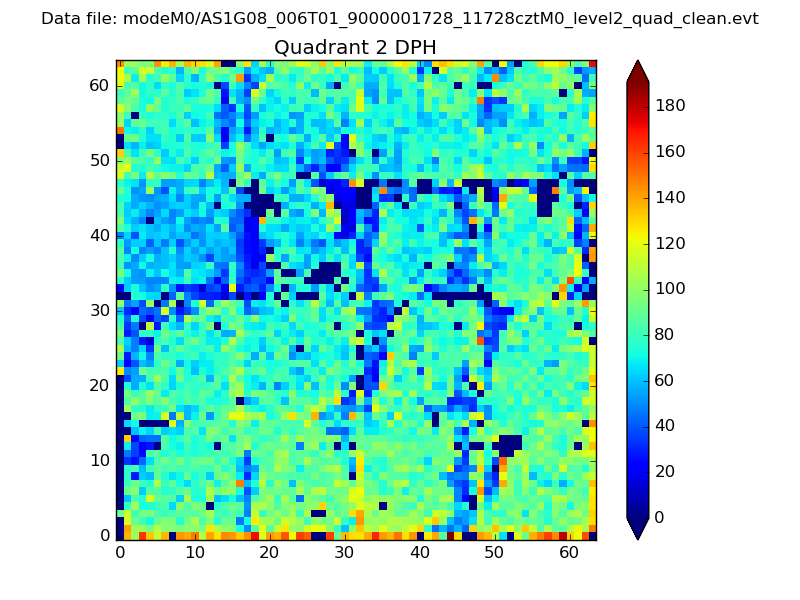
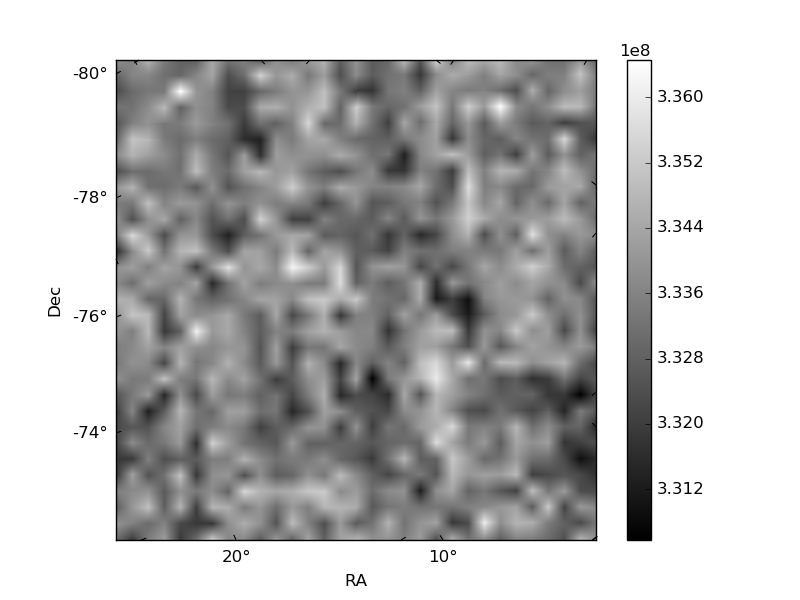
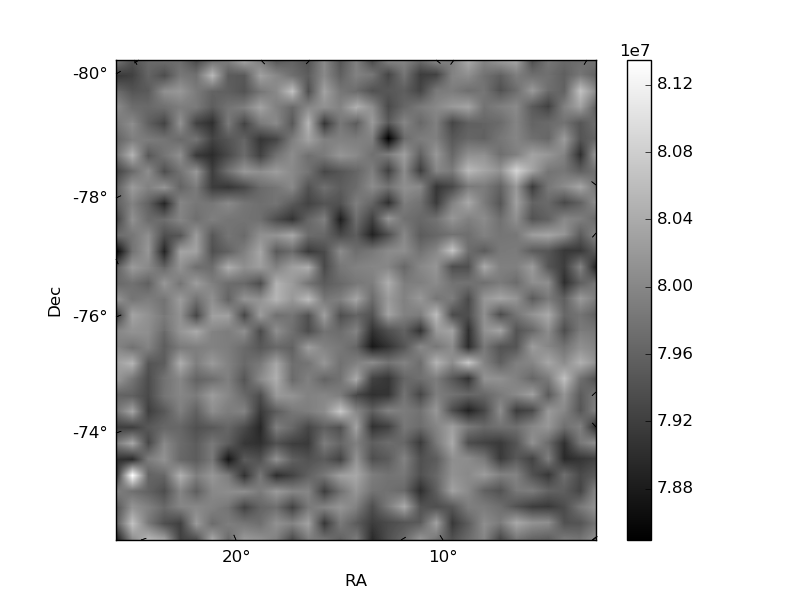
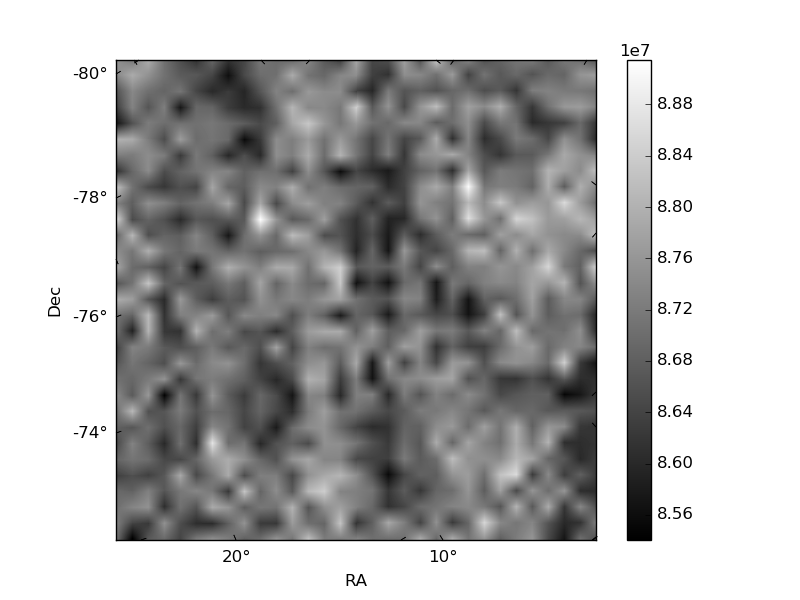
Histogram calculated using DETX and DETY for each event in the final _common_clean file
| Quadrant A | 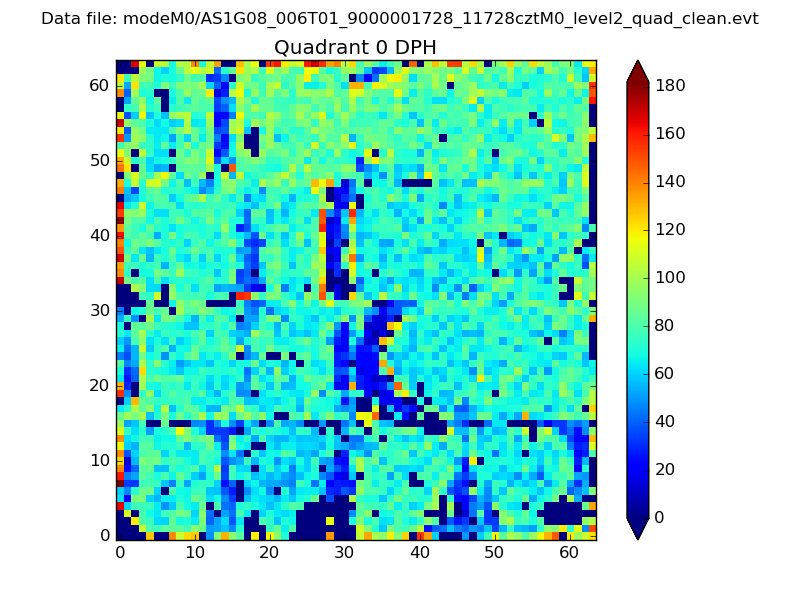 |
 |
Quadrant B |
|---|---|---|---|
| Quadrant D | 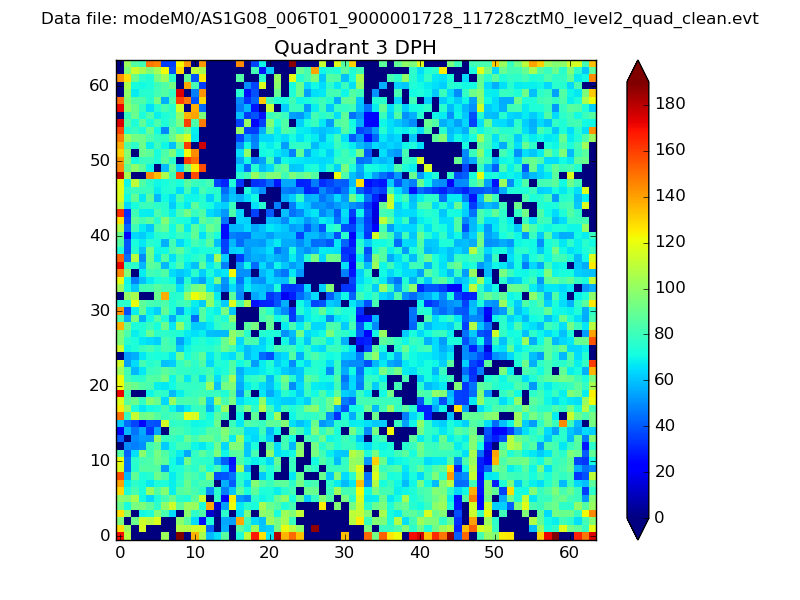 |
 |
Quadrant C |
| Plot type | Count rate plots | Images |
|---|---|---|
| Comparison with Poisson distribution Blue bars denote a histogram of data divided into 1 sec bins. Red curve is a Poisson curve with rate = median count rate of data. |
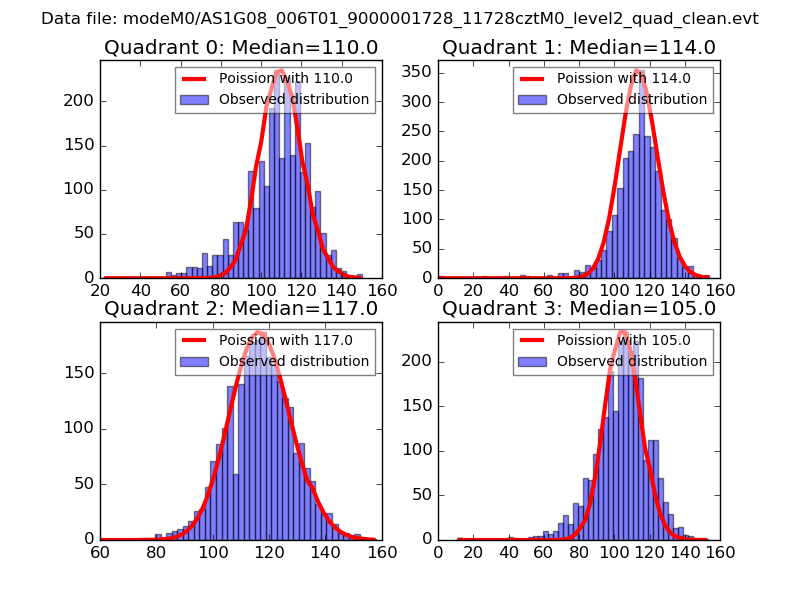 |
 |
| Quadrant-wise count rates Data is divided into 100 sec bins |
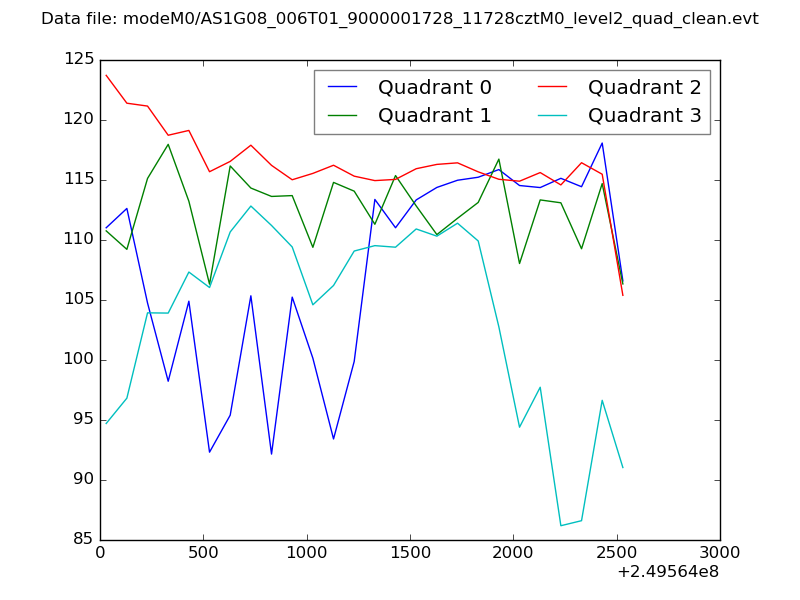 |
|
| Module-wise count rates for Quadrant A Data is divided into 100 sec bins |
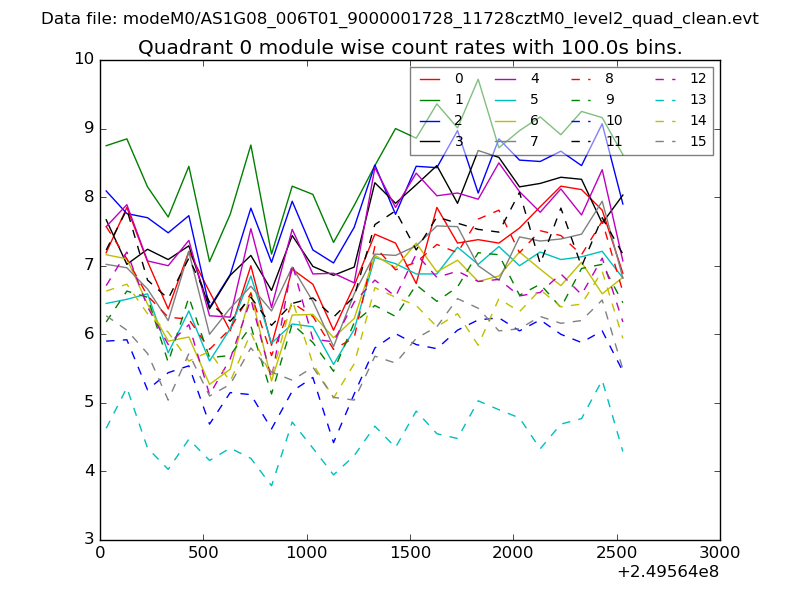 |
 |
| Module-wise count rates for Quadrant B Data is divided into 100 sec bins |
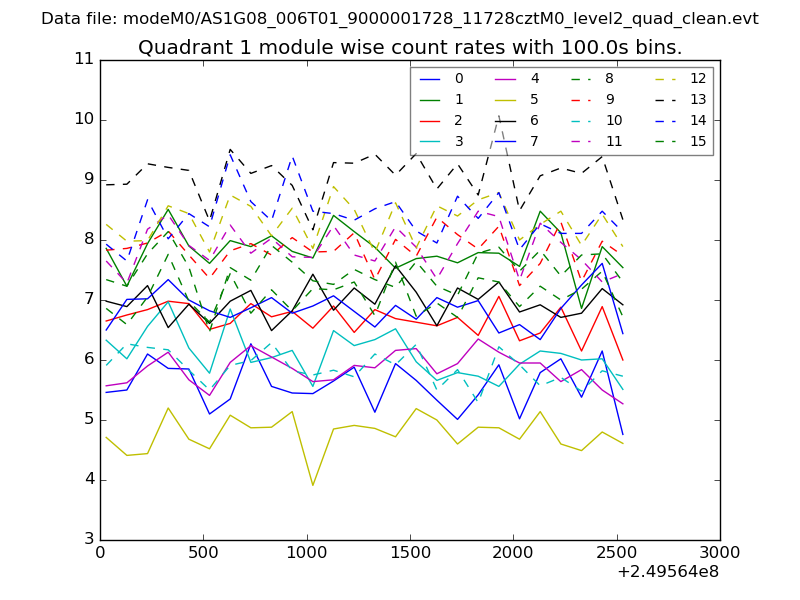 |
 |
| Module-wise count rates for Quadrant C Data is divided into 100 sec bins |
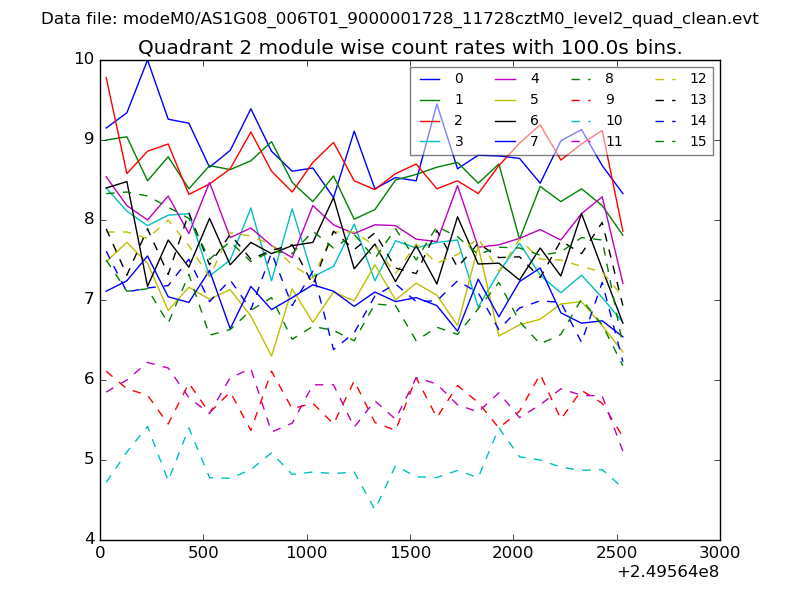 |
 |
| Module-wise count rates for Quadrant D Data is divided into 100 sec bins |
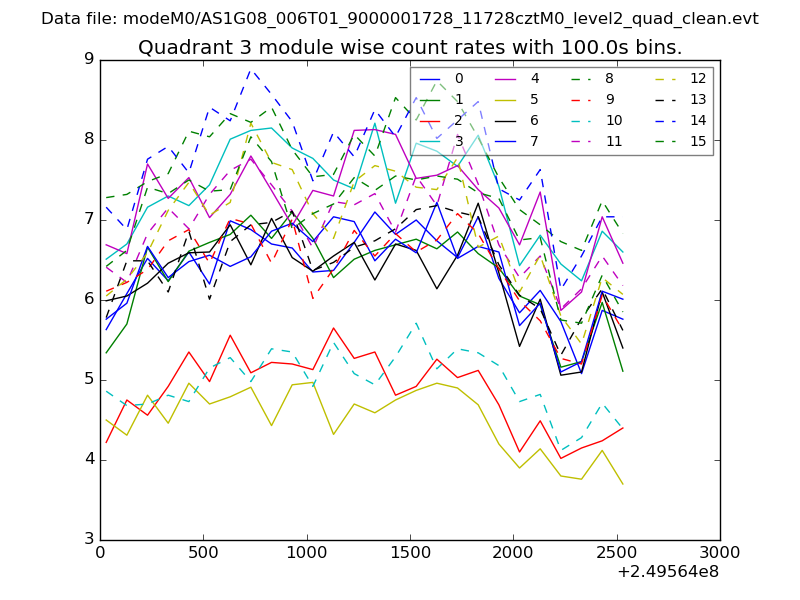 |
 |
| Parameter | Plot |
|---|---|
| CZT HV Monitor | 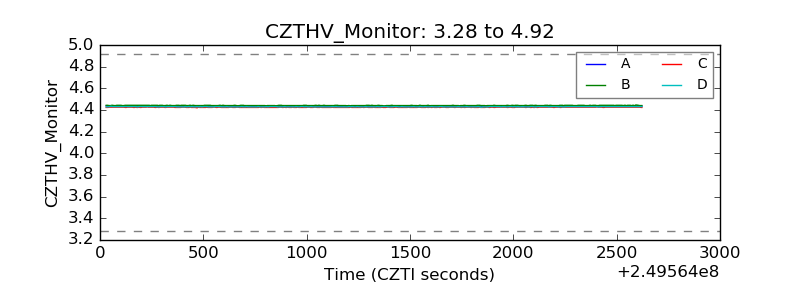 |
| D_VDD |  |
| Temperature 1 | 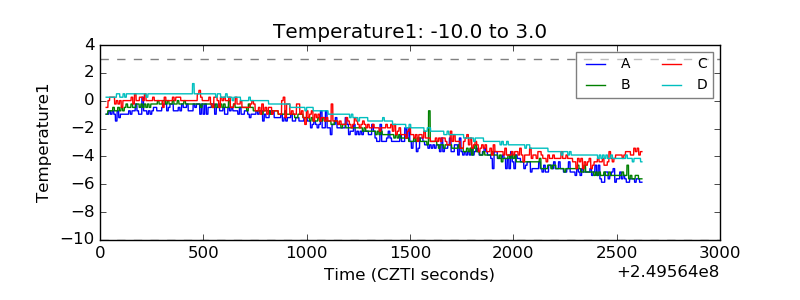 |
| Veto HV Monitor | 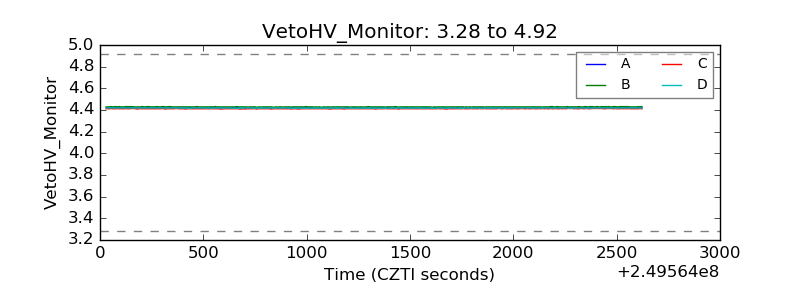 |
| Veto LLD | 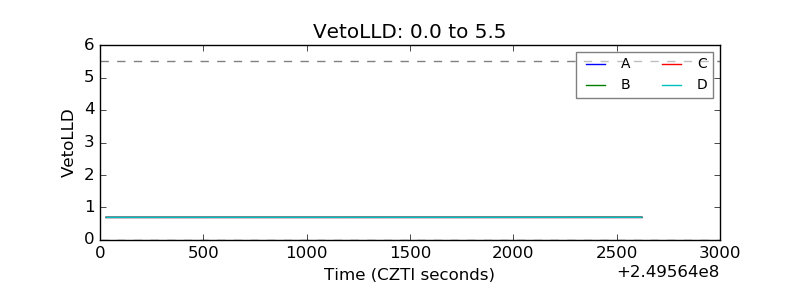 |
| Alpha Counter | 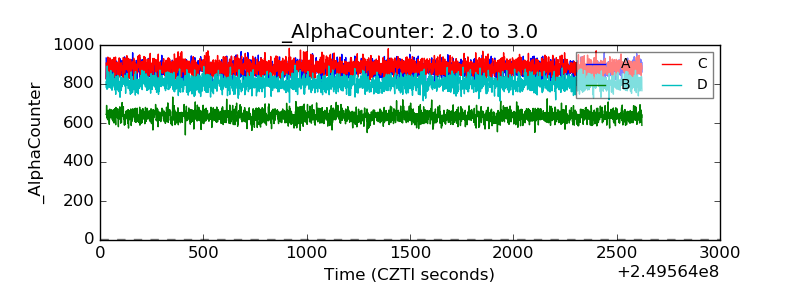 |
| _CPM_Rate | 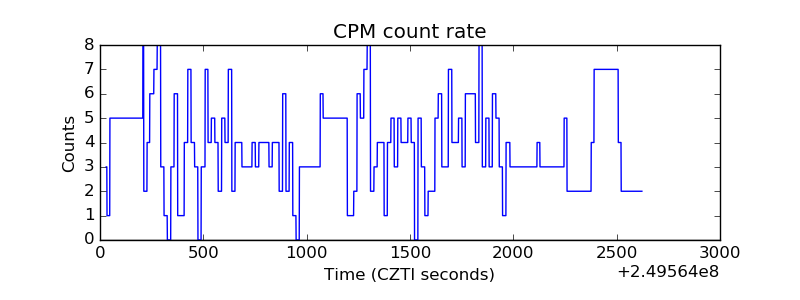 |
| CZT Counter | 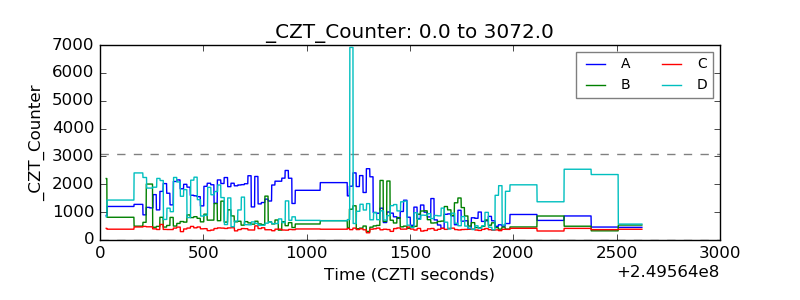 |
| +2.5 Volts monitor |  |
| +5 Volts monitor |  |
| _ROLL_ROT | 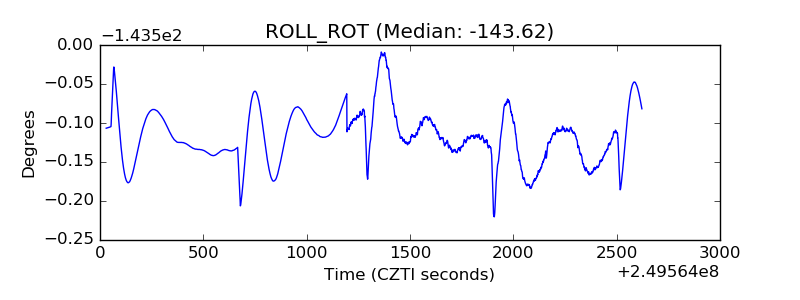 |
| _Roll_DEC | 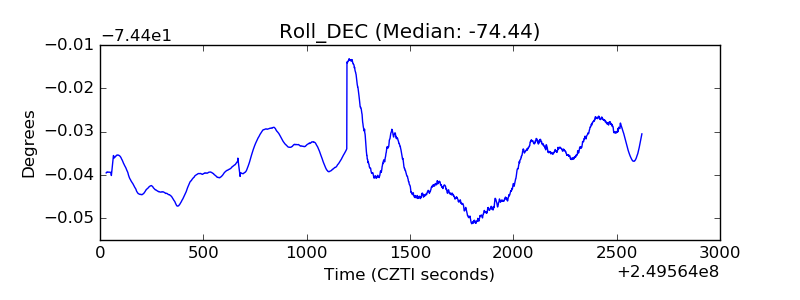 |
| _Roll_RA | 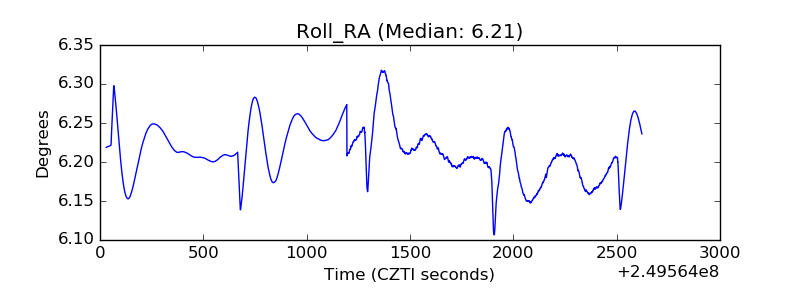 |
| Veto Counter | 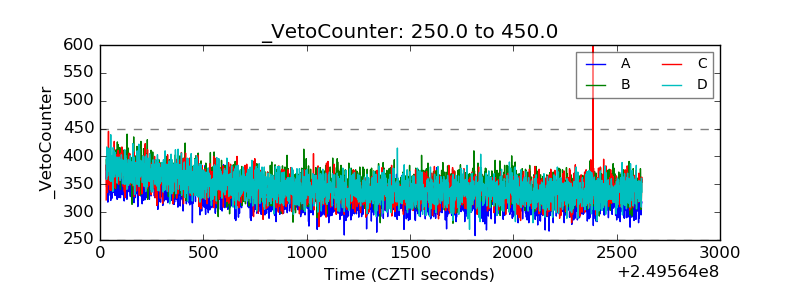 |