| Param | Original file | Final file |
|---|---|---|
| Filename | modeM0/AS1G08_006T02_9000001730cztM0_level2.fits | modeM0/AS1G08_006T02_9000001730cztM0_level2_quad_clean.evt |
| Size (bytes) | 191,796,480 | 240,451,200 |
| Size | 182.9 MB | 229.3 MB |
| Events in quadrant A | 1,138,664 | 1,518,554 |
| Events in quadrant B | 1,080,402 | 1,470,346 |
| Events in quadrant C | 1,150,128 | 1,484,323 |
| Events in quadrant D | 974,044 | 1,344,645 |
| Mode M0 | |||
|---|---|---|---|
| Quadrant | BADHDUFLAG | Total packets | Discarded packets |
| A | 0 | 59008 | 0 |
| B | 0 | 57095 | 0 |
| C | 0 | 43595 | 0 |
| D | 0 | 55322 | 0 |
| Mode M9 | |||
|---|---|---|---|
| Quadrant | BADHDUFLAG | Total packets | Discarded packets |
| A | 0 | 11 | 0 |
| B | 0 | 11 | 0 |
| C | 0 | 11 | 0 |
| D | 0 | 11 | 0 |
| Mode SS | |||
|---|---|---|---|
| Quadrant | BADHDUFLAG | Total packets | Discarded packets |
| A | 0 | 432 | 0 |
| B | 0 | 432 | 0 |
| C | 0 | 432 | 0 |
| D | 0 | 432 | 0 |
| Quadrant | Total seconds | Saturated seconds | Saturation percentage |
|---|---|---|---|
| A | 21265 | 920 | 4.326358% |
| B | 21265 | 1511 | 7.105573% |
| C | 21265 | 203 | 0.954620% |
| D | 21265 | 776 | 3.649189% |
Noise dominated data is calculated using 1-second bins in cleaned event files. If a bin has >2000 counts, and if more than 50% of those come from <1% of pixels, then it is considered to be noise-dominated and hence unusable.
| Quadrant | # 1 sec bins | Bins with >0 counts | Bins with >2000 counts | High rate bins dominated by noise | Noise dominated (total time) | Noise dominated (detector-on time) | Marked lightcurve |
|---|---|---|---|---|---|---|---|
| A | 22425 | 21265 | 0 | 0 | 0.00% | 0.00% | 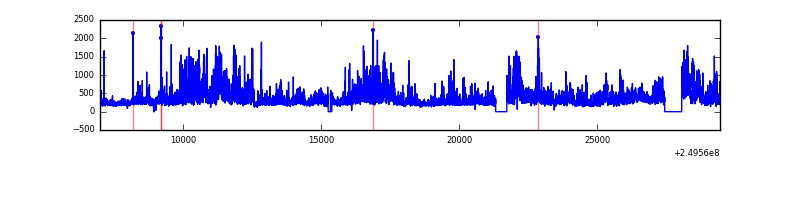 |
| B | 22425 | 21264 | 0 | 0 | 0.00% | 0.00% | 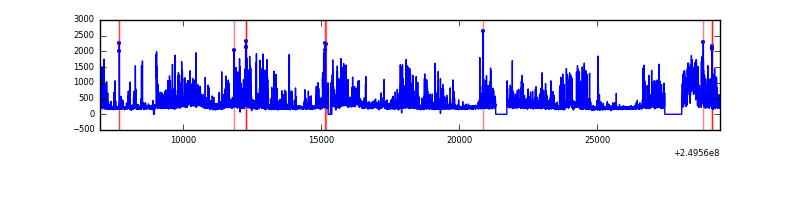 |
| C | 22425 | 21265 | 0 | 0 | 0.00% | 0.00% | 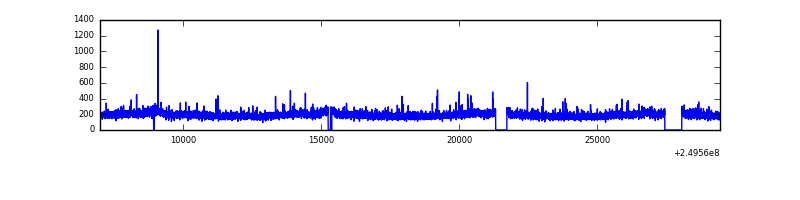 |
| D | 22425 | 21247 | 0 | 0 | 0.00% | 0.00% | 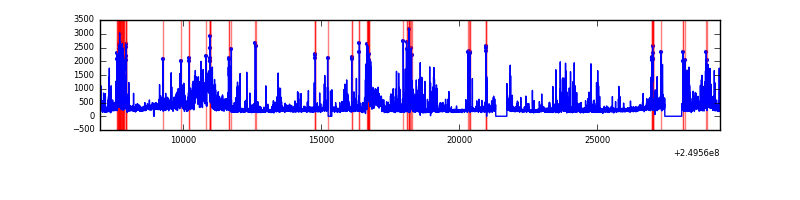 |
Top three noisy pixels from each quadrant. If the there are fewer than three noisy pixels in the level2.evt file, extra rows are filled as -1
| Pixel properties | Quadrant properties | ||||||
|---|---|---|---|---|---|---|---|
| Quadrant | DetID | PixID | Counts | Sigma | Mean | Median | Sigma |
| A | 14 | 188 | 1142 | 11.3 | 296 | 277 | 76.5 |
| A | 0 | 29 | 1125 | 11.08 | 296 | 277 | 76.5 |
| A | 14 | 204 | 1004 | 9.5 | 296 | 277 | 76.5 |
| B | 2 | 9 | 921 | 11.13 | 286 | 273 | 58.2 |
| B | 14 | 254 | 779 | 8.69 | 286 | 273 | 58.2 |
| B | 3 | 17 | 741 | 8.04 | 286 | 273 | 58.2 |
| C | 12 | 241 | 816 | 6.66 | 303 | 281 | 80.3 |
| C | 4 | 254 | 806 | 6.54 | 303 | 281 | 80.3 |
| C | 9 | 188 | 758 | 5.94 | 303 | 281 | 80.3 |
| D | 3 | 14 | 765 | 6.66 | 278 | 252 | 77.0 |
| D | 6 | 83 | 702 | 5.84 | 278 | 252 | 77.0 |
| D | 15 | 46 | 688 | 5.66 | 278 | 252 | 77.0 |
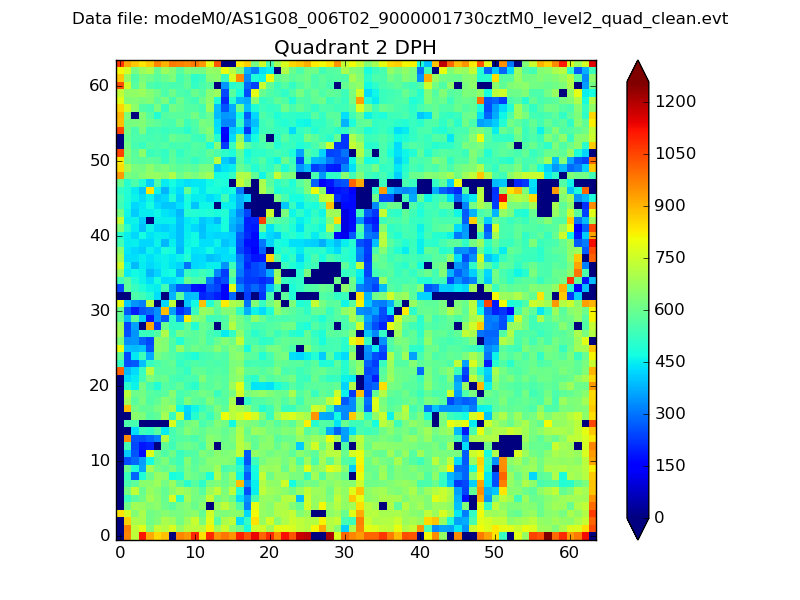
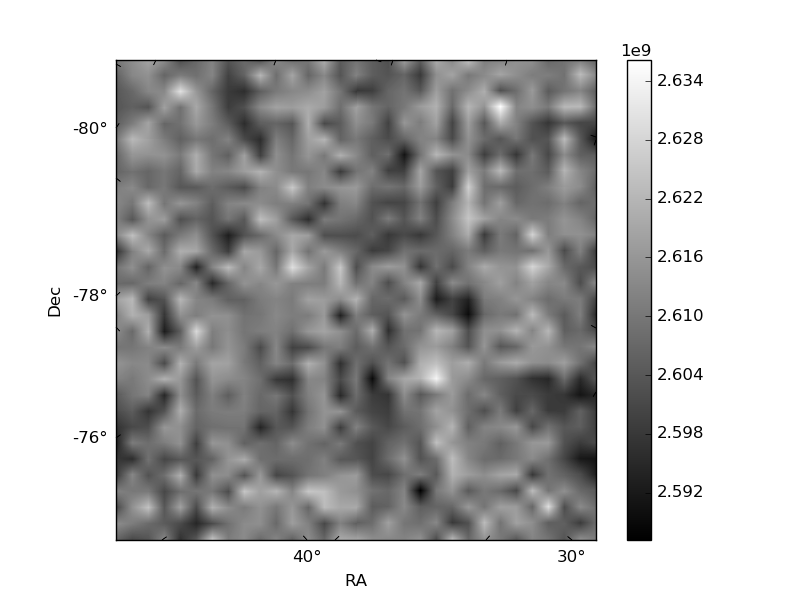
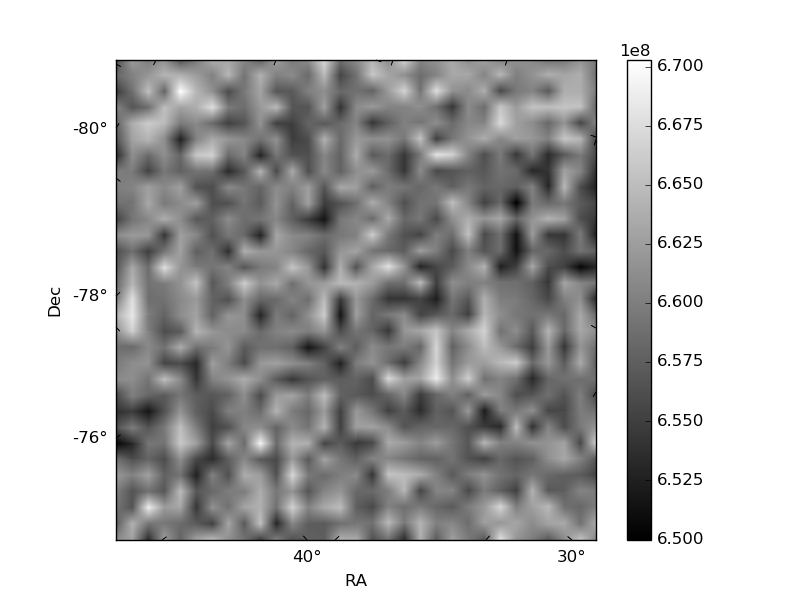
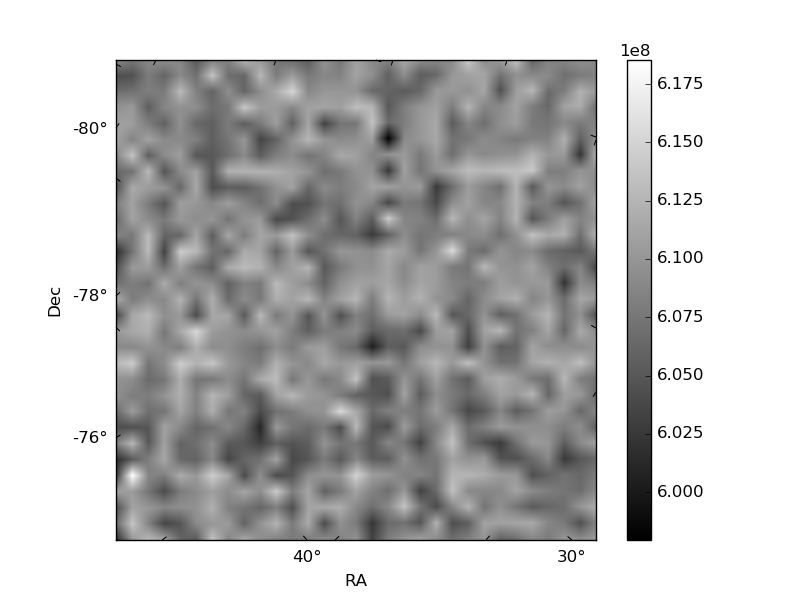
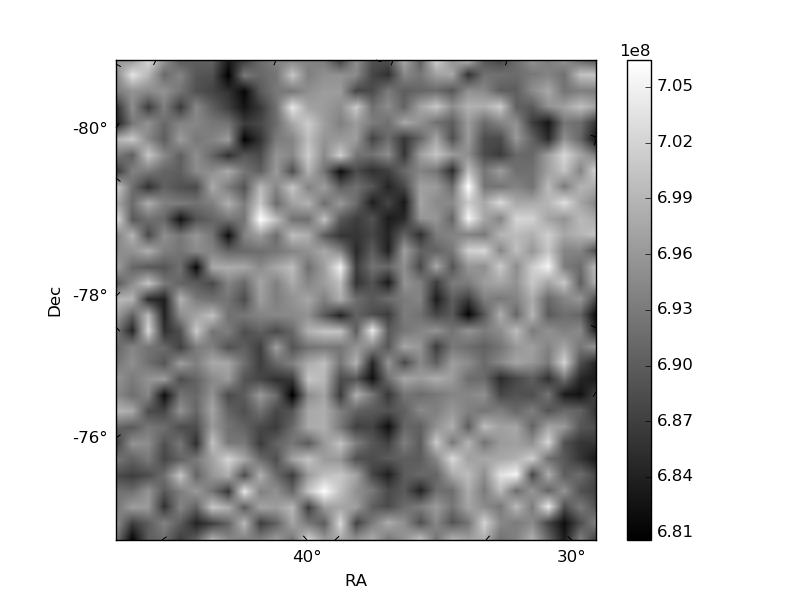
Histogram calculated using DETX and DETY for each event in the final _common_clean file
| Quadrant A | 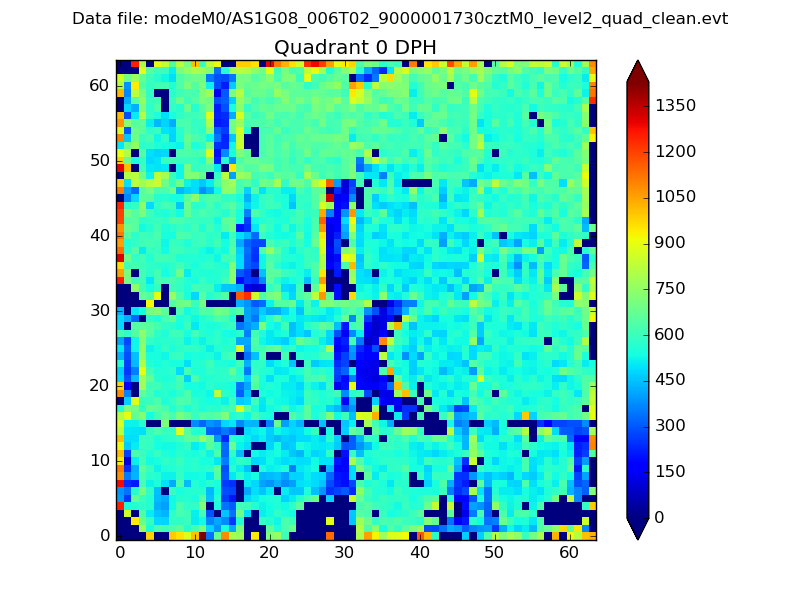 |
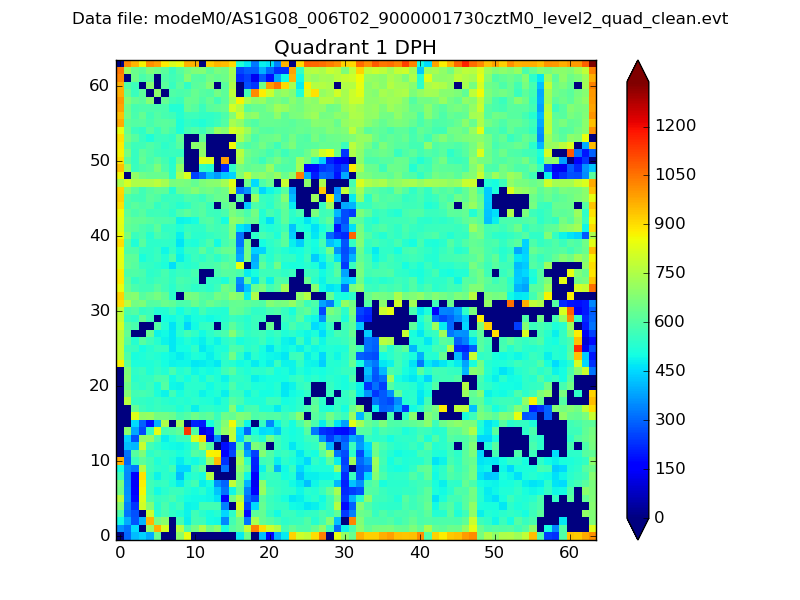 |
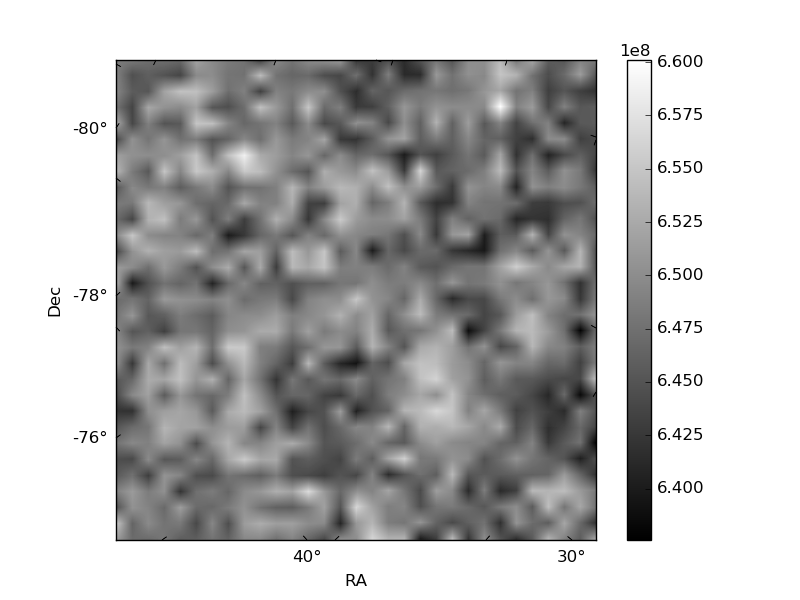
Quadrant B |
|---|---|---|---|
| Quadrant D | 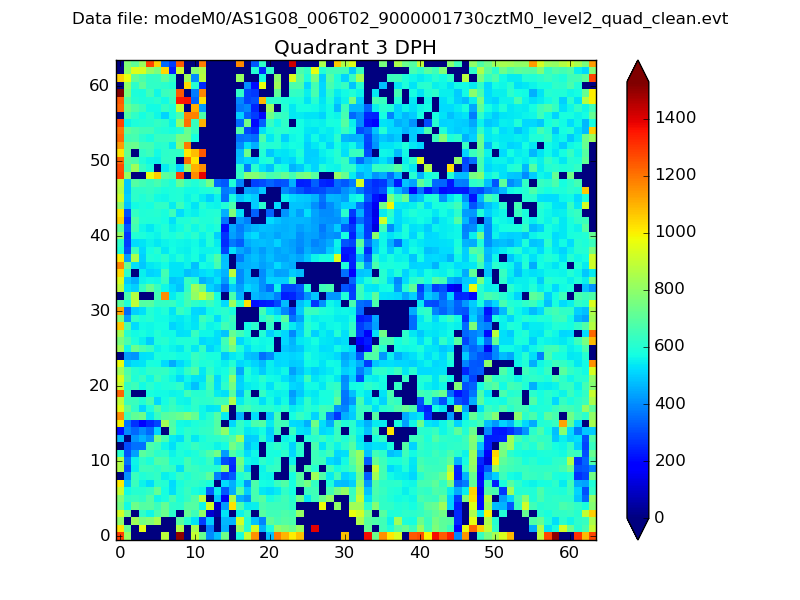 |
 |
Quadrant C |
| Plot type | Count rate plots | Images |
|---|---|---|
| Comparison with Poisson distribution Blue bars denote a histogram of data divided into 1 sec bins. Red curve is a Poisson curve with rate = median count rate of data. |
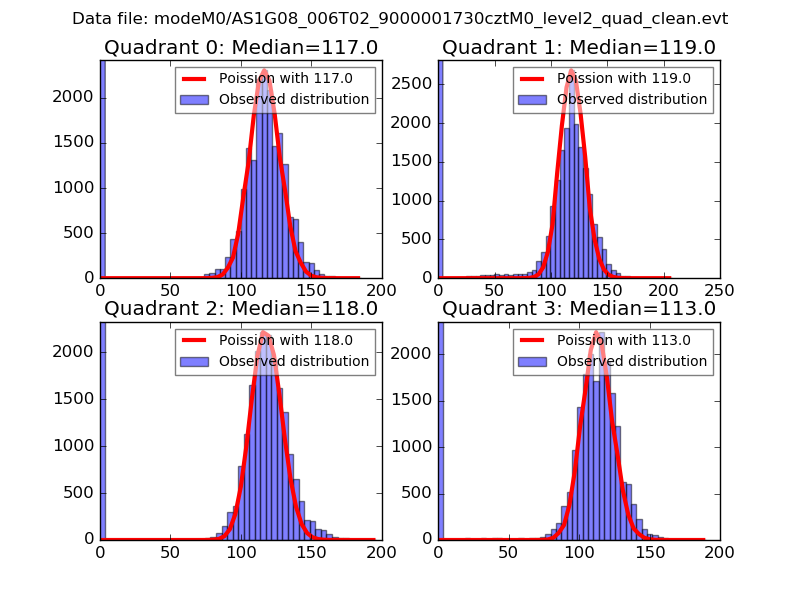 |
 |
| Quadrant-wise count rates Data is divided into 100 sec bins |
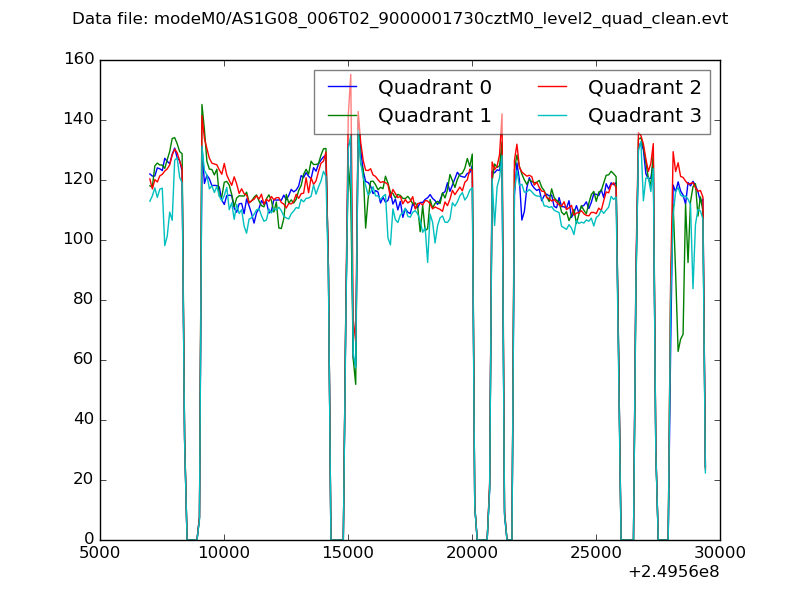 |
|
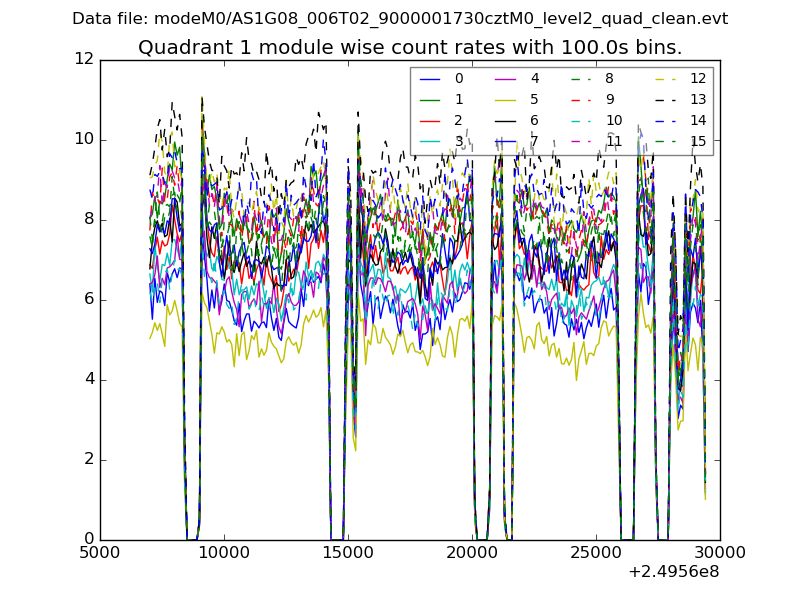
| Module-wise count rates for Quadrant A Data is divided into 100 sec bins |
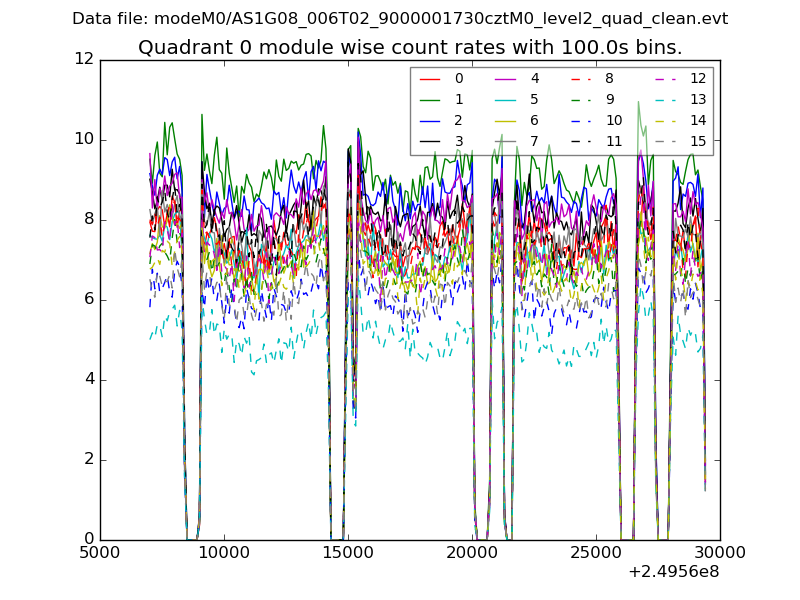 |
 |
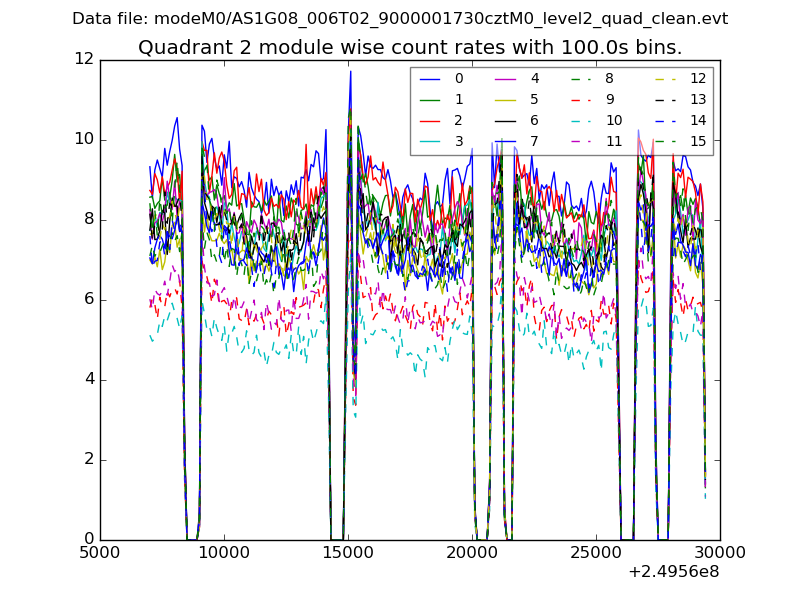
| Module-wise count rates for Quadrant B Data is divided into 100 sec bins |
 |
 |
| Module-wise count rates for Quadrant C Data is divided into 100 sec bins |
 |
 |
| Module-wise count rates for Quadrant D Data is divided into 100 sec bins |
 |
 |
| Parameter | Plot |
|---|---|
| CZT HV Monitor | 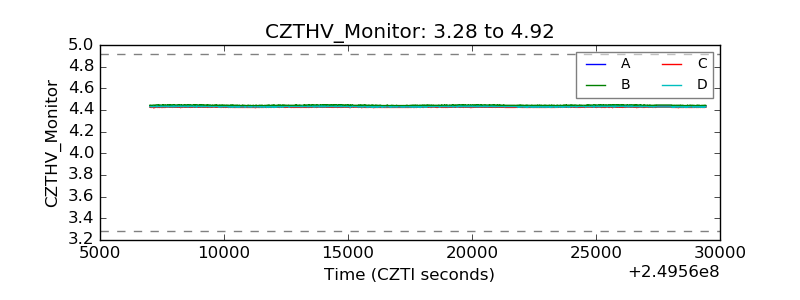 |
| D_VDD | 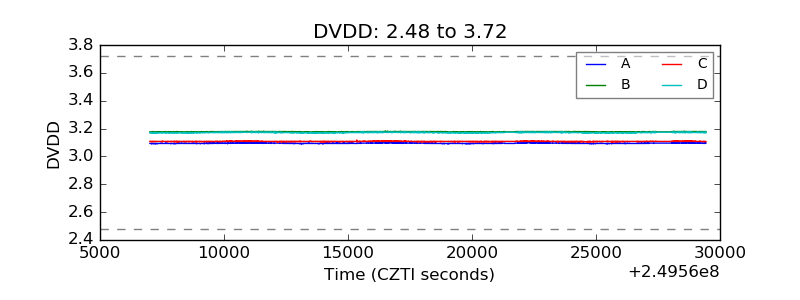 |
| Temperature 1 | 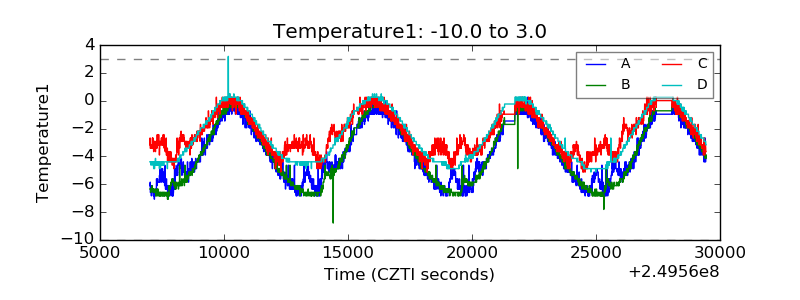 |
| Veto HV Monitor | 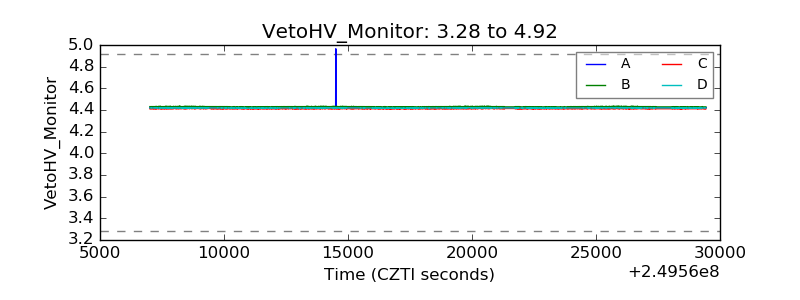 |
| Veto LLD | 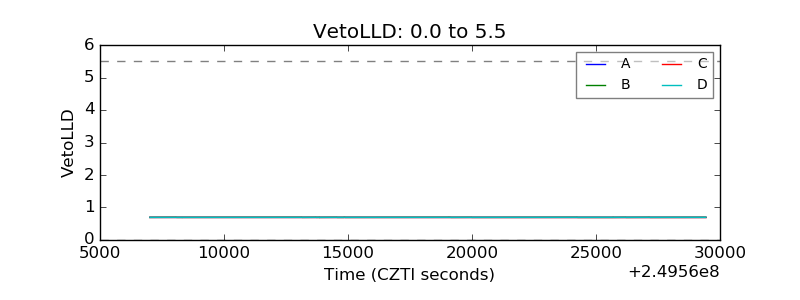 |
| Alpha Counter | 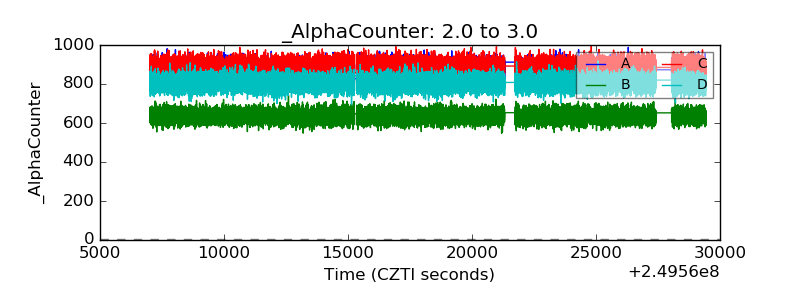 |
| _CPM_Rate | 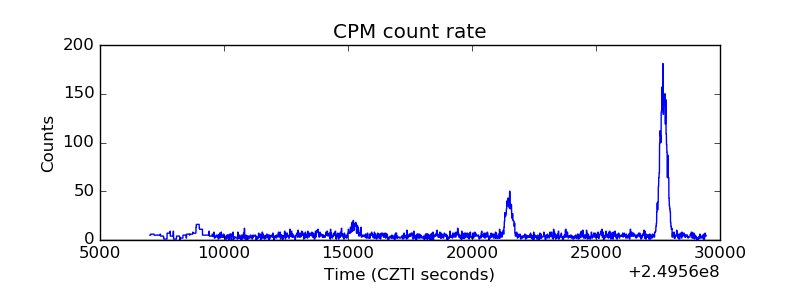 |
| CZT Counter | 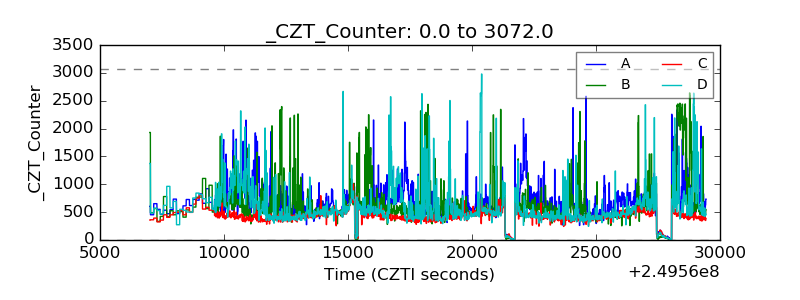 |
| +2.5 Volts monitor | 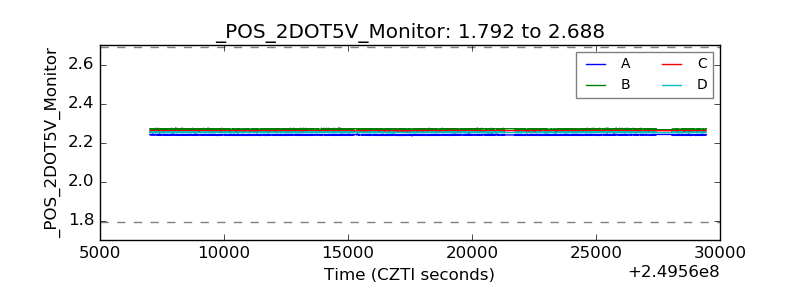 |
| +5 Volts monitor | 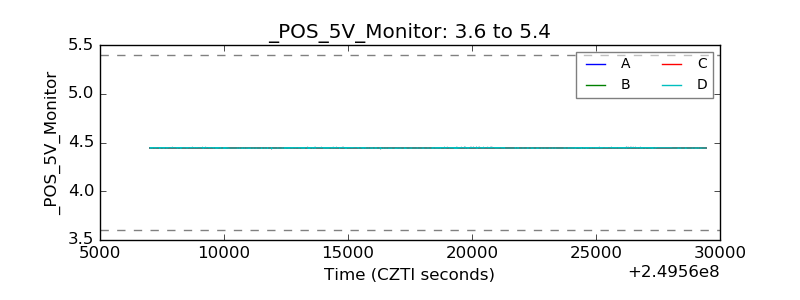 |
| _ROLL_ROT | 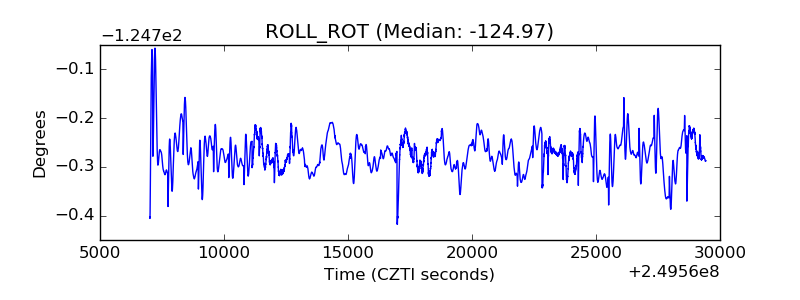 |
| _Roll_DEC | 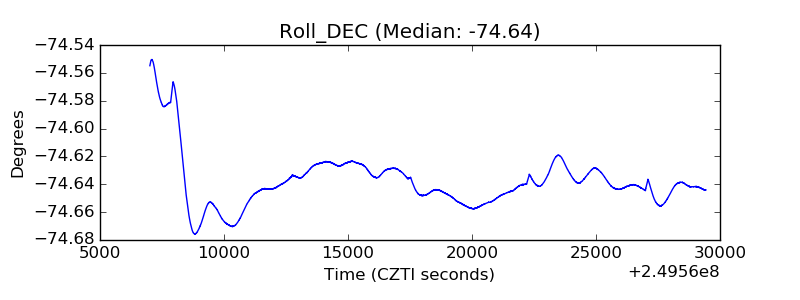 |
| _Roll_RA | 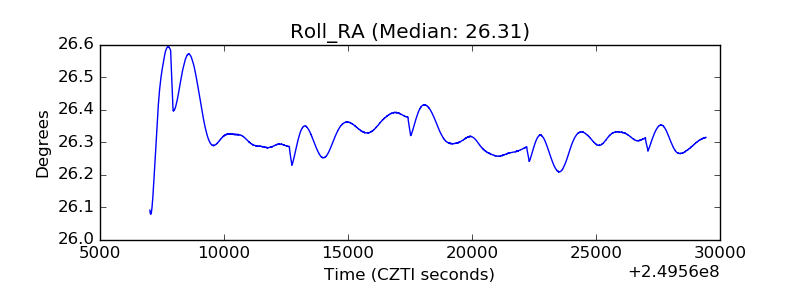 |
| Veto Counter | 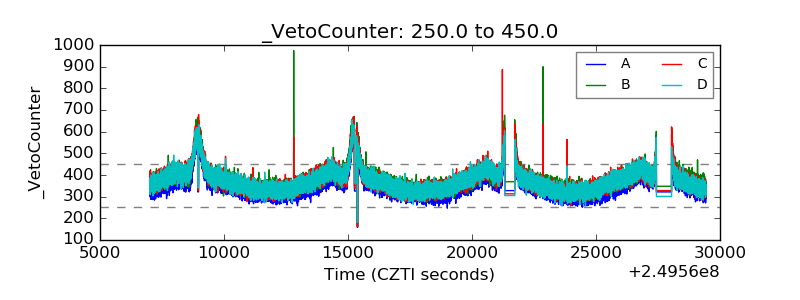 |