| Param | Original file | Final file |
|---|---|---|
| Filename | modeM0/AS1G08_006T02_9000001730_11728cztM0_level2.evt | modeM0/AS1G08_006T02_9000001730_11728cztM0_level2_quad_clean.evt |
| Size (bytes) | 351,322,560 | 60,203,520 |
| Size | 335.0 MB | 57.4 MB |
| Events in quadrant A | 2,837,983 | 386,190 |
| Events in quadrant B | 2,549,607 | 397,642 |
| Events in quadrant C | 1,878,914 | 397,855 |
| Events in quadrant D | 3,110,897 | 369,098 |
| Mode M0 | |||
|---|---|---|---|
| Quadrant | BADHDUFLAG | Total packets | Discarded packets |
| A | 0 | 11044 | 2 |
| B | 0 | 10190 | 1 |
| C | 0 | 8157 | 1 |
| D | 0 | 11848 | 1 |
| Mode SS | |||
|---|---|---|---|
| Quadrant | BADHDUFLAG | Total packets | Discarded packets |
| A | 0 | 76 | 0 |
| B | 0 | 76 | 0 |
| C | 0 | 76 | 0 |
| D | 0 | 76 | 0 |
| Quadrant | Total seconds | Saturated seconds | Saturation percentage |
|---|---|---|---|
| A | 3855 | 331 | 8.586252% |
| B | 3855 | 312 | 8.093385% |
| C | 3855 | 96 | 2.490272% |
| D | 3855 | 250 | 6.485084% |
Noise dominated data is calculated using 1-second bins in cleaned event files. If a bin has >2000 counts, and if more than 50% of those come from <1% of pixels, then it is considered to be noise-dominated and hence unusable.
| Quadrant | # 1 sec bins | Bins with >0 counts | Bins with >2000 counts | High rate bins dominated by noise | Noise dominated (total time) | Noise dominated (detector-on time) | Marked lightcurve |
|---|---|---|---|---|---|---|---|
| A | 3886 | 3857 | 54 | 54 | 1.39% | 1.40% | 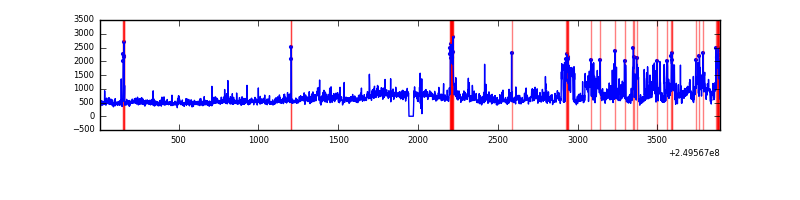 |
| B | 3886 | 3857 | 50 | 50 | 1.29% | 1.30% | 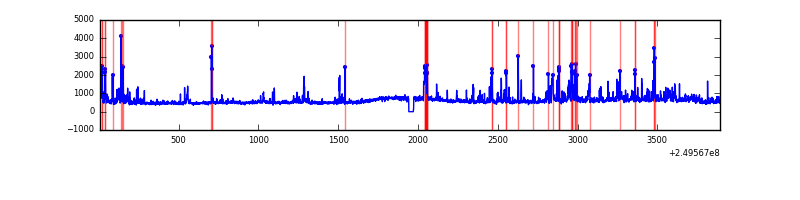 |
| C | 3886 | 3857 | 0 | 0 | 0.00% | 0.00% | 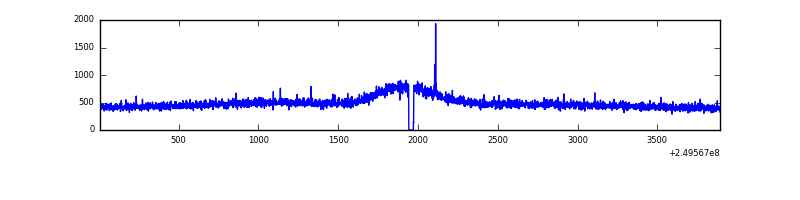 |
| D | 3886 | 3857 | 113 | 113 | 2.91% | 2.93% | 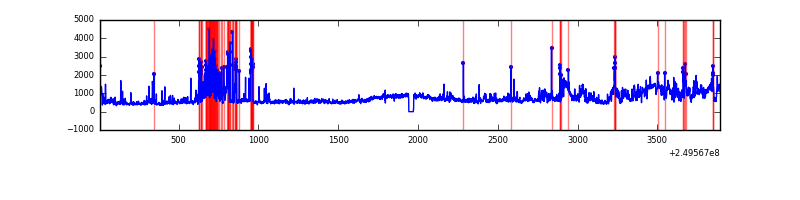 |
Top three noisy pixels from each quadrant. If the there are fewer than three noisy pixels in the level2.evt file, extra rows are filled as -1
| Pixel properties | Quadrant properties | ||||||
|---|---|---|---|---|---|---|---|
| Quadrant | DetID | PixID | Counts | Sigma | Mean | Median | Sigma |
| A | 8 | 15 | 719653 | 7286.48 | 479 | 466 | 98.7 |
| A | 1 | 162 | 82720 | 833.36 | 479 | 466 | 98.7 |
| A | 9 | 143 | 49995 | 501.81 | 479 | 466 | 98.7 |
| B | 3 | 64 | 230661 | 2450.05 | 480 | 466 | 94.0 |
| B | 4 | 239 | 187586 | 1991.59 | 480 | 466 | 94.0 |
| B | 15 | 204 | 125941 | 1335.48 | 480 | 466 | 94.0 |
| C | 8 | 222 | 4741 | 38.05 | 479 | 480 | 112.0 |
| C | 14 | 234 | 3858 | 30.16 | 479 | 480 | 112.0 |
| C | 13 | 61 | 3649 | 28.3 | 479 | 480 | 112.0 |
| D | 10 | 157 | 559020 | 4887.64 | 470 | 455 | 114.3 |
| D | 1 | 52 | 350497 | 3062.99 | 470 | 455 | 114.3 |
| D | 8 | 195 | 227979 | 1990.91 | 470 | 455 | 114.3 |
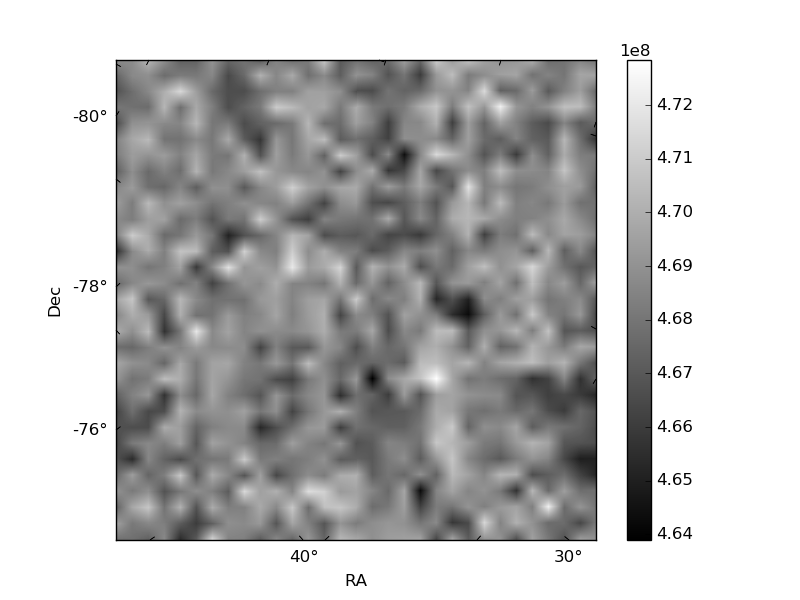
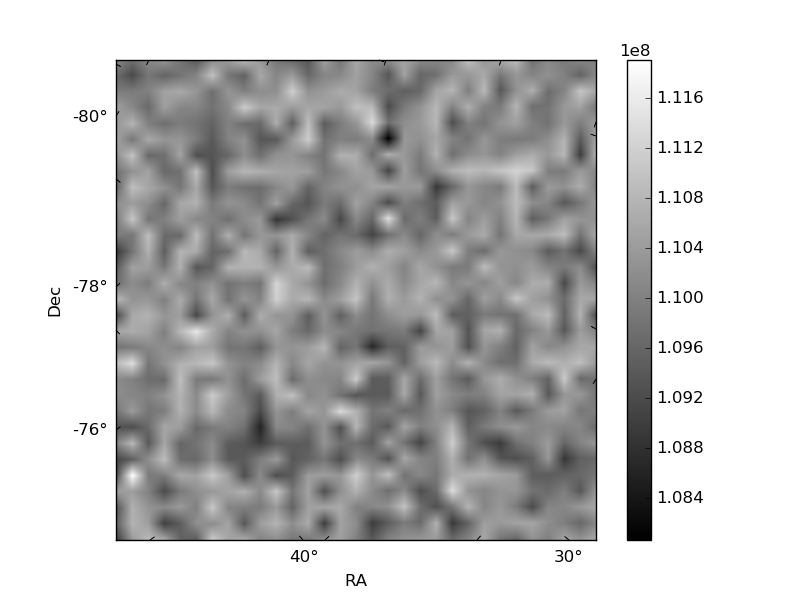
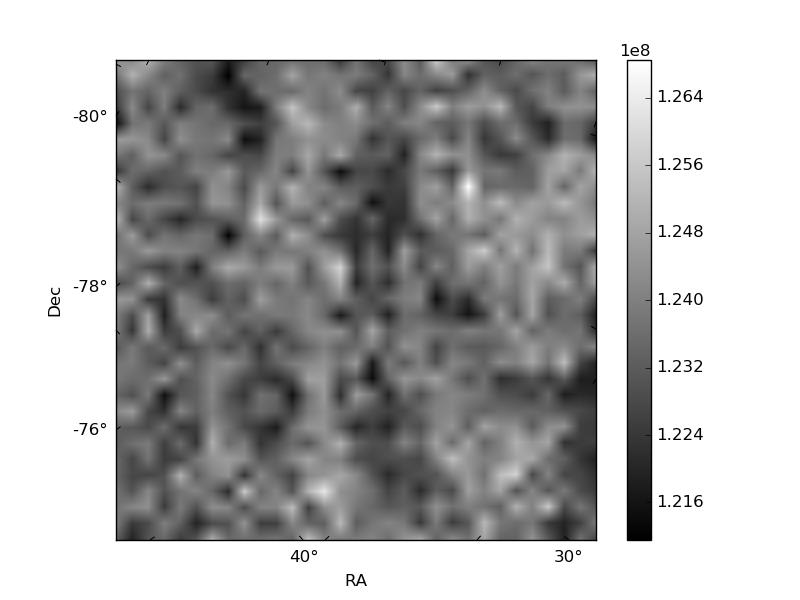
Histogram calculated using DETX and DETY for each event in the final _common_clean file
| Quadrant A | 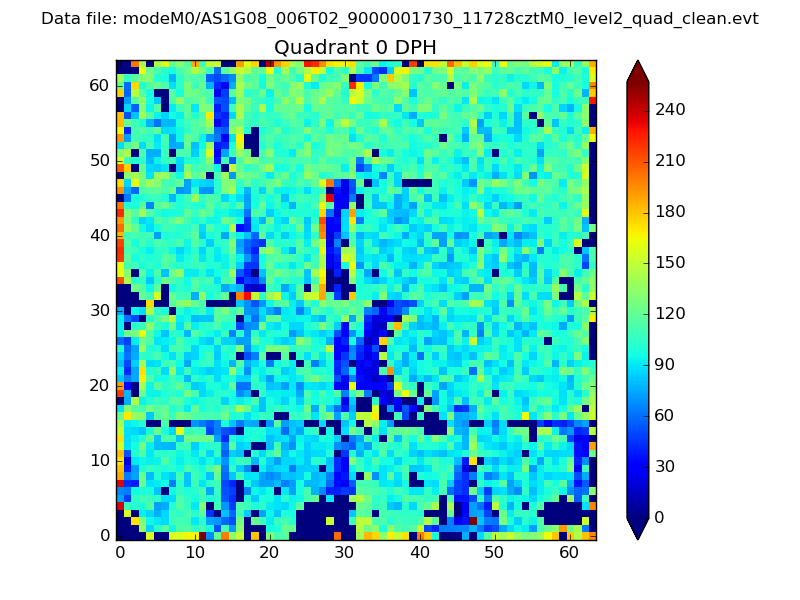 |
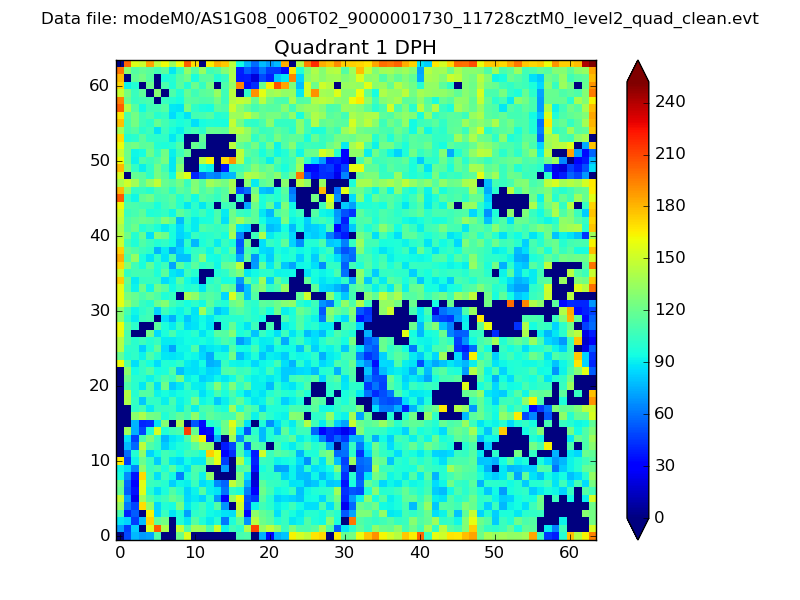 |
Quadrant B |
|---|---|---|---|
| Quadrant D | 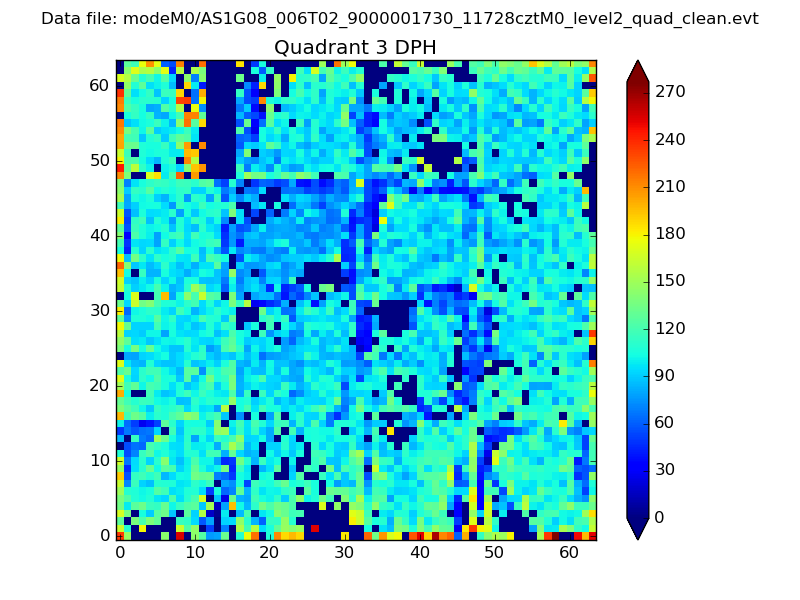 |
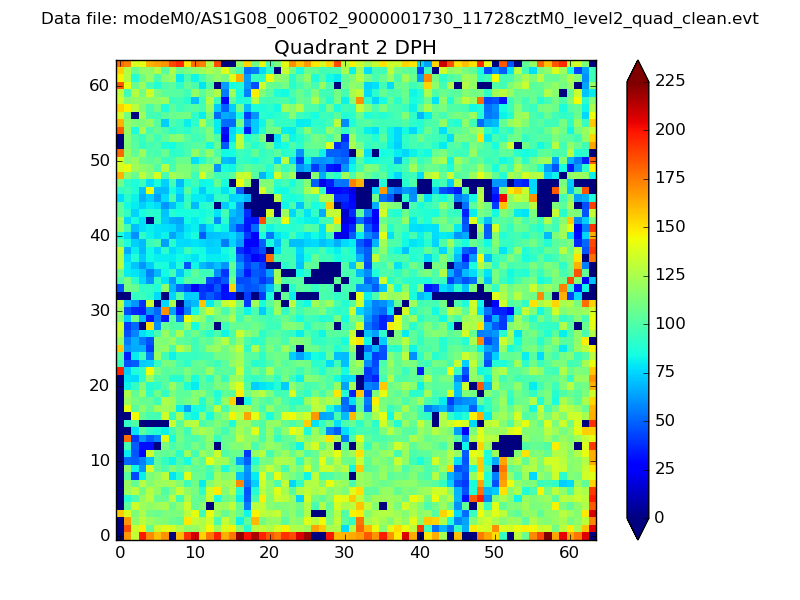 |
Quadrant C |
| Plot type | Count rate plots | Images |
|---|---|---|
| Comparison with Poisson distribution Blue bars denote a histogram of data divided into 1 sec bins. Red curve is a Poisson curve with rate = median count rate of data. |
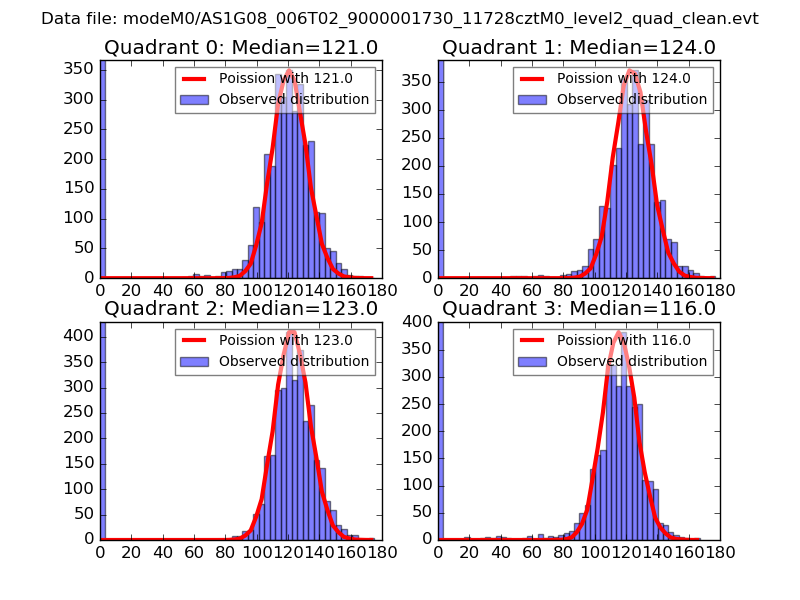 |
 |
| Quadrant-wise count rates Data is divided into 100 sec bins |
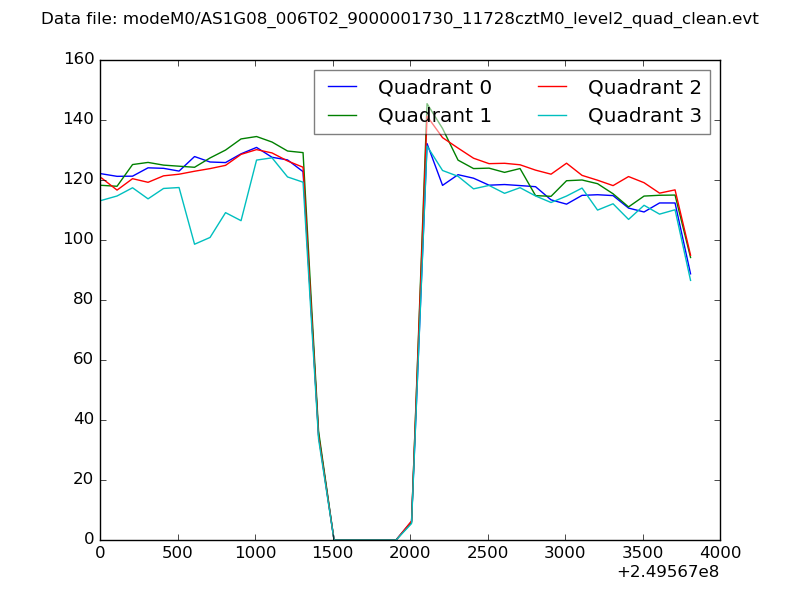 |
|
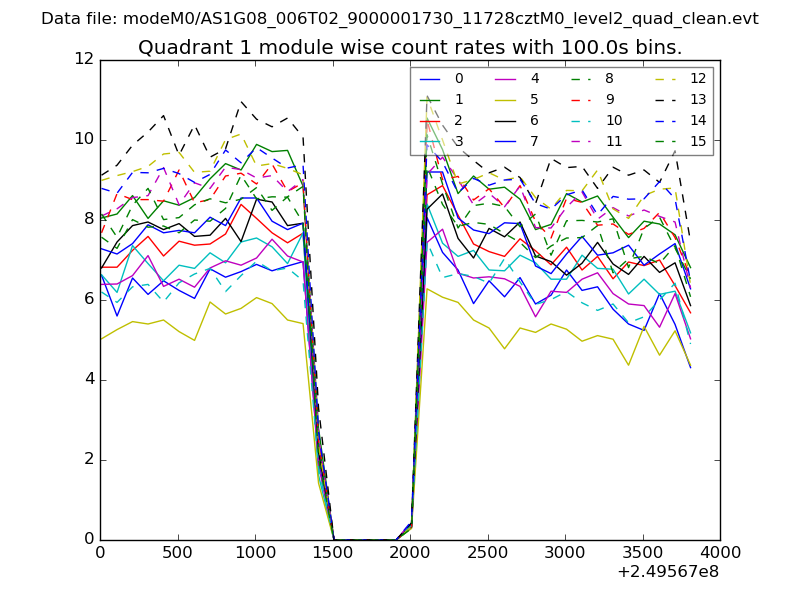
| Module-wise count rates for Quadrant A Data is divided into 100 sec bins |
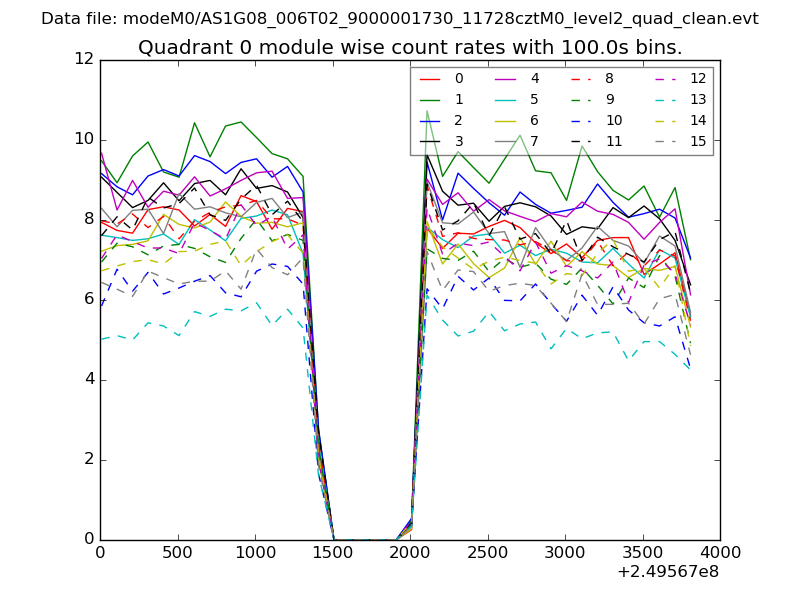 |
 |
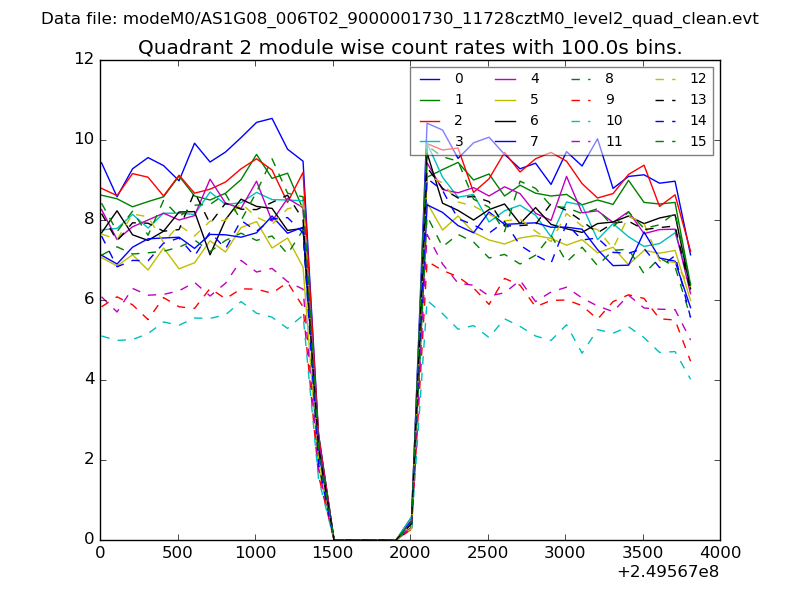
| Module-wise count rates for Quadrant B Data is divided into 100 sec bins |
 |
 |
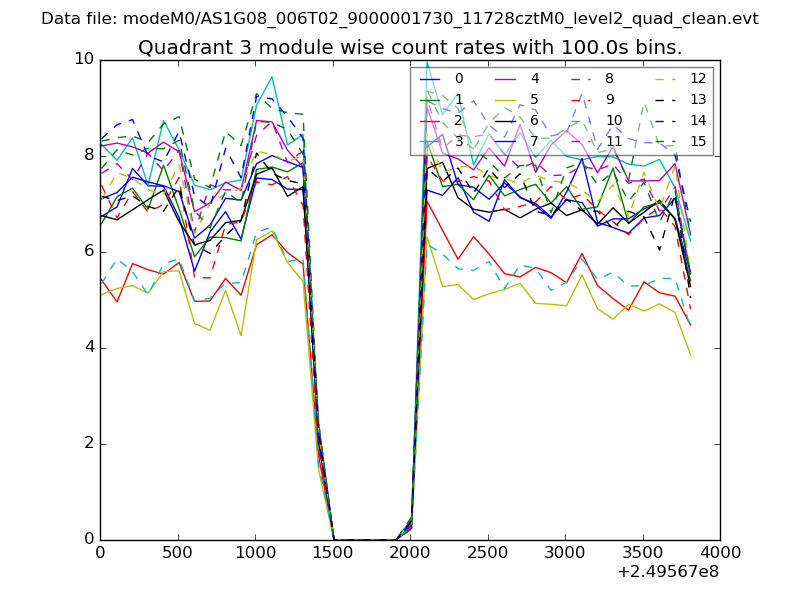
| Module-wise count rates for Quadrant C Data is divided into 100 sec bins |
 |
 |
| Module-wise count rates for Quadrant D Data is divided into 100 sec bins |
 |
 |
| Parameter | Plot |
|---|---|
| CZT HV Monitor | 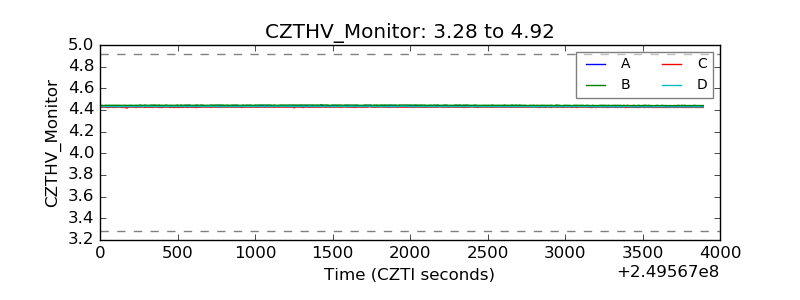 |
| D_VDD | 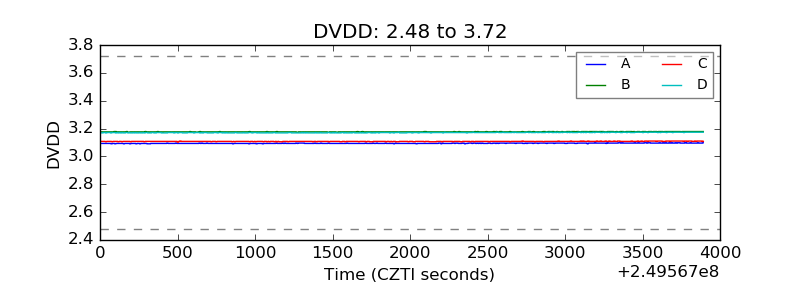 |
| Temperature 1 | 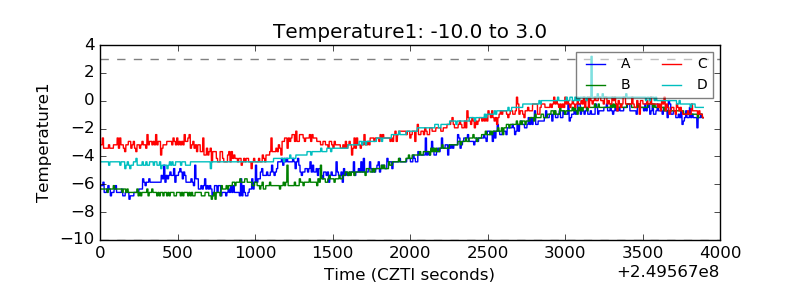 |
| Veto HV Monitor | 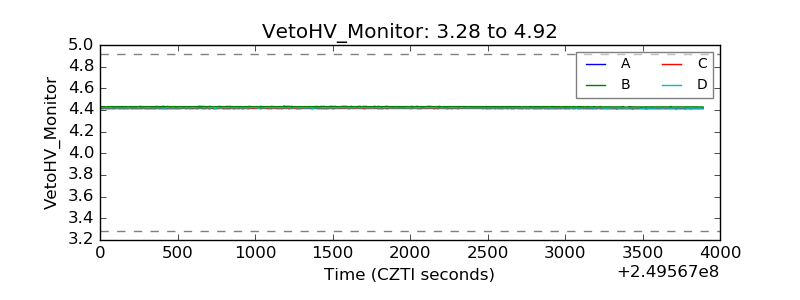 |
| Veto LLD | 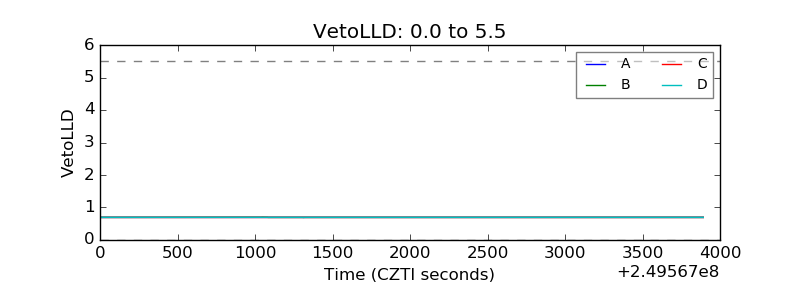 |
| Alpha Counter | 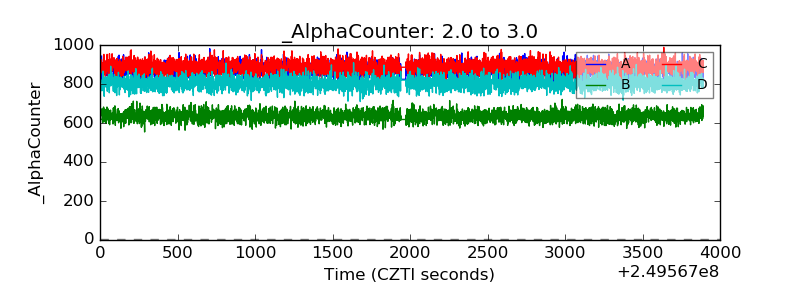 |
| _CPM_Rate | 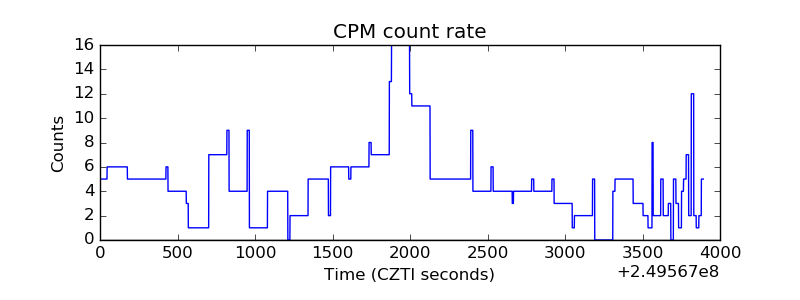 |
| CZT Counter | 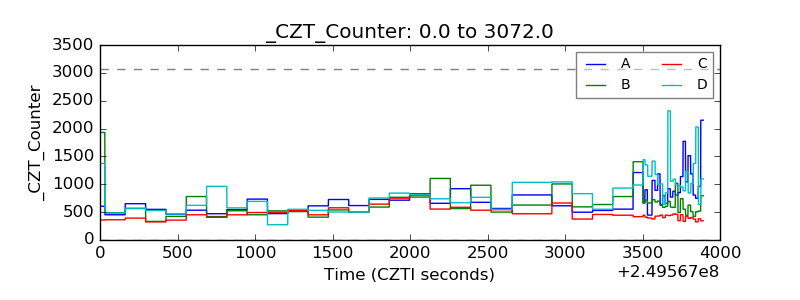 |
| +2.5 Volts monitor | 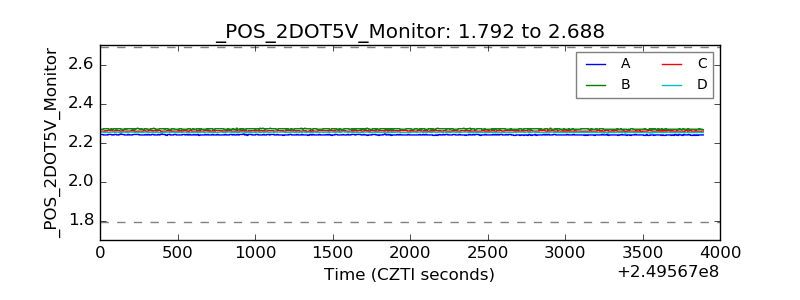 |
| +5 Volts monitor |  |
| _ROLL_ROT | 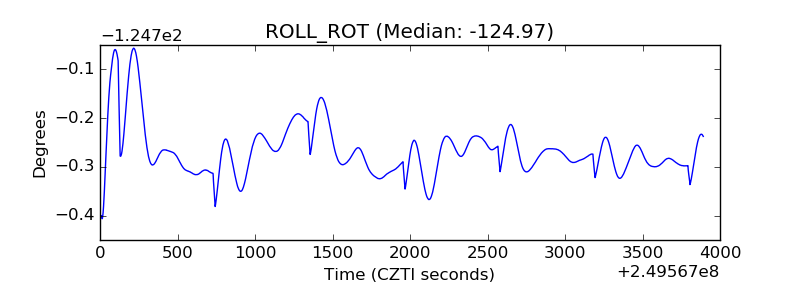 |
| _Roll_DEC | 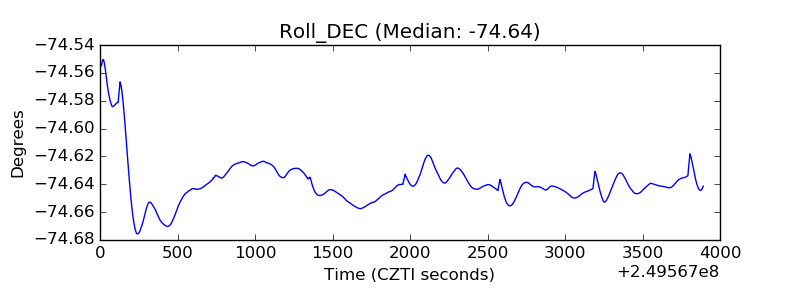 |
| _Roll_RA | 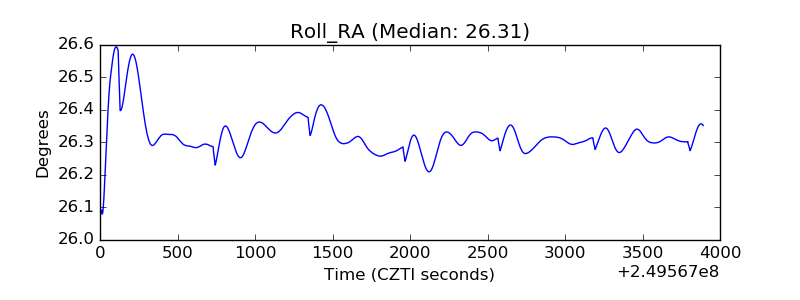 |
| Veto Counter | 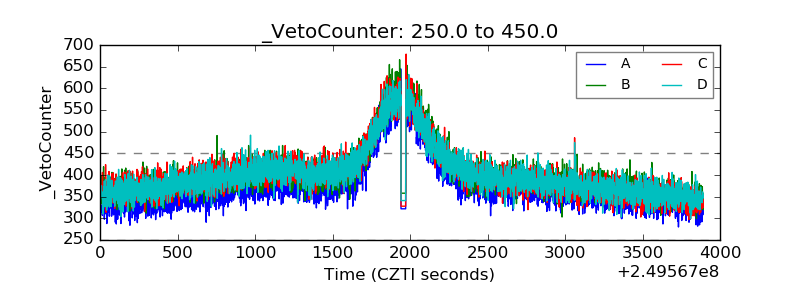 |