| Param | Original file | Final file |
|---|---|---|
| Filename | modeM0/AS1G08_006T02_9000001730_11729cztM0_level2.evt | modeM0/AS1G08_006T02_9000001730_11729cztM0_level2_quad_clean.evt |
| Size (bytes) | 586,644,480 | 111,093,120 |
| Size | 559.5 MB | 105.9 MB |
| Events in quadrant A | 5,026,151 | 724,952 |
| Events in quadrant B | 4,656,963 | 725,450 |
| Events in quadrant C | 3,023,959 | 739,561 |
| Events in quadrant D | 4,595,025 | 696,551 |
| Mode M0 | |||
|---|---|---|---|
| Quadrant | BADHDUFLAG | Total packets | Discarded packets |
| A | 0 | 19661 | 2 |
| B | 0 | 18346 | 1 |
| C | 0 | 14053 | 1 |
| D | 0 | 18358 | 1 |
| Mode M9 | |||
|---|---|---|---|
| Quadrant | BADHDUFLAG | Total packets | Discarded packets |
| A | 0 | 1 | 0 |
| B | 0 | 1 | 0 |
| C | 0 | 1 | 0 |
| D | 0 | 1 | 0 |
| Mode SS | |||
|---|---|---|---|
| Quadrant | BADHDUFLAG | Total packets | Discarded packets |
| A | 0 | 140 | 0 |
| B | 0 | 140 | 0 |
| C | 0 | 140 | 0 |
| D | 0 | 140 | 0 |
| Quadrant | Total seconds | Saturated seconds | Saturation percentage |
|---|---|---|---|
| A | 6853 | 308 | 4.494382% |
| B | 6853 | 434 | 6.332993% |
| C | 6853 | 74 | 1.079819% |
| D | 6853 | 205 | 2.991391% |
Noise dominated data is calculated using 1-second bins in cleaned event files. If a bin has >2000 counts, and if more than 50% of those come from <1% of pixels, then it is considered to be noise-dominated and hence unusable.
| Quadrant | # 1 sec bins | Bins with >0 counts | Bins with >2000 counts | High rate bins dominated by noise | Noise dominated (total time) | Noise dominated (detector-on time) | Marked lightcurve |
|---|---|---|---|---|---|---|---|
| A | 6964 | 6855 | 67 | 67 | 0.96% | 0.98% | 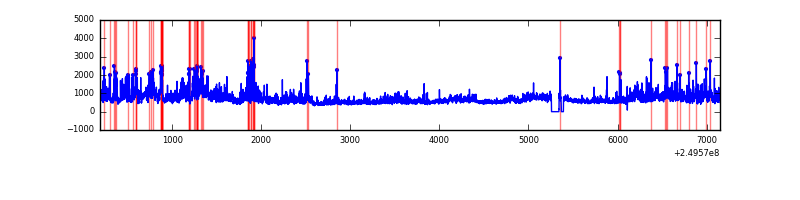 |
| B | 6964 | 6855 | 137 | 137 | 1.97% | 2.00% | 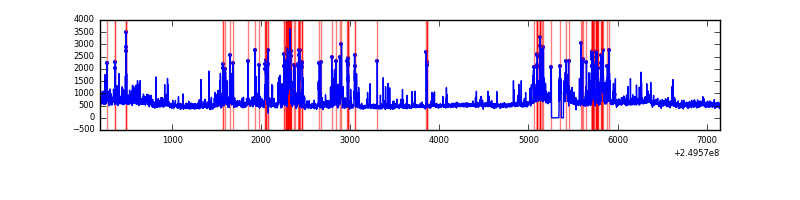 |
| C | 6964 | 6855 | 0 | 0 | 0.00% | 0.00% | 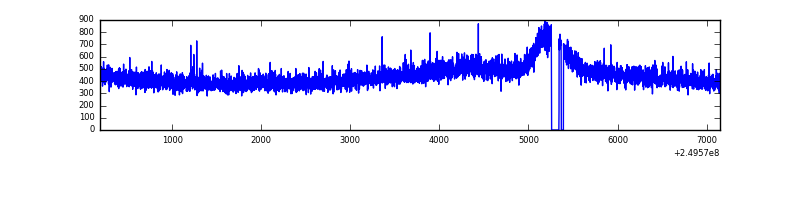 |
| D | 6964 | 6855 | 108 | 108 | 1.55% | 1.58% | 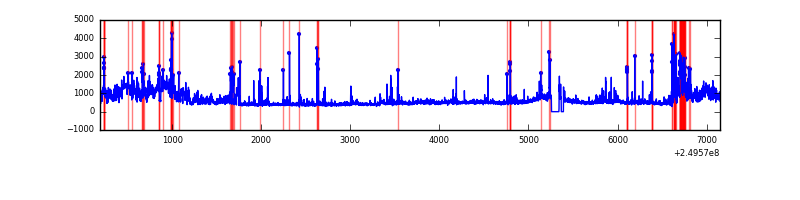 |
Top three noisy pixels from each quadrant. If the there are fewer than three noisy pixels in the level2.evt file, extra rows are filled as -1
| Pixel properties | Quadrant properties | ||||||
|---|---|---|---|---|---|---|---|
| Quadrant | DetID | PixID | Counts | Sigma | Mean | Median | Sigma |
| A | 8 | 15 | 1360164 | 8458.15 | 791 | 771 | 160.7 |
| A | 9 | 143 | 231331 | 1434.55 | 791 | 771 | 160.7 |
| A | 1 | 162 | 137443 | 850.37 | 791 | 771 | 160.7 |
| B | 4 | 239 | 685082 | 4535.38 | 786 | 765 | 150.9 |
| B | 15 | 204 | 371821 | 2459.21 | 786 | 765 | 150.9 |
| B | 3 | 64 | 293199 | 1938.13 | 786 | 765 | 150.9 |
| C | 8 | 222 | 8975 | 45.84 | 772 | 773 | 178.9 |
| C | 13 | 61 | 5768 | 27.92 | 772 | 773 | 178.9 |
| C | 12 | 4 | 4037 | 18.24 | 772 | 773 | 178.9 |
| D | 10 | 157 | 693310 | 3722.09 | 767 | 742 | 186.1 |
| D | 2 | 33 | 232430 | 1245.17 | 767 | 742 | 186.1 |
| D | 4 | 95 | 185170 | 991.18 | 767 | 742 | 186.1 |
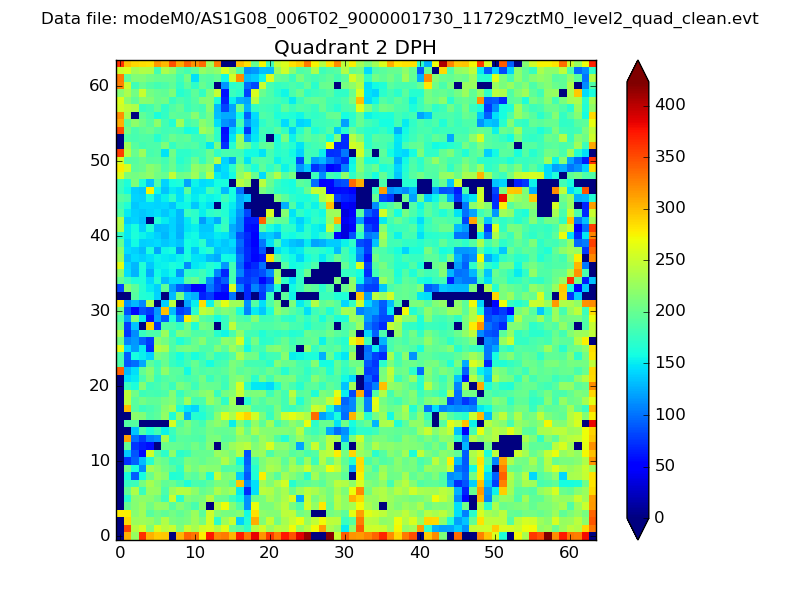
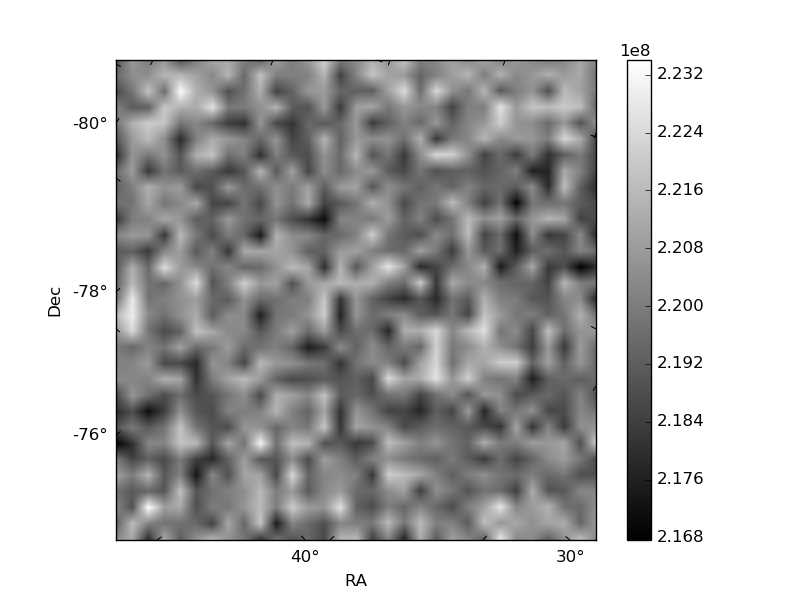
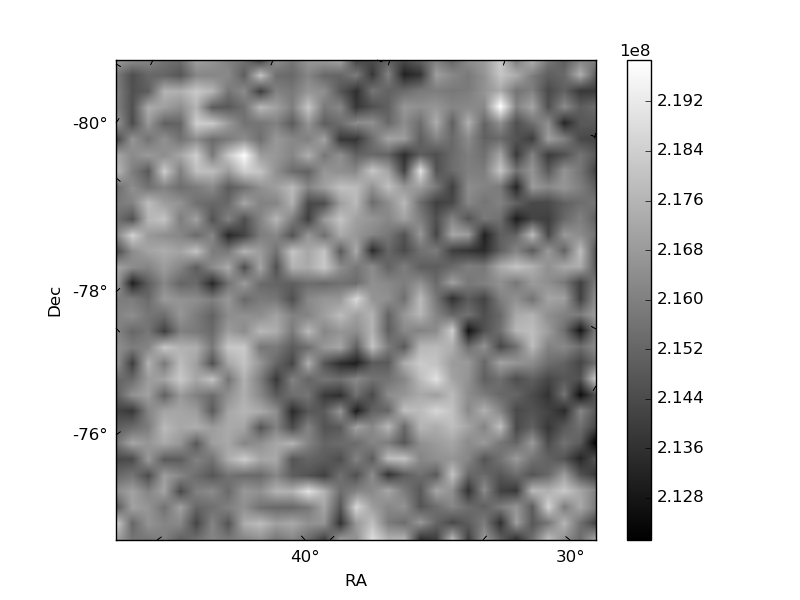
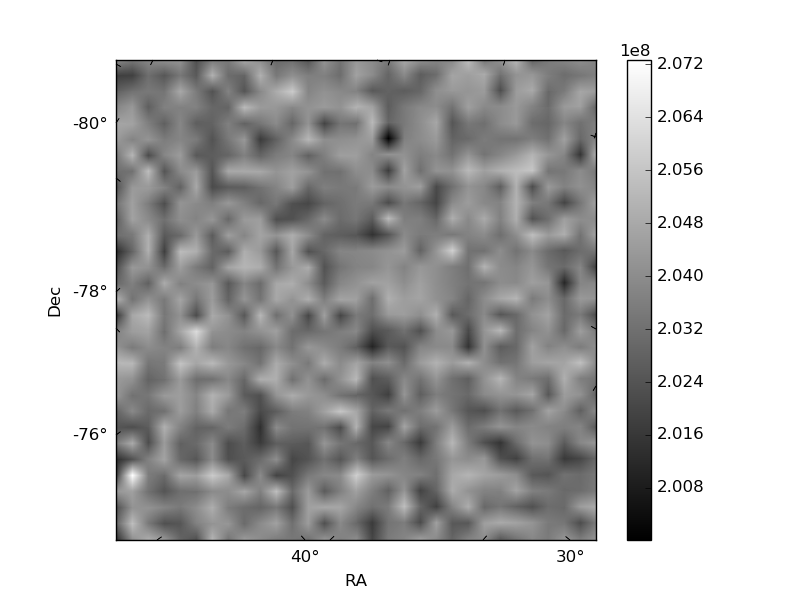
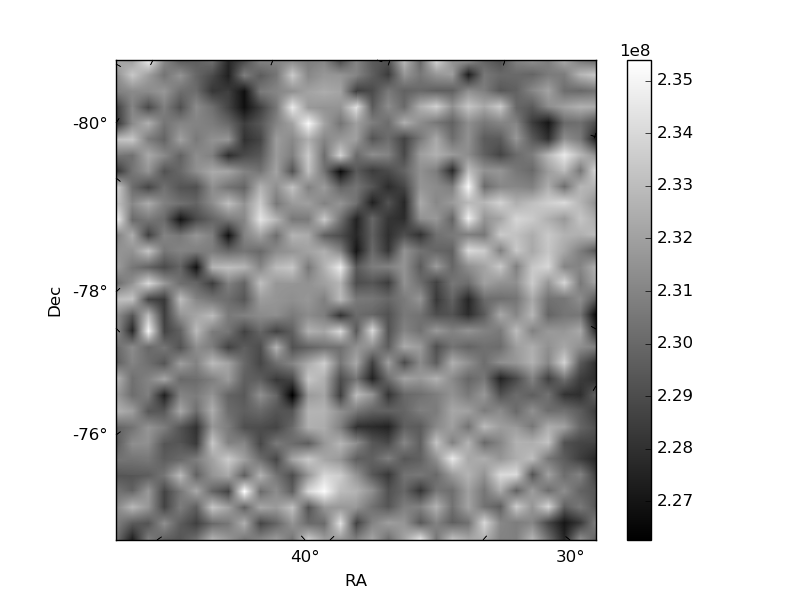
Histogram calculated using DETX and DETY for each event in the final _common_clean file
| Quadrant A |  |
 |
Quadrant B |
|---|---|---|---|
| Quadrant D | 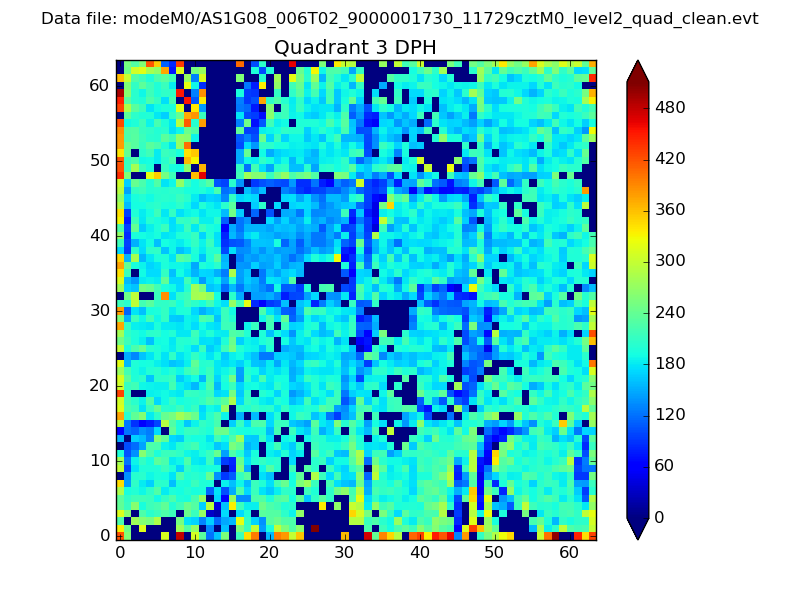 |
 |
Quadrant C |
| Plot type | Count rate plots | Images |
|---|---|---|
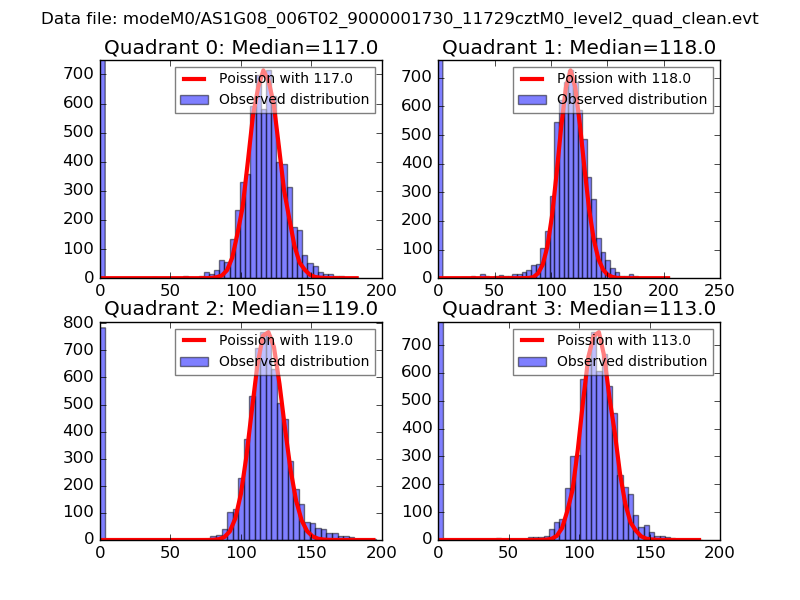
| Comparison with Poisson distribution Blue bars denote a histogram of data divided into 1 sec bins. Red curve is a Poisson curve with rate = median count rate of data. |
 |
 |
| Quadrant-wise count rates Data is divided into 100 sec bins |
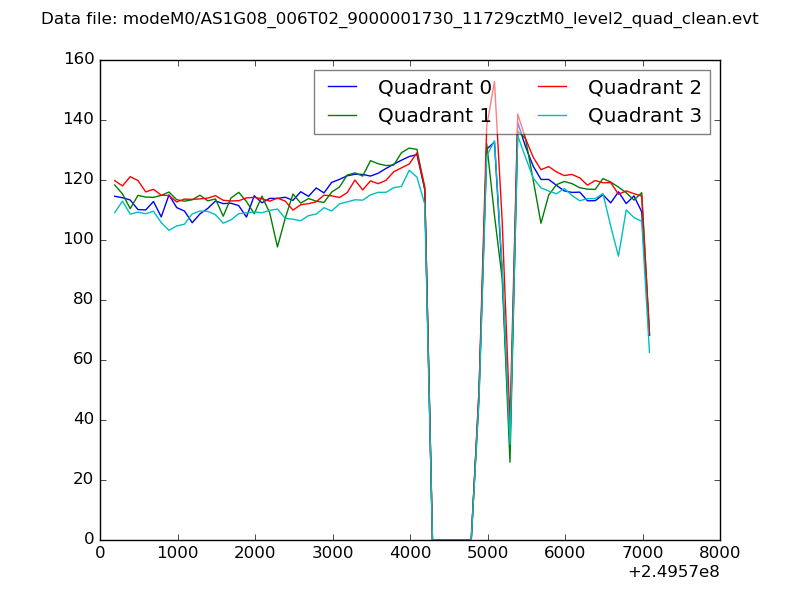 |
|
| Module-wise count rates for Quadrant A Data is divided into 100 sec bins |
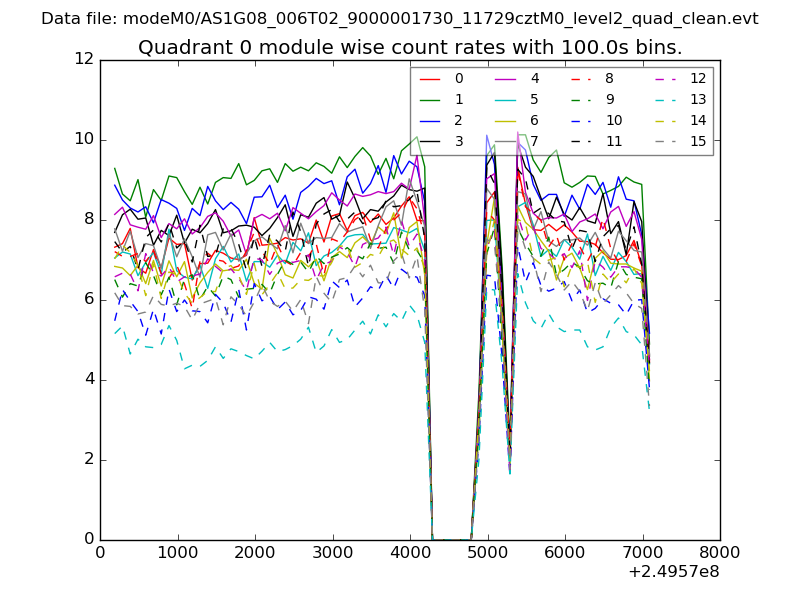 |
 |
| Module-wise count rates for Quadrant B Data is divided into 100 sec bins |
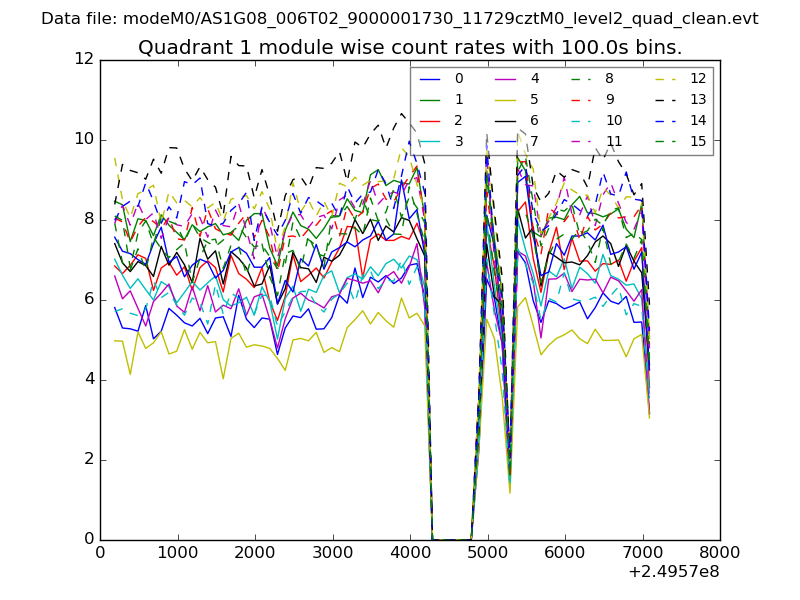 |
 |
| Module-wise count rates for Quadrant C Data is divided into 100 sec bins |
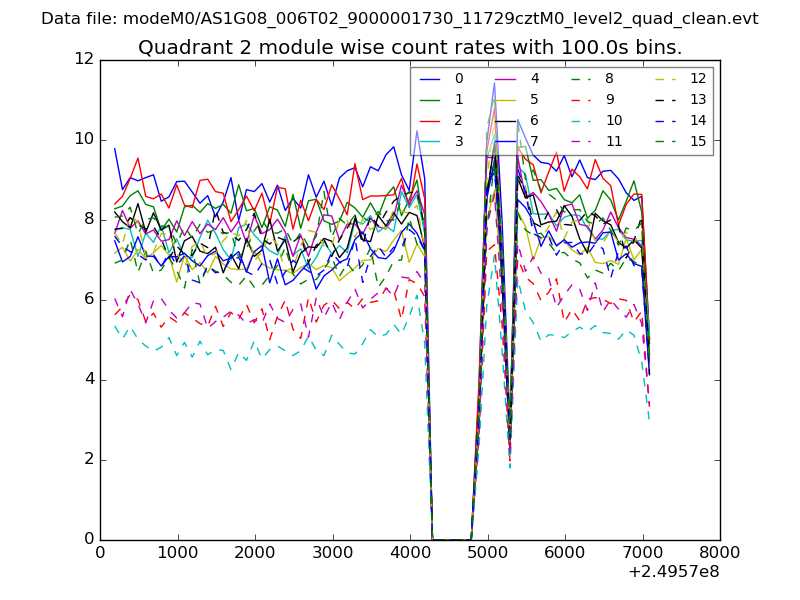 |
 |
| Module-wise count rates for Quadrant D Data is divided into 100 sec bins |
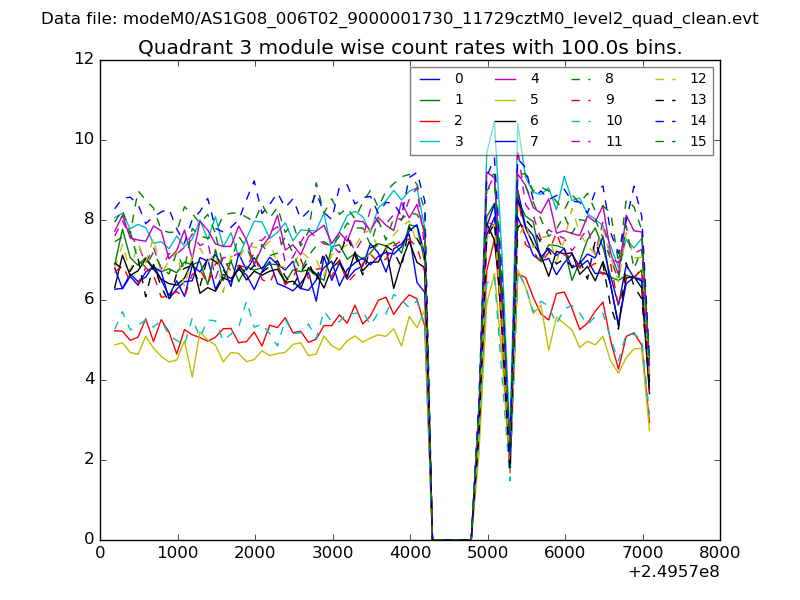 |
 |
| Parameter | Plot |
|---|---|
| CZT HV Monitor | 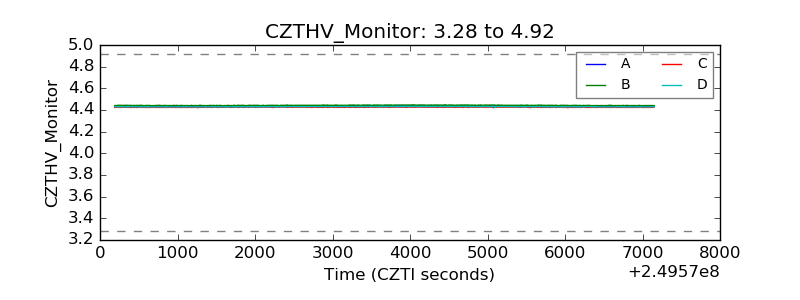 |
| D_VDD | 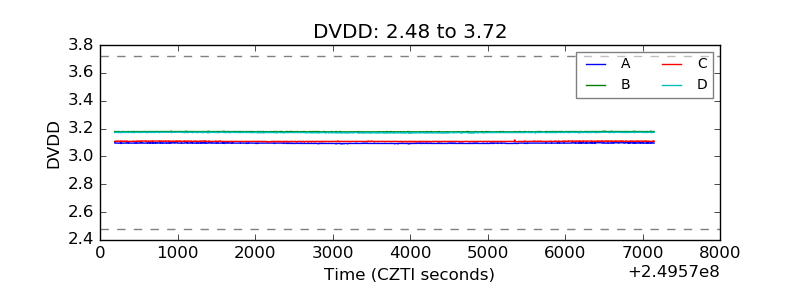 |
| Temperature 1 | 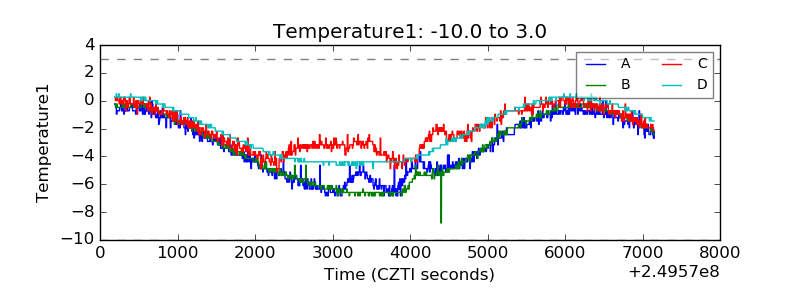 |
| Veto HV Monitor | 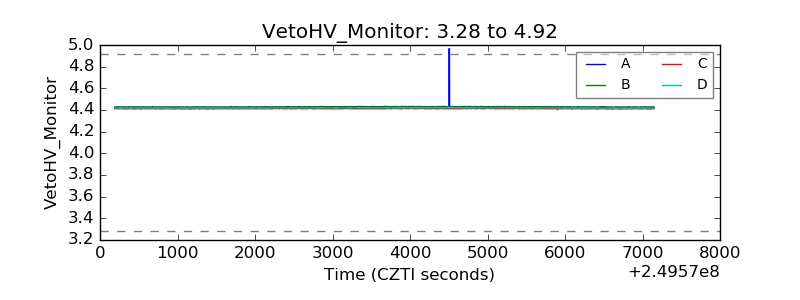 |
| Veto LLD | 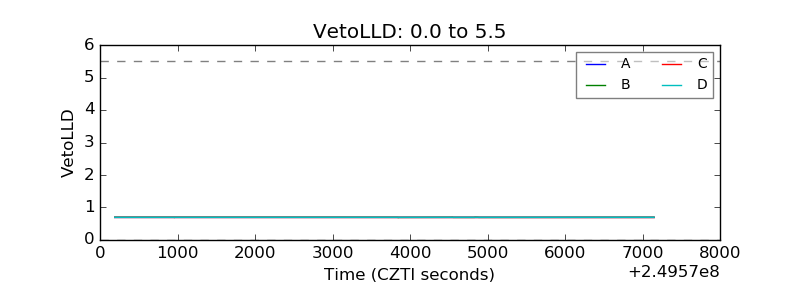 |
| Alpha Counter | 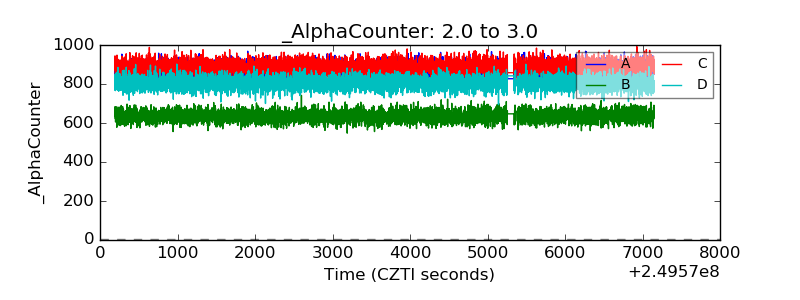 |
| _CPM_Rate | 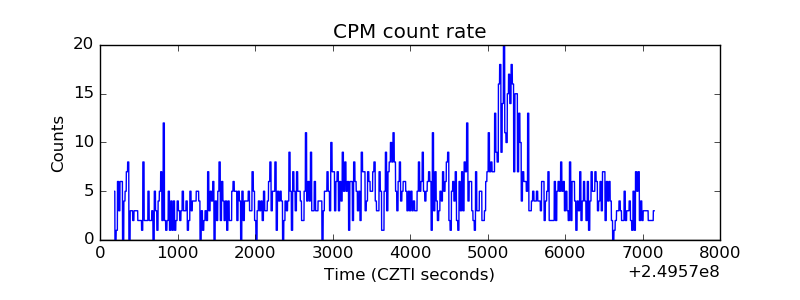 |
| CZT Counter | 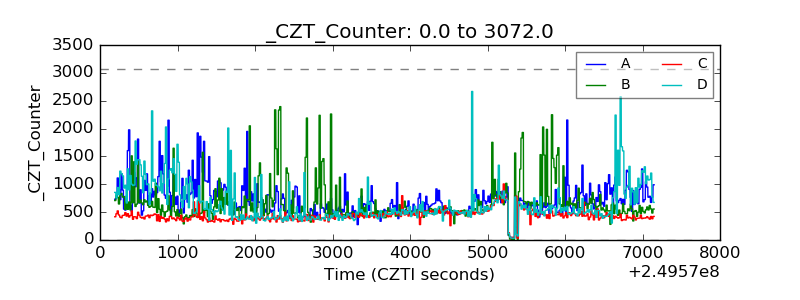 |
| +2.5 Volts monitor |  |
| +5 Volts monitor | 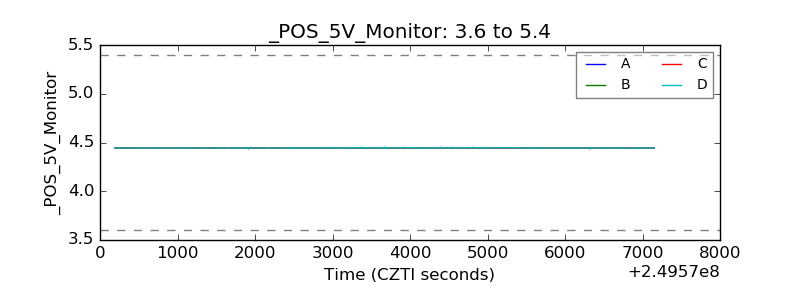 |
| _ROLL_ROT | 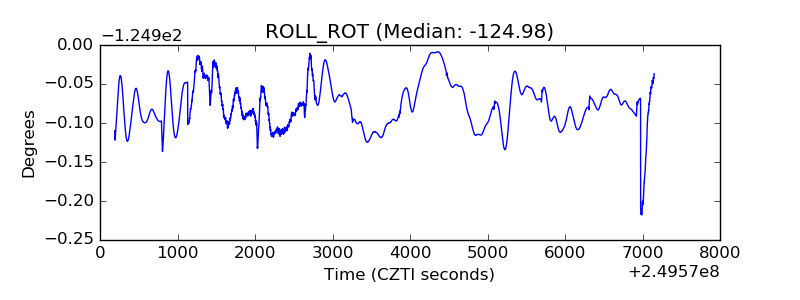 |
| _Roll_DEC | 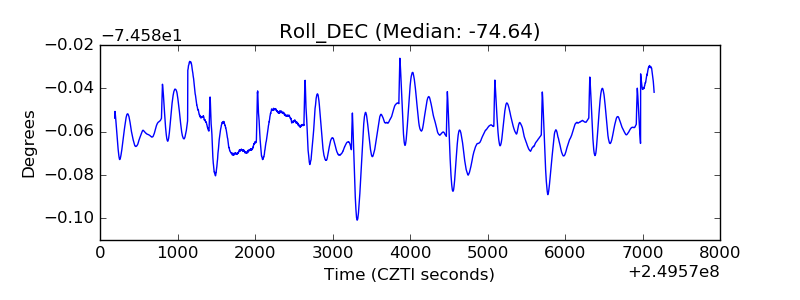 |
| _Roll_RA |  |
| Veto Counter | 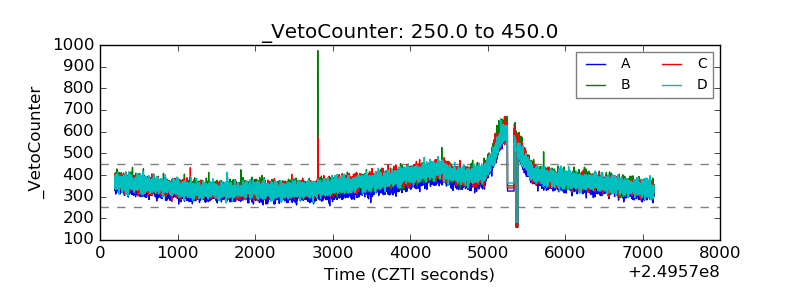 |