| Param | Original file | Final file |
|---|---|---|
| Filename | modeM0/AS1G08_006T02_9000001730_11732cztM0_level2.evt | modeM0/AS1G08_006T02_9000001730_11732cztM0_level2_quad_clean.evt |
| Size (bytes) | 389,338,560 | 75,458,880 |
| Size | 371.3 MB | 72.0 MB |
| Events in quadrant A | 3,244,041 | 489,674 |
| Events in quadrant B | 2,906,474 | 494,178 |
| Events in quadrant C | 2,088,177 | 490,707 |
| Events in quadrant D | 3,217,454 | 465,018 |
| Mode M0 | |||
|---|---|---|---|
| Quadrant | BADHDUFLAG | Total packets | Discarded packets |
| A | 0 | 12966 | 1 |
| B | 0 | 11804 | 0 |
| C | 0 | 9902 | 0 |
| D | 0 | 12970 | 0 |
| Mode SS | |||
|---|---|---|---|
| Quadrant | BADHDUFLAG | Total packets | Discarded packets |
| A | 0 | 98 | 0 |
| B | 0 | 98 | 0 |
| C | 0 | 98 | 0 |
| D | 0 | 98 | 0 |
| Quadrant | Total seconds | Saturated seconds | Saturation percentage |
|---|---|---|---|
| A | 4927 | 76 | 1.542521% |
| B | 4927 | 77 | 1.562817% |
| C | 4927 | 2 | 0.040593% |
| D | 4927 | 187 | 3.795413% |
Noise dominated data is calculated using 1-second bins in cleaned event files. If a bin has >2000 counts, and if more than 50% of those come from <1% of pixels, then it is considered to be noise-dominated and hence unusable.
| Quadrant | # 1 sec bins | Bins with >0 counts | Bins with >2000 counts | High rate bins dominated by noise | Noise dominated (total time) | Noise dominated (detector-on time) | Marked lightcurve |
|---|---|---|---|---|---|---|---|
| A | 4928 | 4928 | 22 | 22 | 0.45% | 0.45% | 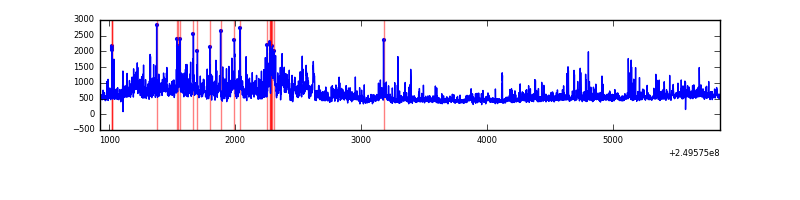 |
| B | 4928 | 4928 | 43 | 43 | 0.87% | 0.87% | 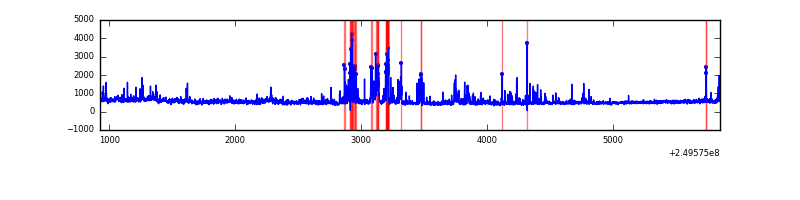 |
| C | 4928 | 4928 | 0 | 0 | 0.00% | 0.00% | 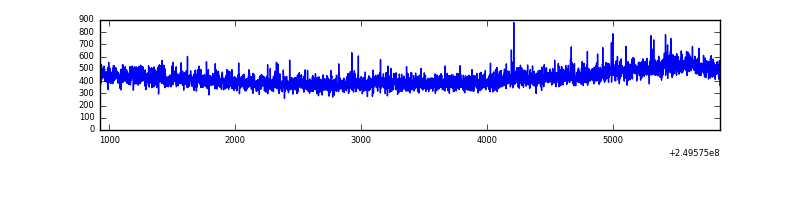 |
| D | 4928 | 4928 | 176 | 176 | 3.57% | 3.57% | 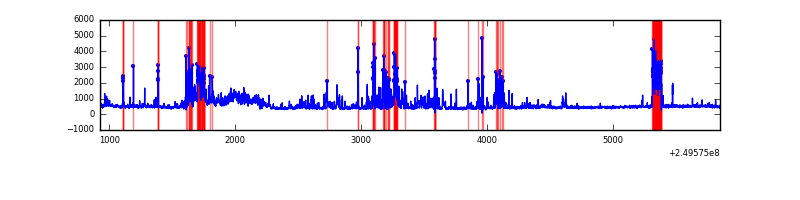 |
Top three noisy pixels from each quadrant. If the there are fewer than three noisy pixels in the level2.evt file, extra rows are filled as -1
| Pixel properties | Quadrant properties | ||||||
|---|---|---|---|---|---|---|---|
| Quadrant | DetID | PixID | Counts | Sigma | Mean | Median | Sigma |
| A | 8 | 15 | 528558 | 4709.9 | 546 | 534 | 112.1 |
| A | 9 | 143 | 228721 | 2035.4 | 546 | 534 | 112.1 |
| A | 1 | 162 | 124177 | 1102.88 | 546 | 534 | 112.1 |
| B | 4 | 239 | 292681 | 2747.58 | 551 | 539 | 106.3 |
| B | 15 | 204 | 231392 | 2171.16 | 551 | 539 | 106.3 |
| B | 3 | 64 | 106202 | 993.76 | 551 | 539 | 106.3 |
| C | 12 | 4 | 5996 | 43.92 | 533 | 535 | 124.3 |
| C | 13 | 61 | 4002 | 27.88 | 533 | 535 | 124.3 |
| C | 8 | 222 | 2049 | 12.18 | 533 | 535 | 124.3 |
| D | 4 | 95 | 452929 | 3584.2 | 516 | 499 | 126.2 |
| D | 2 | 33 | 287329 | 2272.3 | 516 | 499 | 126.2 |
| D | 10 | 253 | 121989 | 962.46 | 516 | 499 | 126.2 |
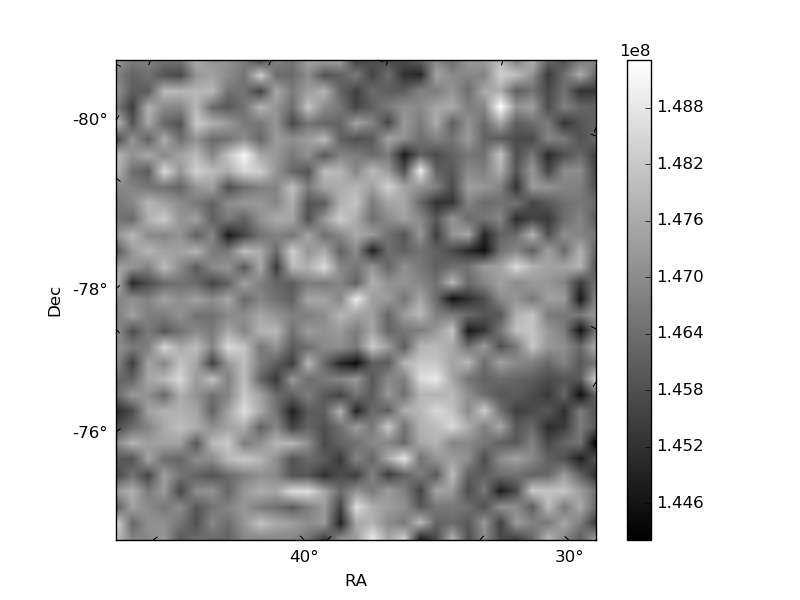
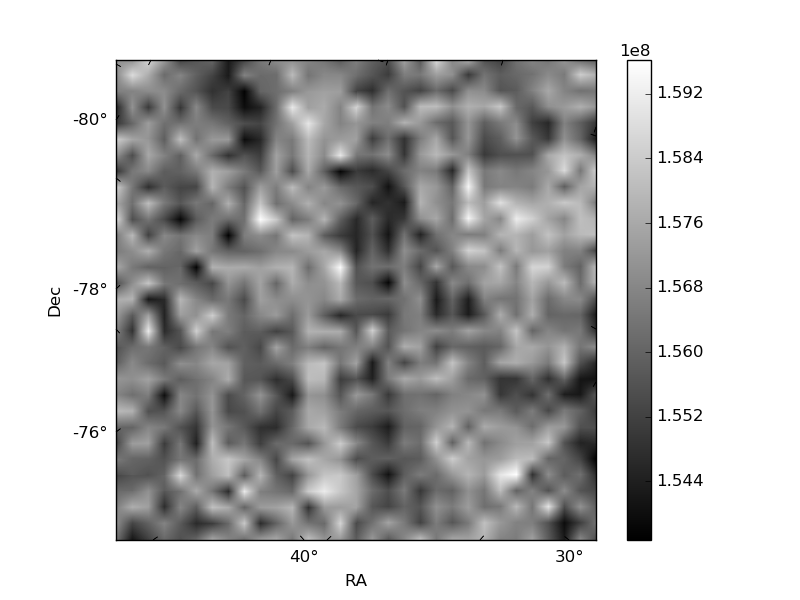
Histogram calculated using DETX and DETY for each event in the final _common_clean file
| Quadrant A | 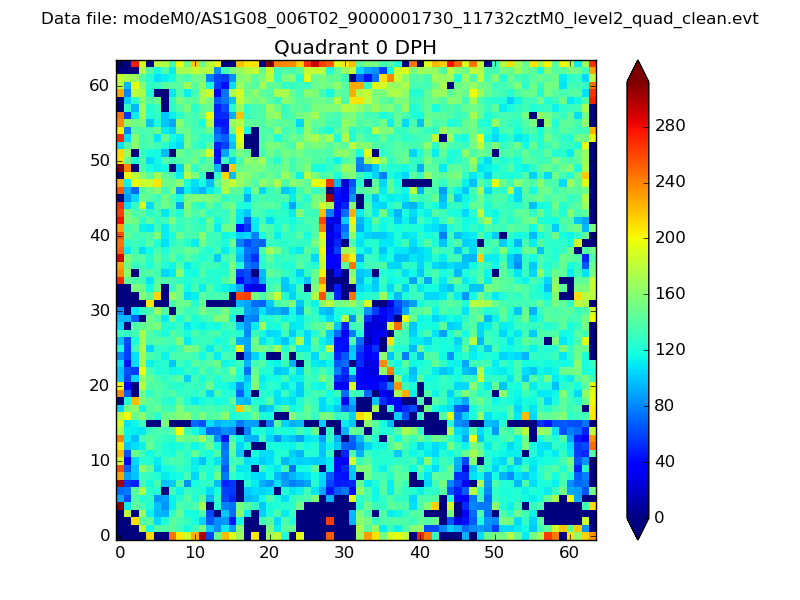 |
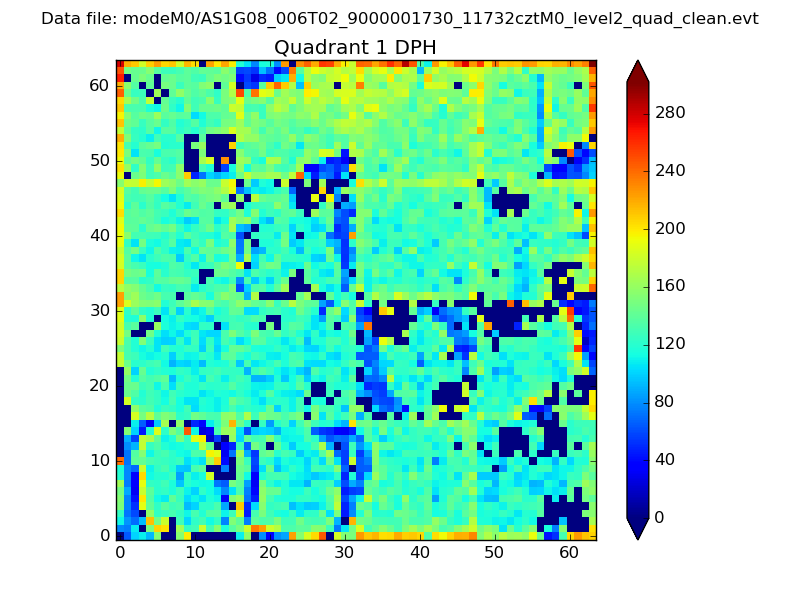 |
Quadrant B |
|---|---|---|---|
| Quadrant D | 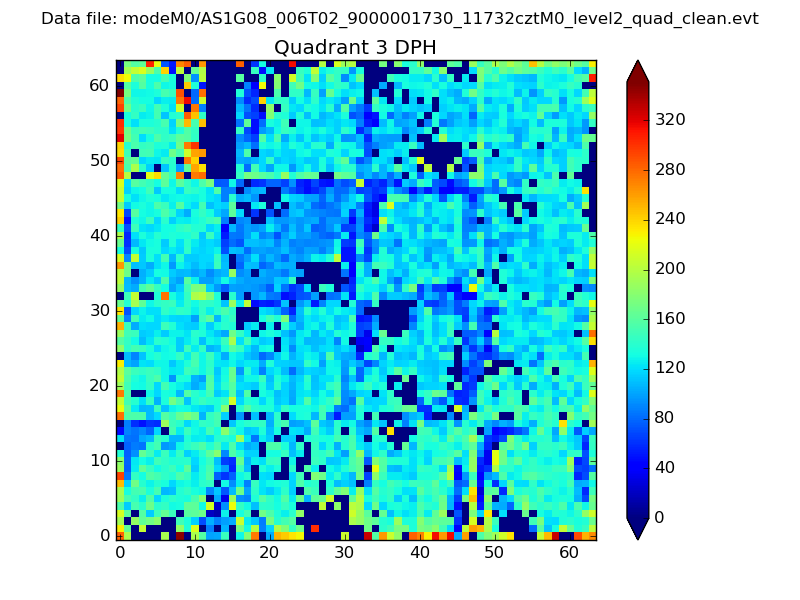 |
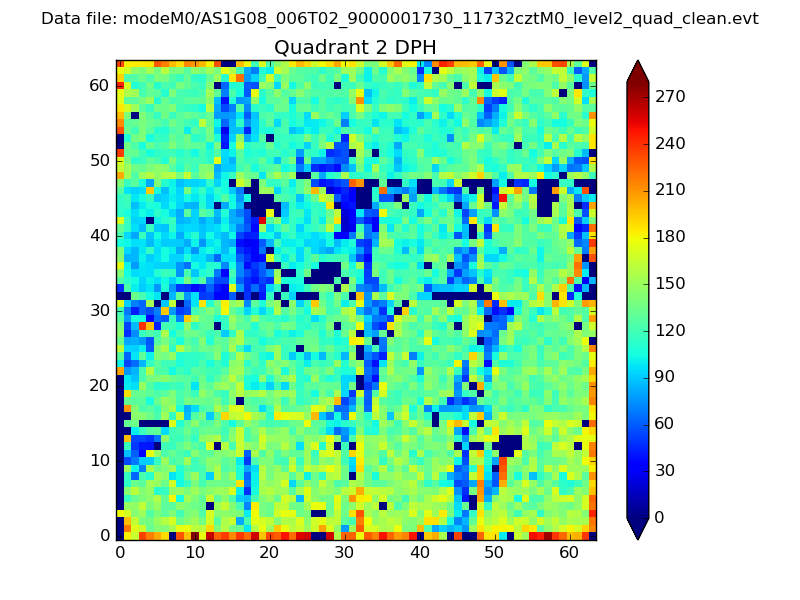 |
Quadrant C |
| Plot type | Count rate plots | Images |
|---|---|---|
| Comparison with Poisson distribution Blue bars denote a histogram of data divided into 1 sec bins. Red curve is a Poisson curve with rate = median count rate of data. |
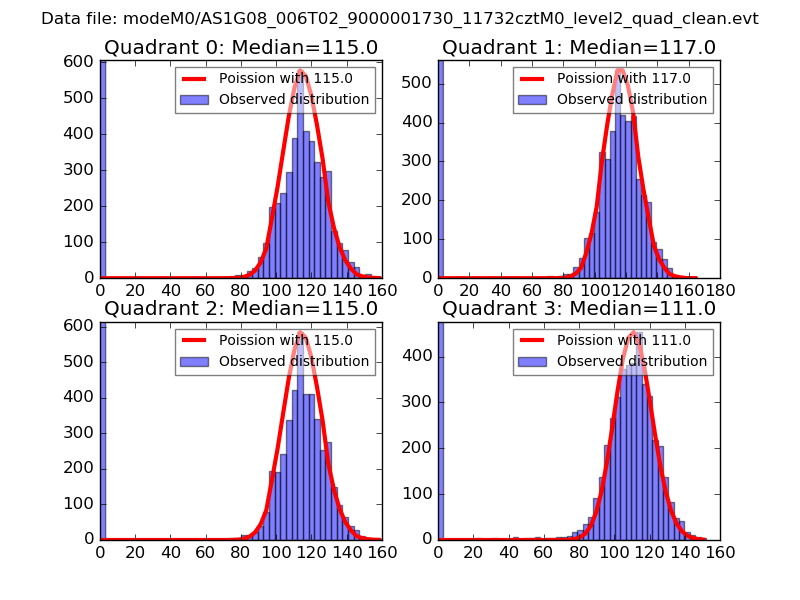 |
 |
| Quadrant-wise count rates Data is divided into 100 sec bins |
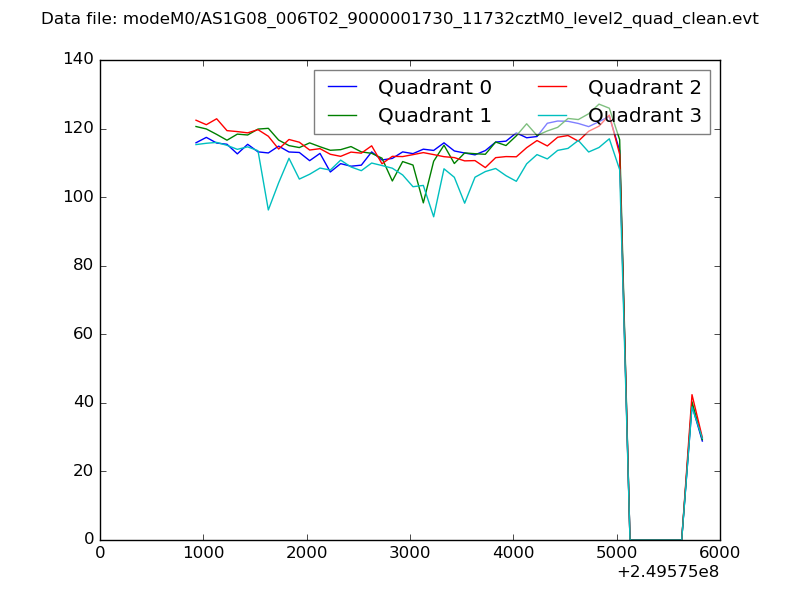 |
|
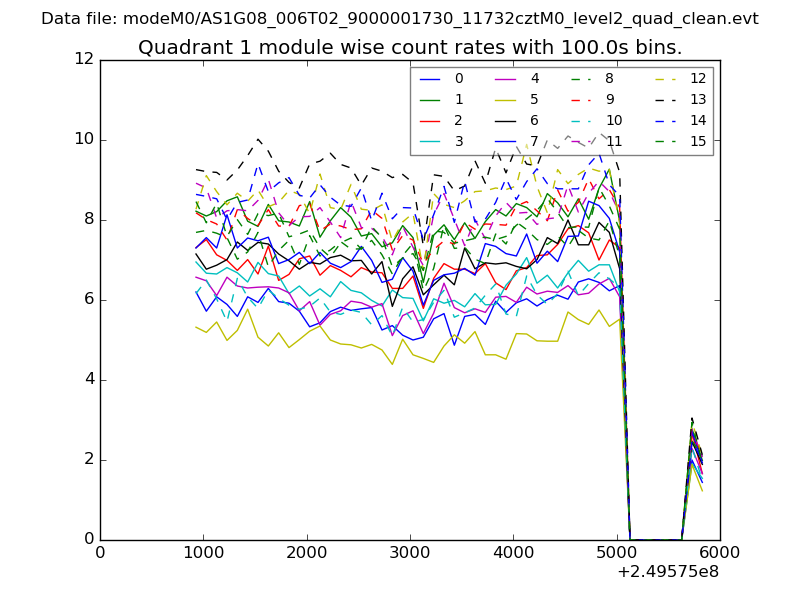
| Module-wise count rates for Quadrant A Data is divided into 100 sec bins |
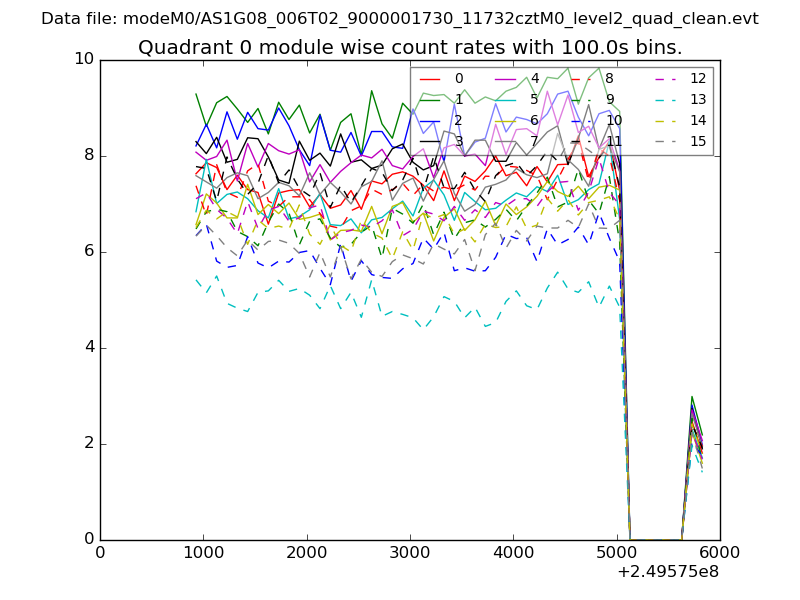 |
 |
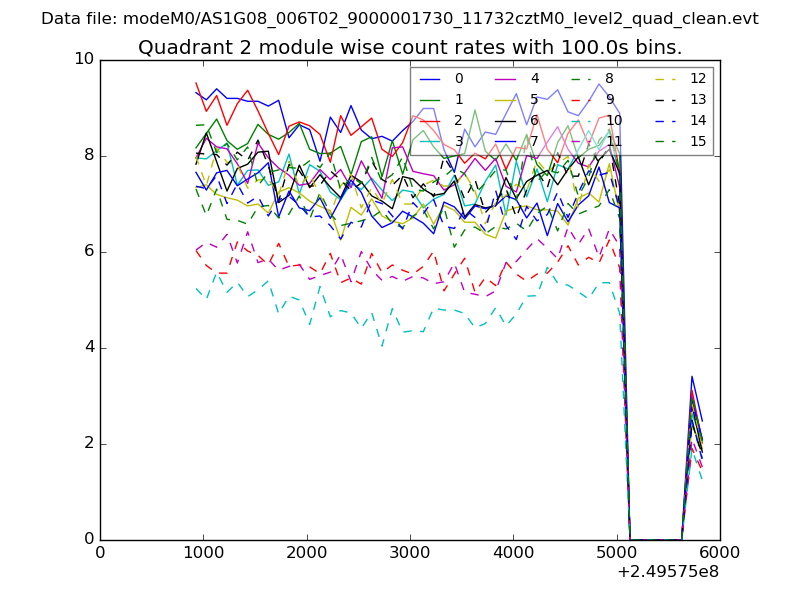
| Module-wise count rates for Quadrant B Data is divided into 100 sec bins |
 |
 |
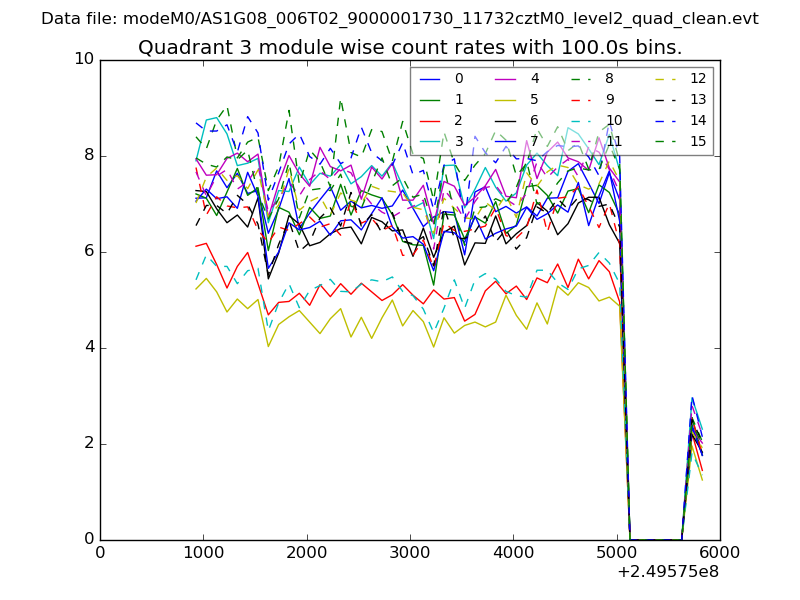
| Module-wise count rates for Quadrant C Data is divided into 100 sec bins |
 |
 |
| Module-wise count rates for Quadrant D Data is divided into 100 sec bins |
 |
 |
| Parameter | Plot |
|---|---|
| CZT HV Monitor | 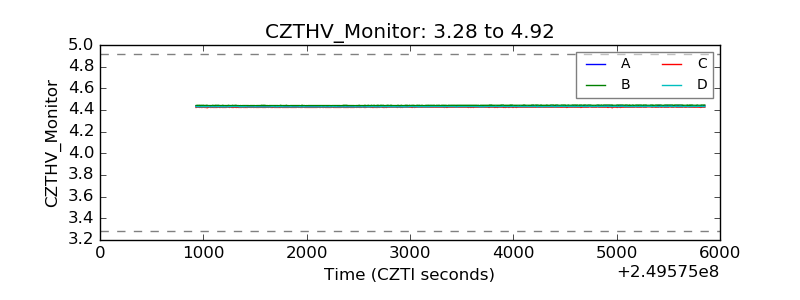 |
| D_VDD | 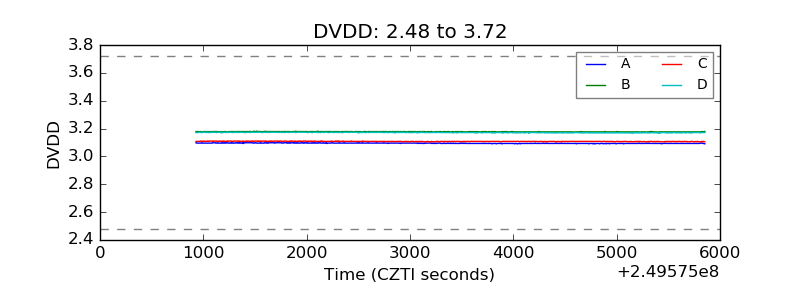 |
| Temperature 1 | 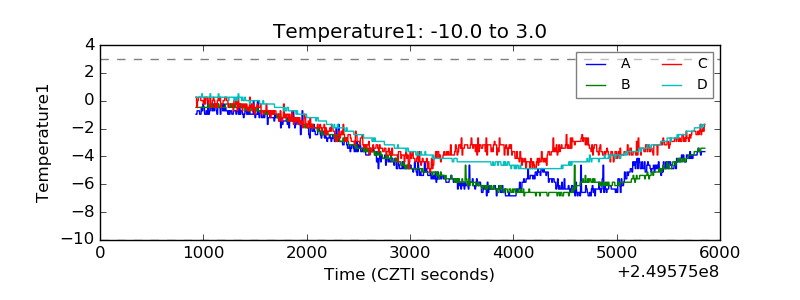 |
| Veto HV Monitor |  |
| Veto LLD | 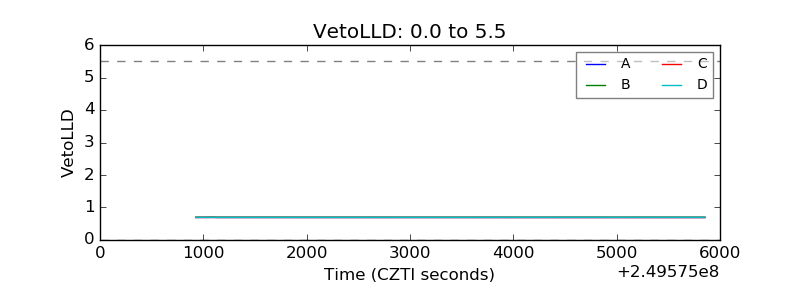 |
| Alpha Counter | 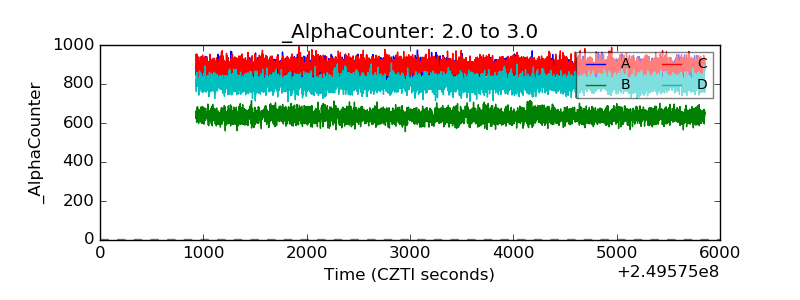 |
| _CPM_Rate | 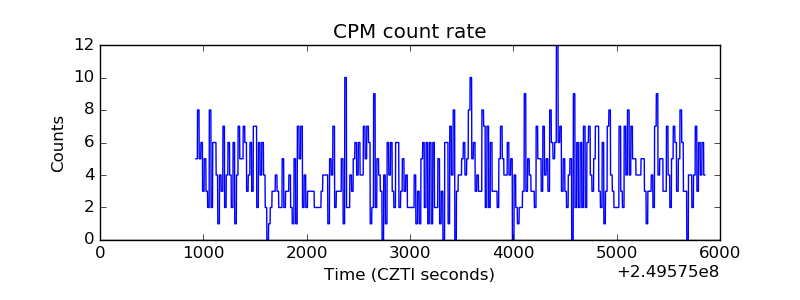 |
| CZT Counter | 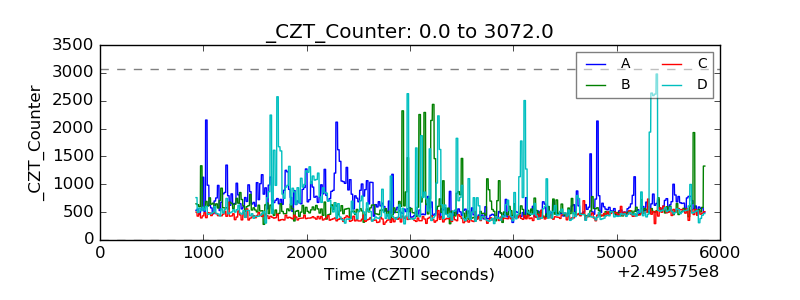 |
| +2.5 Volts monitor |  |
| +5 Volts monitor |  |
| _ROLL_ROT | 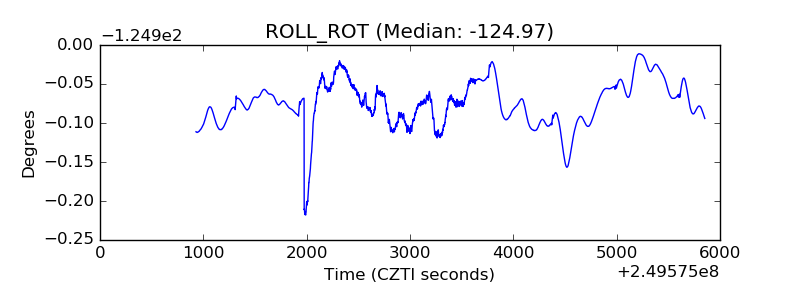 |
| _Roll_DEC | 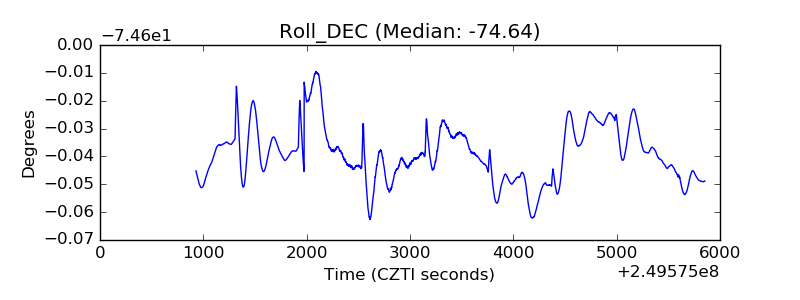 |
| _Roll_RA |  |
| Veto Counter | 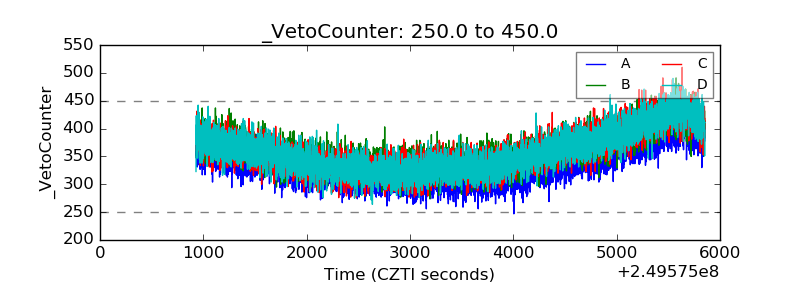 |