| Param | Original file | Final file |
|---|---|---|
| Filename | modeM0/AS1G08_006T02_9000001730_11733cztM0_level2.evt | modeM0/AS1G08_006T02_9000001730_11733cztM0_level2_quad_clean.evt |
| Size (bytes) | 702,624,960 | 125,346,240 |
| Size | 670.1 MB | 119.5 MB |
| Events in quadrant A | 5,986,074 | 812,846 |
| Events in quadrant B | 6,026,144 | 798,612 |
| Events in quadrant C | 3,695,771 | 826,375 |
| Events in quadrant D | 5,011,598 | 783,873 |
| Mode M0 | |||
|---|---|---|---|
| Quadrant | BADHDUFLAG | Total packets | Discarded packets |
| A | 0 | 23581 | 2 |
| B | 0 | 23405 | 2 |
| C | 0 | 16794 | 2 |
| D | 0 | 20624 | 2 |
| Mode M9 | |||
|---|---|---|---|
| Quadrant | BADHDUFLAG | Total packets | Discarded packets |
| A | 0 | 10 | 0 |
| B | 0 | 10 | 0 |
| C | 0 | 10 | 0 |
| D | 0 | 10 | 0 |
| Mode SS | |||
|---|---|---|---|
| Quadrant | BADHDUFLAG | Total packets | Discarded packets |
| A | 0 | 170 | 0 |
| B | 0 | 170 | 0 |
| C | 0 | 170 | 0 |
| D | 0 | 170 | 0 |
| Quadrant | Total seconds | Saturated seconds | Saturation percentage |
|---|---|---|---|
| A | 8264 | 299 | 3.618103% |
| B | 8264 | 716 | 8.664085% |
| C | 8264 | 32 | 0.387222% |
| D | 8264 | 281 | 3.400290% |
Noise dominated data is calculated using 1-second bins in cleaned event files. If a bin has >2000 counts, and if more than 50% of those come from <1% of pixels, then it is considered to be noise-dominated and hence unusable.
| Quadrant | # 1 sec bins | Bins with >0 counts | Bins with >2000 counts | High rate bins dominated by noise | Noise dominated (total time) | Noise dominated (detector-on time) | Marked lightcurve |
|---|---|---|---|---|---|---|---|
| A | 9285 | 8267 | 62 | 62 | 0.67% | 0.75% | 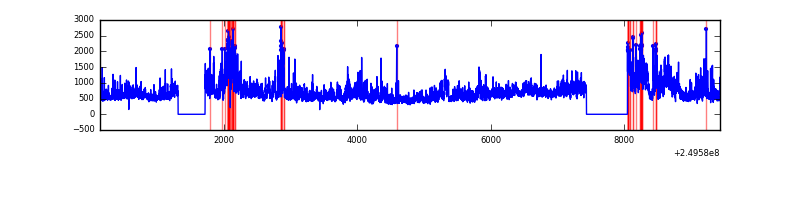 |
| B | 9285 | 8267 | 423 | 423 | 4.56% | 5.12% | 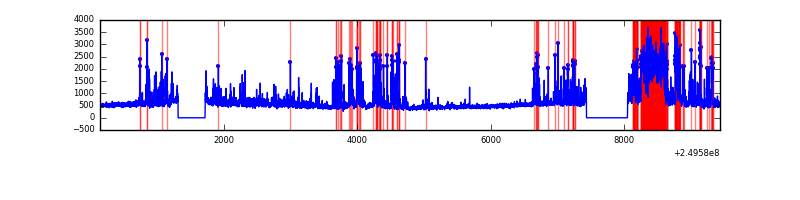 |
| C | 9285 | 8267 | 0 | 0 | 0.00% | 0.00% | 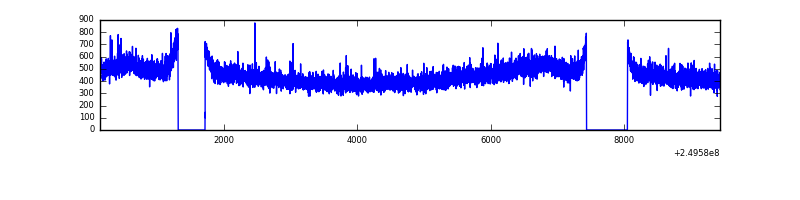 |
| D | 9285 | 8266 | 200 | 200 | 2.15% | 2.42% | 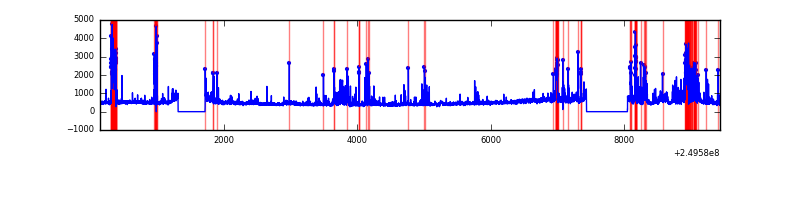 |
Top three noisy pixels from each quadrant. If the there are fewer than three noisy pixels in the level2.evt file, extra rows are filled as -1
| Pixel properties | Quadrant properties | ||||||
|---|---|---|---|---|---|---|---|
| Quadrant | DetID | PixID | Counts | Sigma | Mean | Median | Sigma |
| A | 8 | 15 | 1628173 | 8235.52 | 966 | 943 | 197.6 |
| A | 9 | 143 | 202297 | 1019.07 | 966 | 943 | 197.6 |
| A | 1 | 162 | 138282 | 695.08 | 966 | 943 | 197.6 |
| B | 4 | 239 | 1570136 | 8614.25 | 950 | 928 | 182.2 |
| B | 15 | 204 | 305322 | 1670.99 | 950 | 928 | 182.2 |
| B | 3 | 64 | 193036 | 1054.59 | 950 | 928 | 182.2 |
| C | 12 | 4 | 8674 | 35.34 | 944 | 946 | 218.6 |
| C | 13 | 61 | 7063 | 27.98 | 944 | 946 | 218.6 |
| C | 8 | 222 | 3407 | 11.26 | 944 | 946 | 218.6 |
| D | 2 | 33 | 414681 | 1838.24 | 928 | 896 | 225.1 |
| D | 4 | 95 | 273165 | 1209.55 | 928 | 896 | 225.1 |
| D | 8 | 195 | 267501 | 1184.39 | 928 | 896 | 225.1 |
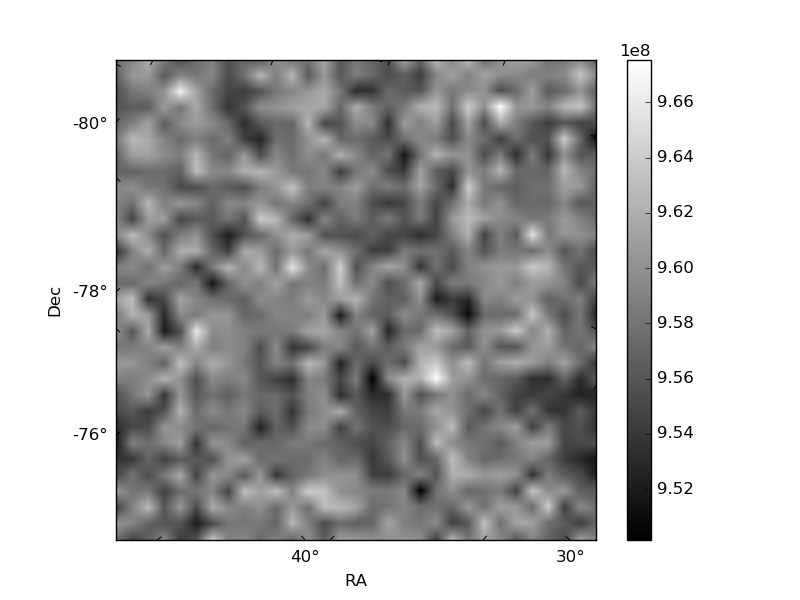
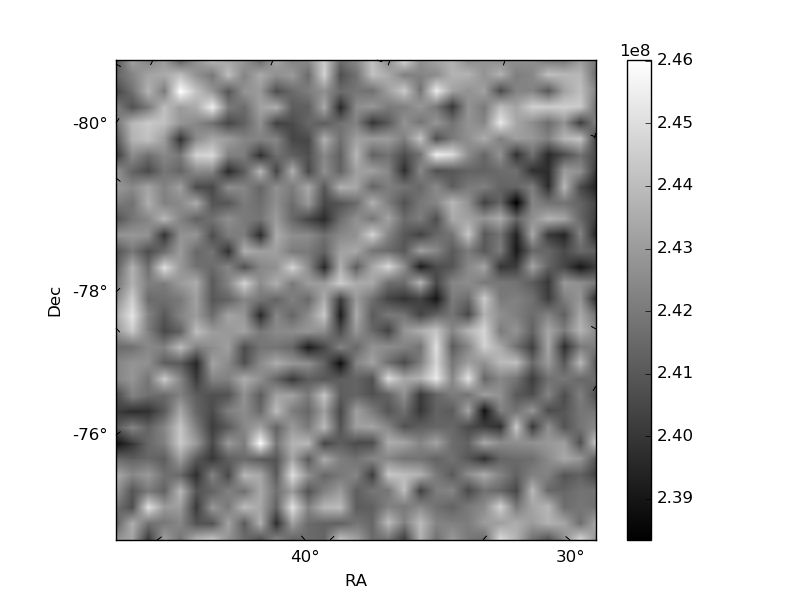
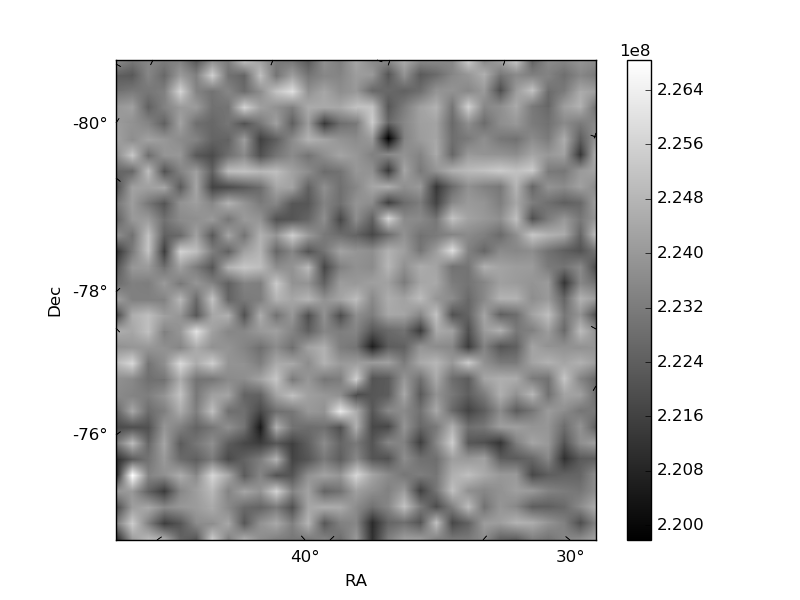
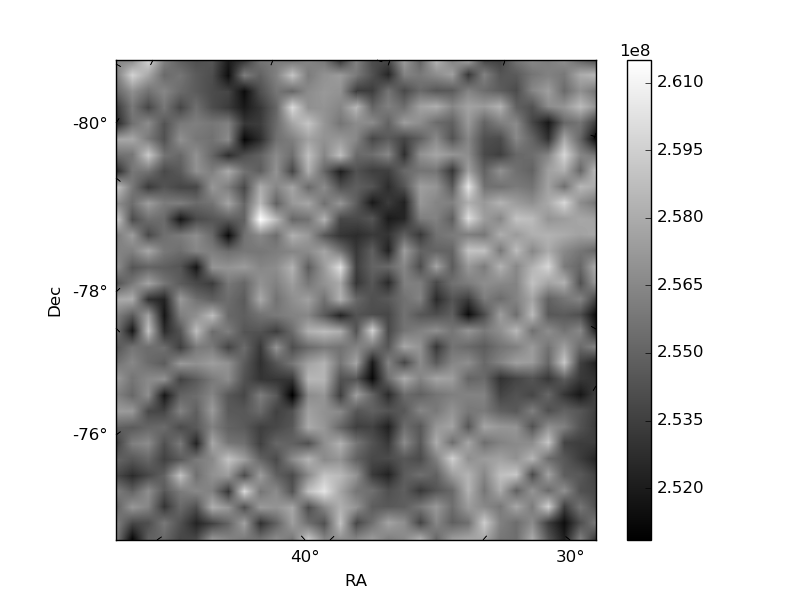
Histogram calculated using DETX and DETY for each event in the final _common_clean file
| Quadrant A | 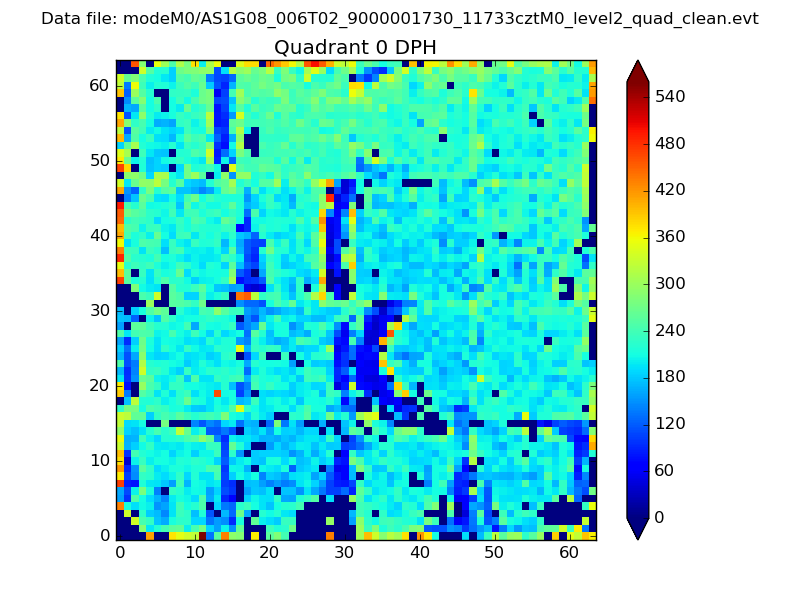 |
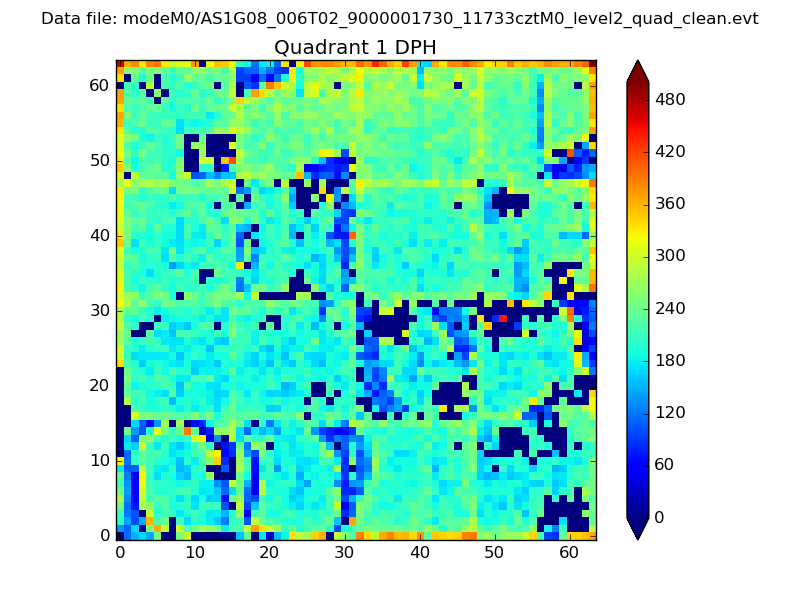 |
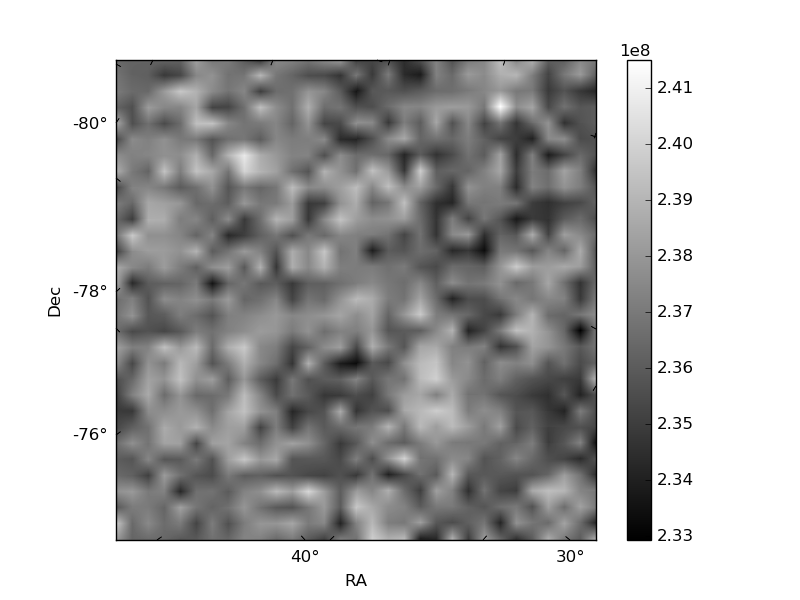
Quadrant B |
|---|---|---|---|
| Quadrant D | 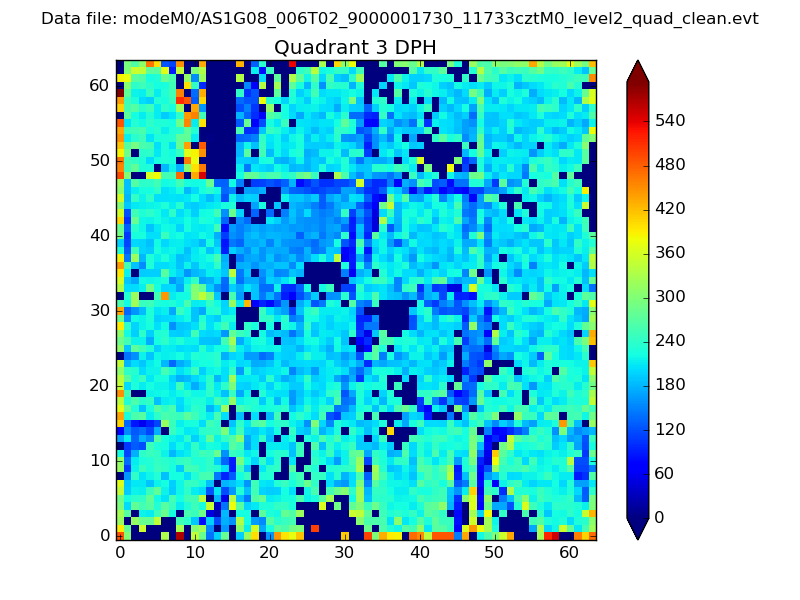 |
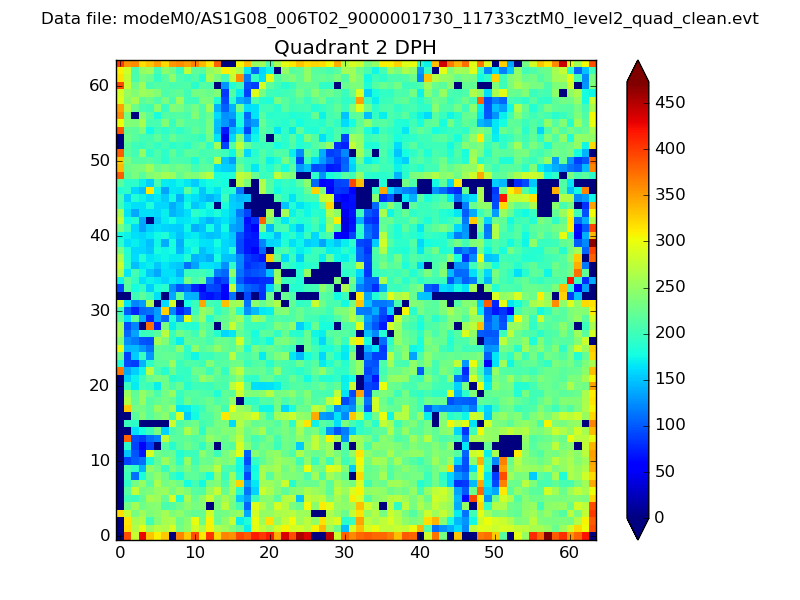 |
Quadrant C |
| Plot type | Count rate plots | Images |
|---|---|---|
| Comparison with Poisson distribution Blue bars denote a histogram of data divided into 1 sec bins. Red curve is a Poisson curve with rate = median count rate of data. |
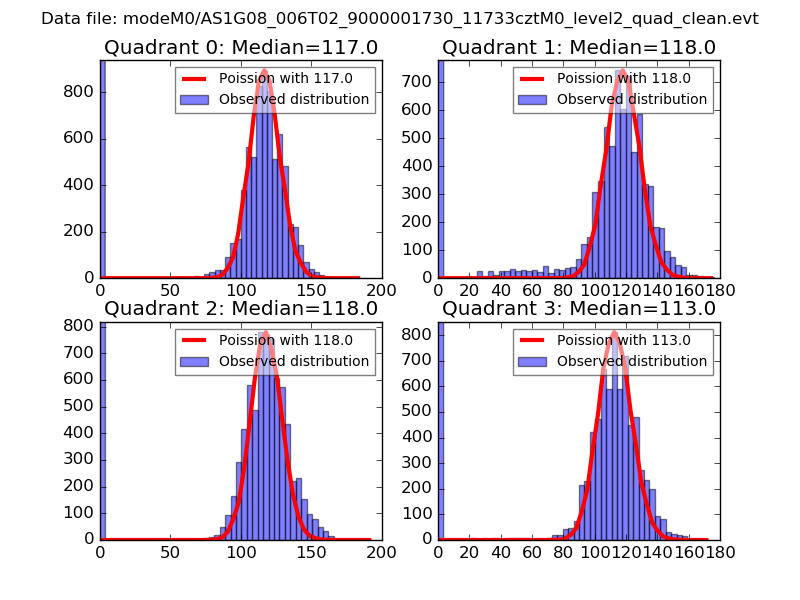 |
 |
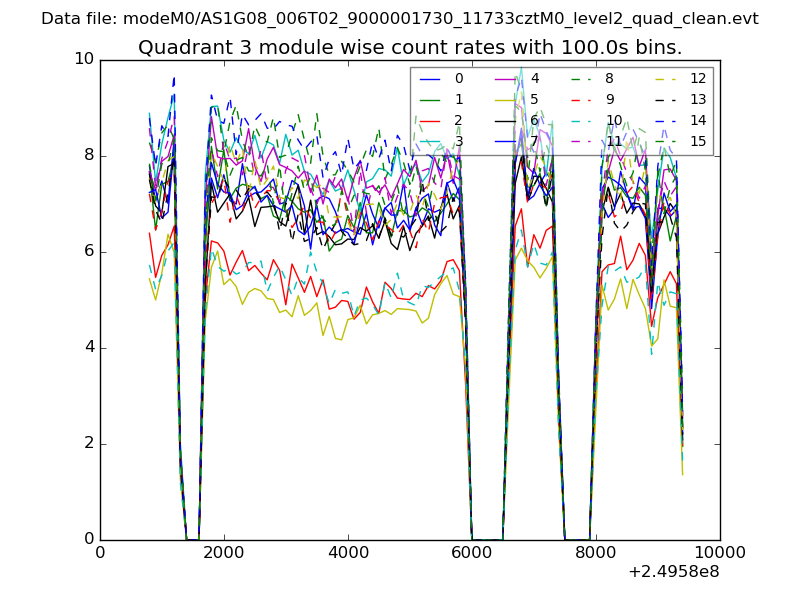
| Quadrant-wise count rates Data is divided into 100 sec bins |
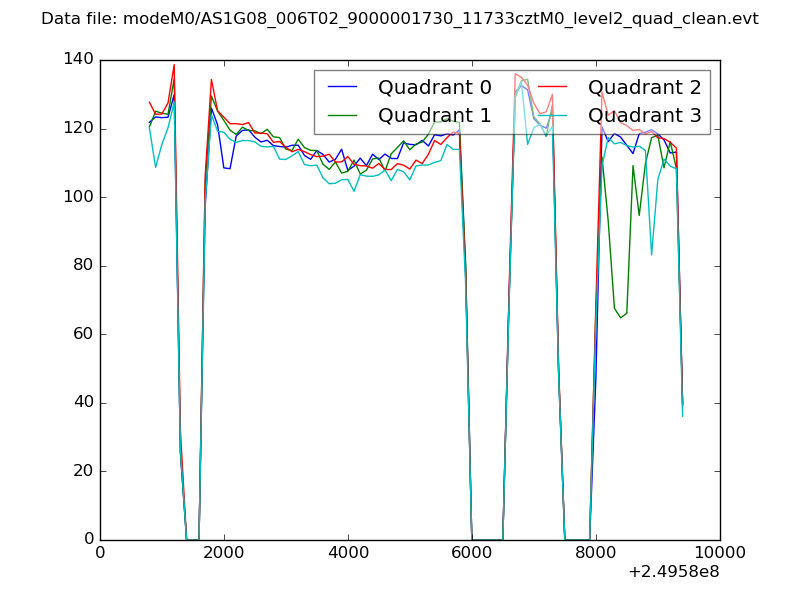 |
|
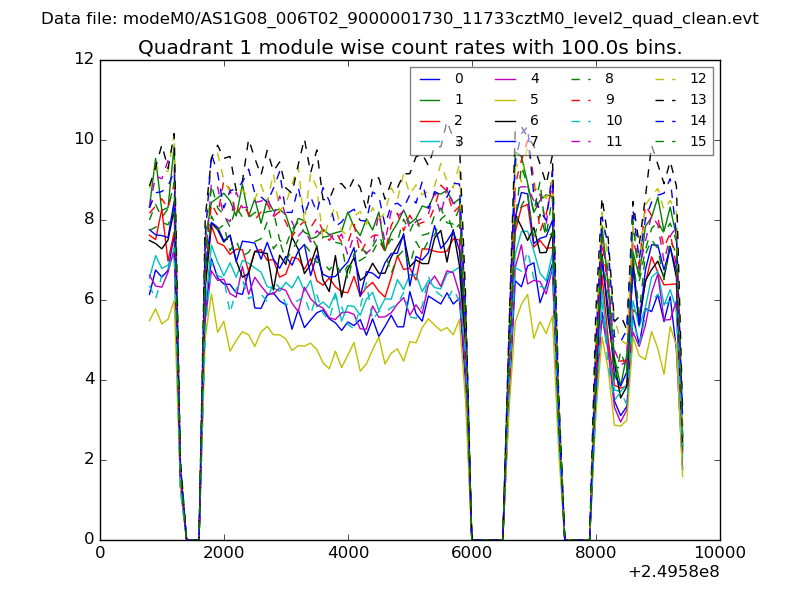
| Module-wise count rates for Quadrant A Data is divided into 100 sec bins |
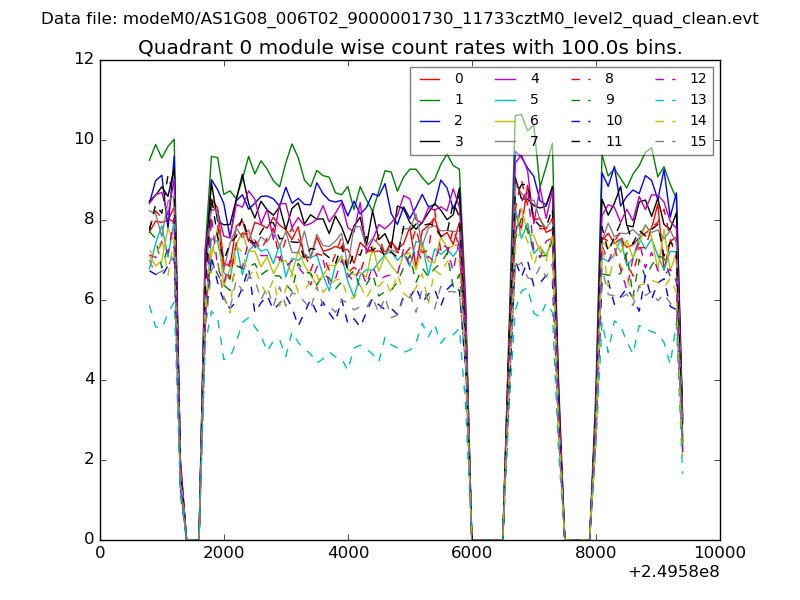 |
 |
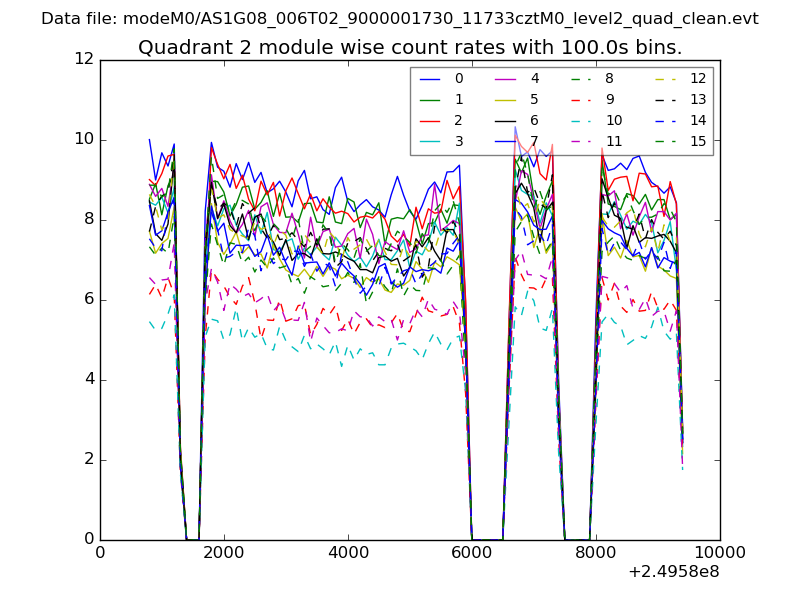
| Module-wise count rates for Quadrant B Data is divided into 100 sec bins |
 |
 |
| Module-wise count rates for Quadrant C Data is divided into 100 sec bins |
 |
 |
| Module-wise count rates for Quadrant D Data is divided into 100 sec bins |
 |
 |
| Parameter | Plot |
|---|---|
| CZT HV Monitor | 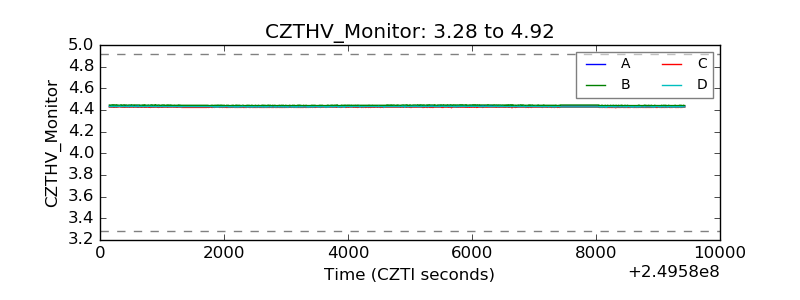 |
| D_VDD | 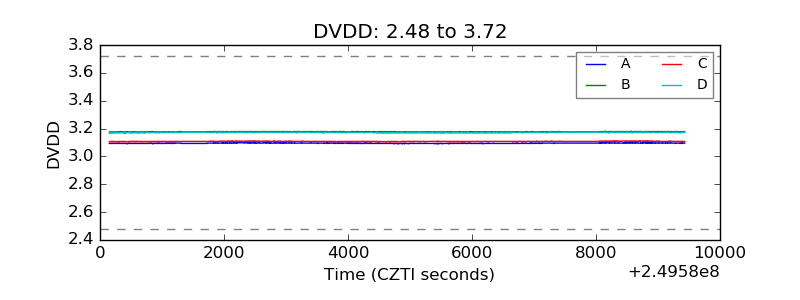 |
| Temperature 1 | 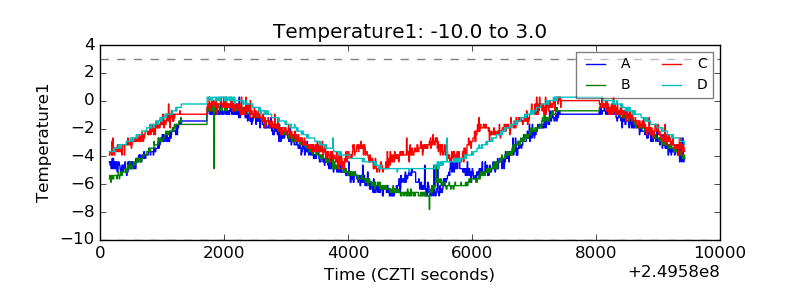 |
| Veto HV Monitor | 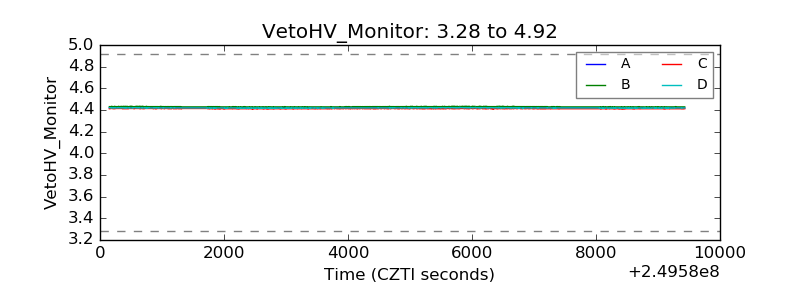 |
| Veto LLD | 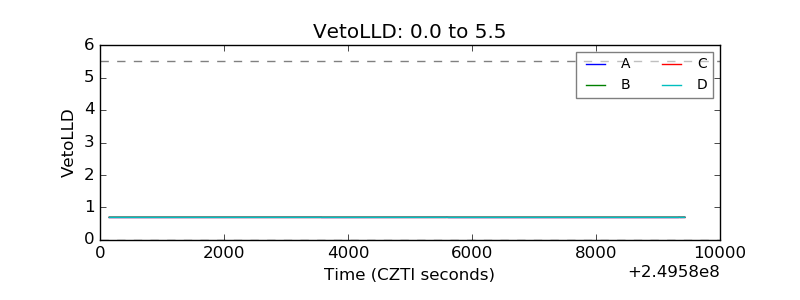 |
| Alpha Counter | 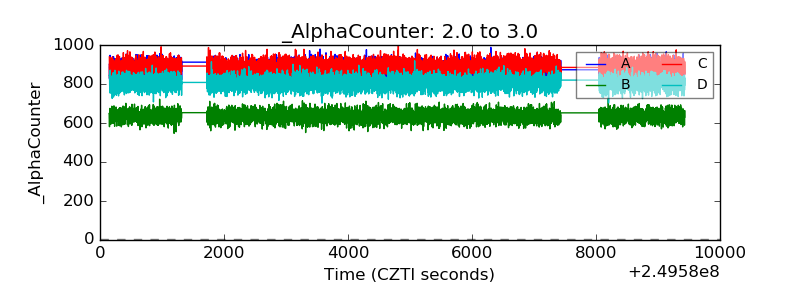 |
| _CPM_Rate | 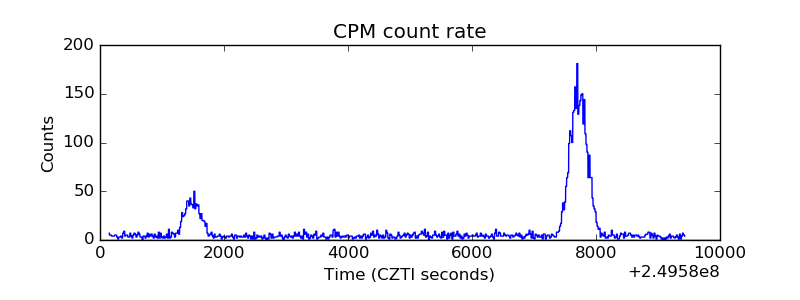 |
| CZT Counter | 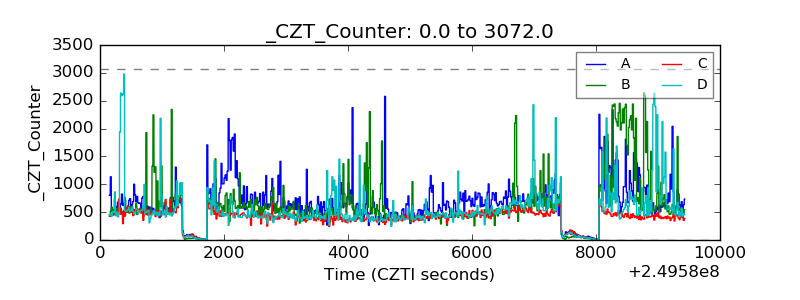 |
| +2.5 Volts monitor |  |
| +5 Volts monitor | 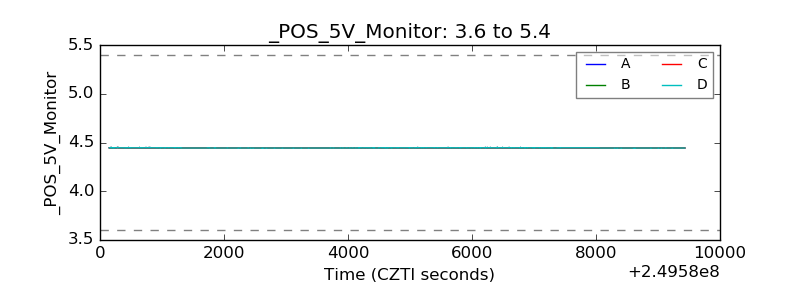 |
| _ROLL_ROT | 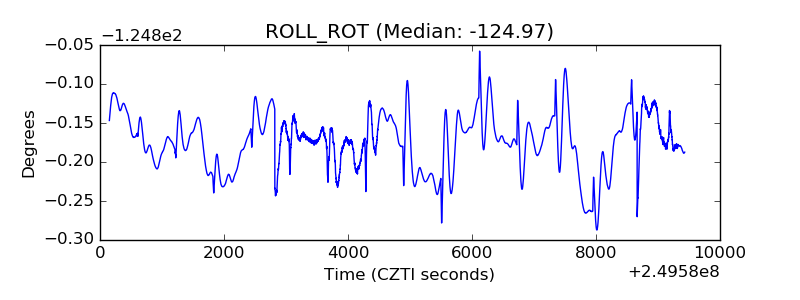 |
| _Roll_DEC | 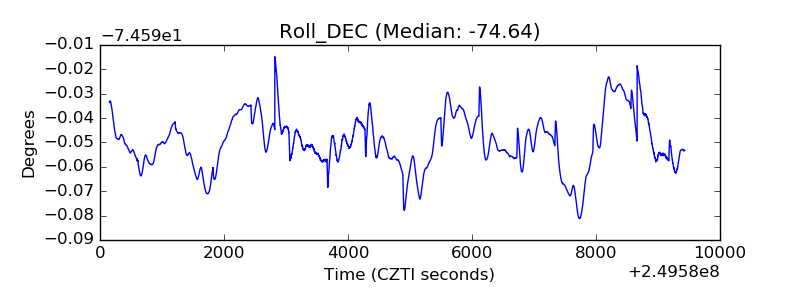 |
| _Roll_RA | 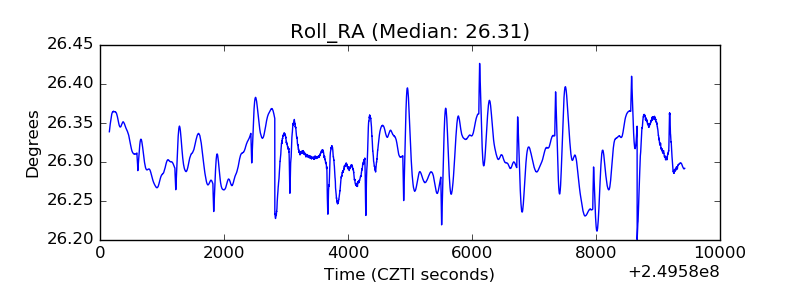 |
| Veto Counter | 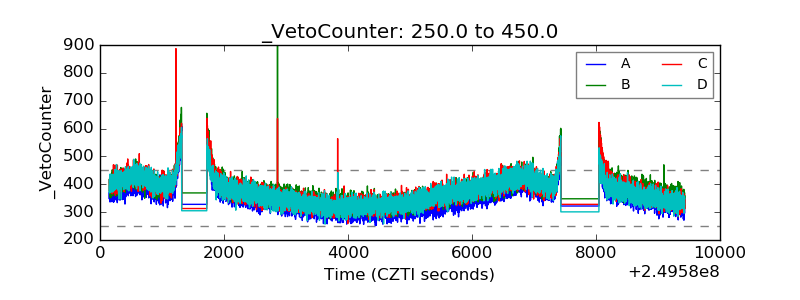 |