| Param | Original file | Final file |
|---|---|---|
| Filename | modeM0/AS1G08_006T03_9000001732cztM0_level2.fits | modeM0/AS1G08_006T03_9000001732cztM0_level2_quad_clean.evt |
| Size (bytes) | 371,041,920 | 385,392,960 |
| Size | 353.9 MB | 367.5 MB |
| Events in quadrant A | 2,243,164 | 2,354,895 |
| Events in quadrant B | 2,138,721 | 2,289,929 |
| Events in quadrant C | 2,282,894 | 2,312,923 |
| Events in quadrant D | 1,949,192 | 2,091,095 |
| Mode M0 | |||
|---|---|---|---|
| Quadrant | BADHDUFLAG | Total packets | Discarded packets |
| A | 0 | 89629 | 0 |
| B | 0 | 105459 | 0 |
| C | 0 | 77647 | 0 |
| D | 0 | 91623 | 0 |
| Mode M9 | |||
|---|---|---|---|
| Quadrant | BADHDUFLAG | Total packets | Discarded packets |
| A | 0 | 80 | 0 |
| B | 0 | 80 | 0 |
| C | 0 | 80 | 0 |
| D | 0 | 80 | 0 |
| Mode SS | |||
|---|---|---|---|
| Quadrant | BADHDUFLAG | Total packets | Discarded packets |
| A | 0 | 778 | 0 |
| B | 0 | 778 | 0 |
| C | 0 | 778 | 0 |
| D | 0 | 778 | 0 |
| Quadrant | Total seconds | Saturated seconds | Saturation percentage |
|---|---|---|---|
| A | 38184 | 451 | 1.181123% |
| B | 38172 | 2428 | 6.360683% |
| C | 38185 | 102 | 0.267121% |
| D | 38177 | 581 | 1.521859% |
Noise dominated data is calculated using 1-second bins in cleaned event files. If a bin has >2000 counts, and if more than 50% of those come from <1% of pixels, then it is considered to be noise-dominated and hence unusable.
| Quadrant | # 1 sec bins | Bins with >0 counts | Bins with >2000 counts | High rate bins dominated by noise | Noise dominated (total time) | Noise dominated (detector-on time) | Marked lightcurve |
|---|---|---|---|---|---|---|---|
| A | 46288 | 38191 | 0 | 0 | 0.00% | 0.00% | 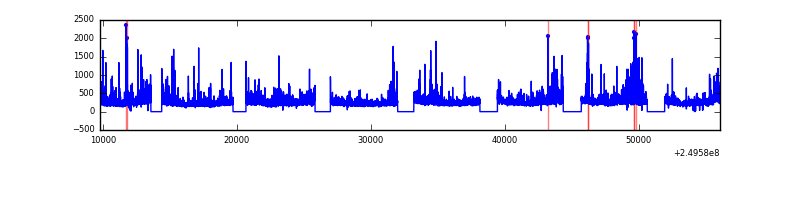 |
| B | 46288 | 38173 | 0 | 0 | 0.00% | 0.00% |  |
| C | 46288 | 38191 | 0 | 0 | 0.00% | 0.00% | 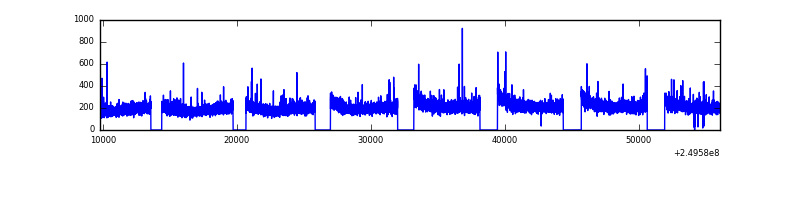 |
| D | 46288 | 38191 | 0 | 0 | 0.00% | 0.00% | 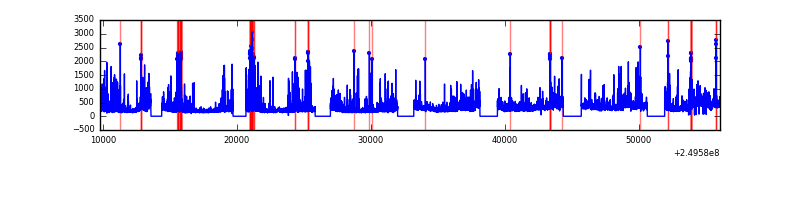 |
Top three noisy pixels from each quadrant. If the there are fewer than three noisy pixels in the level2.evt file, extra rows are filled as -1
| Pixel properties | Quadrant properties | ||||||
|---|---|---|---|---|---|---|---|
| Quadrant | DetID | PixID | Counts | Sigma | Mean | Median | Sigma |
| A | 0 | 29 | 2228 | 11.64 | 585 | 555 | 143.8 |
| A | 7 | 110 | 1923 | 9.51 | 585 | 555 | 143.8 |
| A | 9 | 19 | 1749 | 8.3 | 585 | 555 | 143.8 |
| B | 2 | 9 | 1828 | 11.63 | 565 | 543 | 110.5 |
| B | 3 | 17 | 1503 | 8.69 | 565 | 543 | 110.5 |
| B | 12 | 226 | 1399 | 7.75 | 565 | 543 | 110.5 |
| C | 1 | 81 | 1743 | 7.49 | 603 | 566 | 157.2 |
| C | 1 | 80 | 1689 | 7.14 | 603 | 566 | 157.2 |
| C | 1 | 65 | 1592 | 6.52 | 603 | 566 | 157.2 |
| D | 3 | 14 | 1419 | 6.19 | 556 | 509 | 147.0 |
| D | 6 | 67 | 1398 | 6.05 | 556 | 509 | 147.0 |
| D | 7 | 3 | 1396 | 6.03 | 556 | 509 | 147.0 |
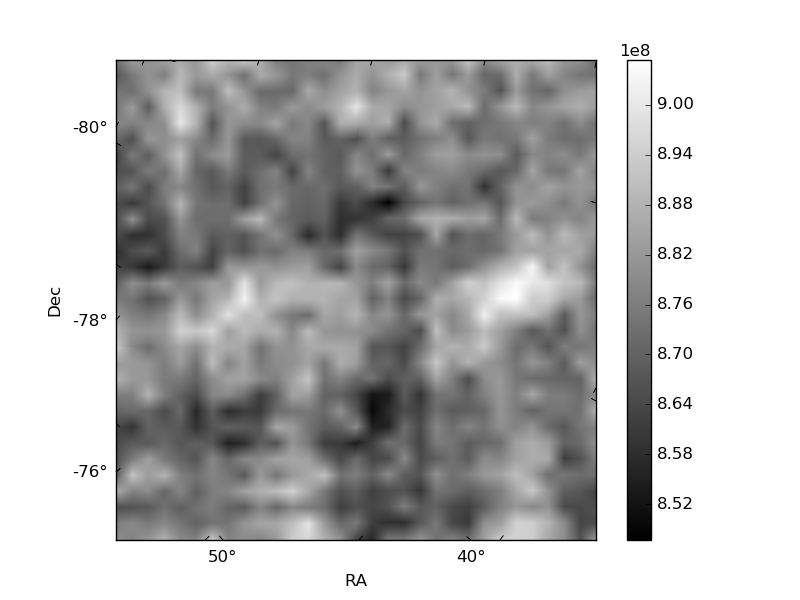
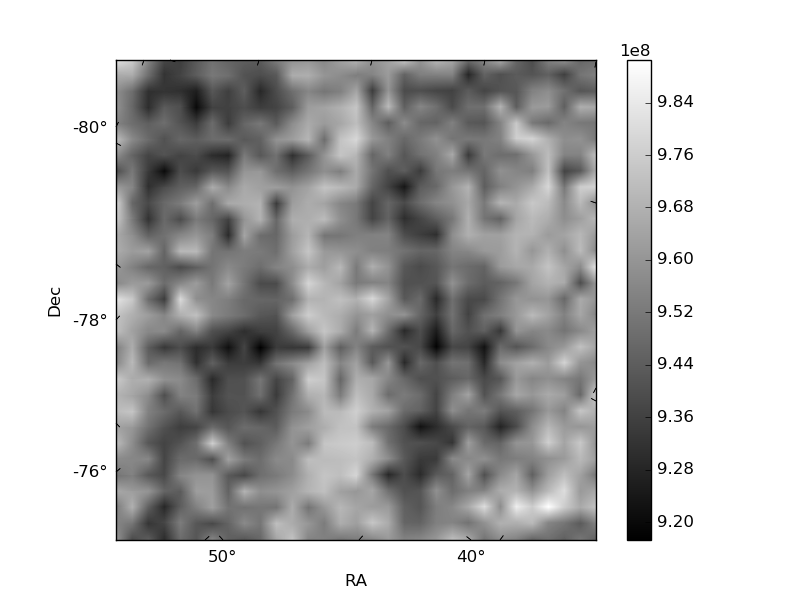
Histogram calculated using DETX and DETY for each event in the final _common_clean file
| Quadrant A | 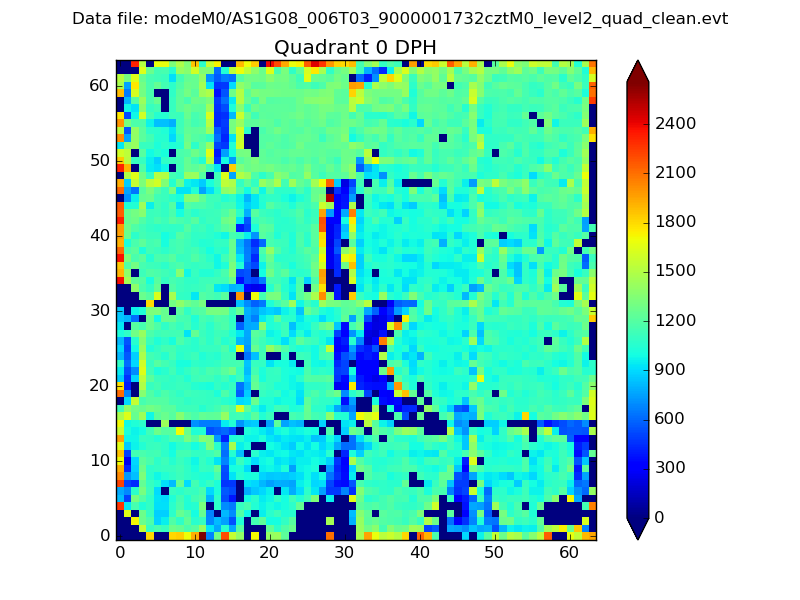 |
 |
Quadrant B |
|---|---|---|---|
| Quadrant D |  |
 |
Quadrant C |
| Plot type | Count rate plots | Images |
|---|---|---|
| Comparison with Poisson distribution Blue bars denote a histogram of data divided into 1 sec bins. Red curve is a Poisson curve with rate = median count rate of data. |
 |
 |
| Quadrant-wise count rates Data is divided into 100 sec bins |
 |
|
| Module-wise count rates for Quadrant A Data is divided into 100 sec bins |
 |
 |
| Module-wise count rates for Quadrant B Data is divided into 100 sec bins |
 |
 |
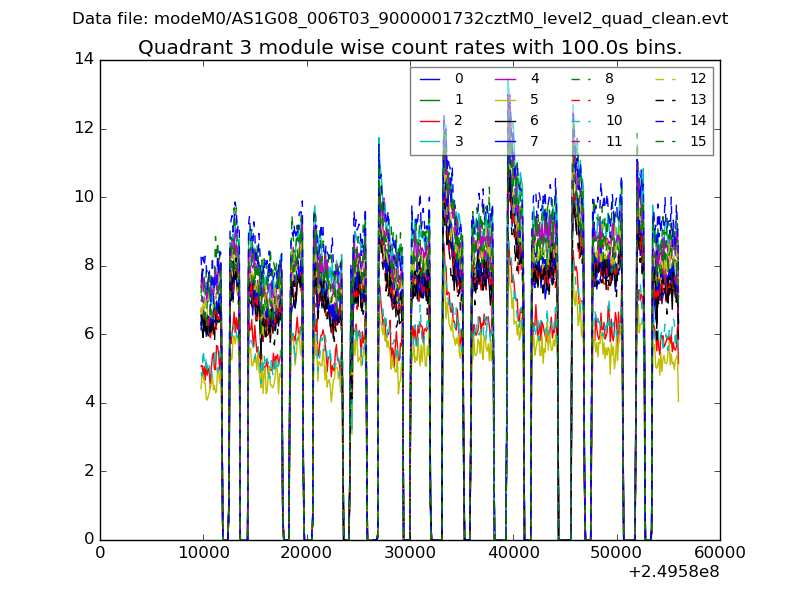
| Module-wise count rates for Quadrant C Data is divided into 100 sec bins |
 |
 |
| Module-wise count rates for Quadrant D Data is divided into 100 sec bins |
 |
 |
| Parameter | Plot |
|---|---|
| CZT HV Monitor |  |
| D_VDD | 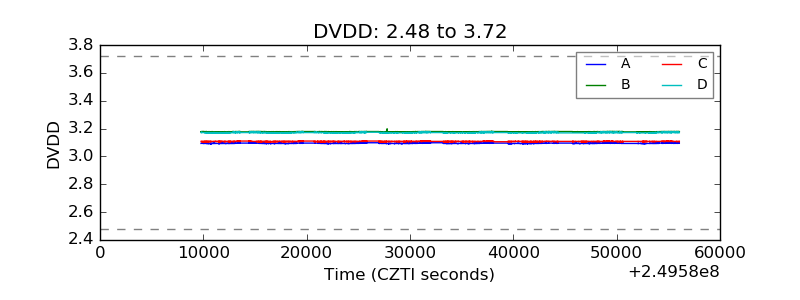 |
| Temperature 1 |  |
| Veto HV Monitor |  |
| Veto LLD |  |
| Alpha Counter |  |
| _CPM_Rate | 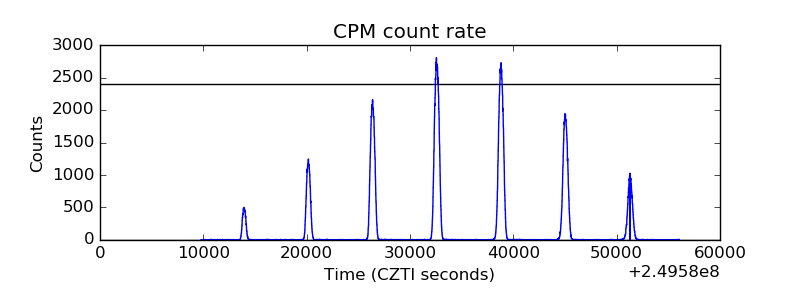 |
| CZT Counter |  |
| +2.5 Volts monitor |  |
| +5 Volts monitor |  |
| _ROLL_ROT |  |
| _Roll_DEC |  |
| _Roll_RA |  |
| Veto Counter |  |