| Param | Original file | Final file |
|---|---|---|
| Filename | modeM0/AS1G08_006T03_9000001732_11733cztM0_level2.evt | modeM0/AS1G08_006T03_9000001732_11733cztM0_level2_quad_clean.evt |
| Size (bytes) | 799,358,400 | 169,009,920 |
| Size | 762.3 MB | 161.2 MB |
| Events in quadrant A | 5,870,652 | 1,107,040 |
| Events in quadrant B | 6,976,499 | 1,110,052 |
| Events in quadrant C | 4,649,733 | 1,105,301 |
| Events in quadrant D | 5,984,794 | 1,052,825 |
| Mode M0 | |||
|---|---|---|---|
| Quadrant | BADHDUFLAG | Total packets | Discarded packets |
| A | 0 | 24731 | 3 |
| B | 0 | 27998 | 2 |
| C | 0 | 21613 | 2 |
| D | 0 | 25285 | 2 |
| Mode M9 | |||
|---|---|---|---|
| Quadrant | BADHDUFLAG | Total packets | Discarded packets |
| A | 0 | 17 | 0 |
| B | 0 | 17 | 0 |
| C | 0 | 17 | 0 |
| D | 0 | 17 | 0 |
| Mode SS | |||
|---|---|---|---|
| Quadrant | BADHDUFLAG | Total packets | Discarded packets |
| A | 0 | 220 | 0 |
| B | 0 | 220 | 0 |
| C | 0 | 220 | 0 |
| D | 0 | 220 | 0 |
| Quadrant | Total seconds | Saturated seconds | Saturation percentage |
|---|---|---|---|
| A | 10735 | 134 | 1.248253% |
| B | 10735 | 481 | 4.480671% |
| C | 10735 | 24 | 0.223568% |
| D | 10735 | 190 | 1.769912% |
Noise dominated data is calculated using 1-second bins in cleaned event files. If a bin has >2000 counts, and if more than 50% of those come from <1% of pixels, then it is considered to be noise-dominated and hence unusable.
| Quadrant | # 1 sec bins | Bins with >0 counts | Bins with >2000 counts | High rate bins dominated by noise | Noise dominated (total time) | Noise dominated (detector-on time) | Marked lightcurve |
|---|---|---|---|---|---|---|---|
| A | 12516 | 10738 | 35 | 35 | 0.28% | 0.33% | 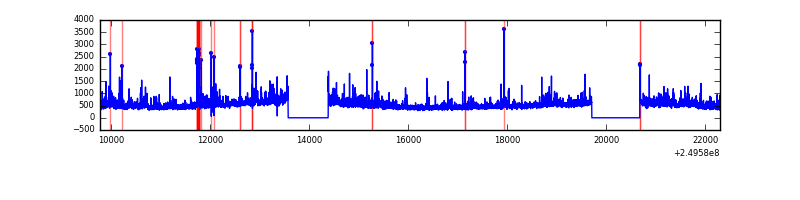 |
| B | 12516 | 10737 | 245 | 245 | 1.96% | 2.28% | 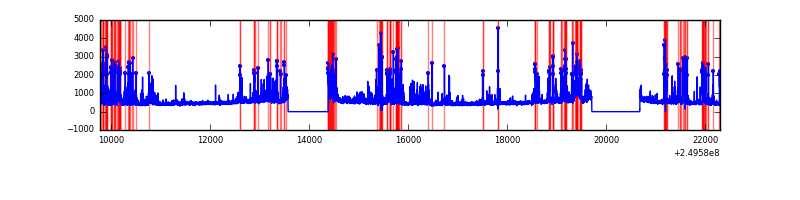 |
| C | 12516 | 10738 | 0 | 0 | 0.00% | 0.00% | 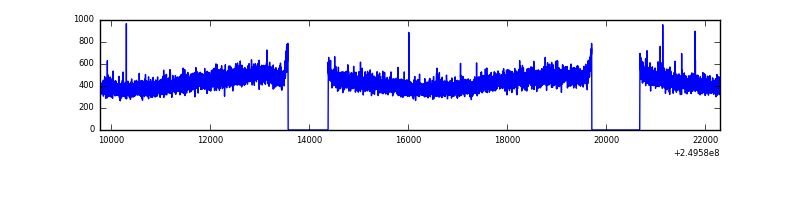 |
| D | 12516 | 10738 | 159 | 159 | 1.27% | 1.48% | 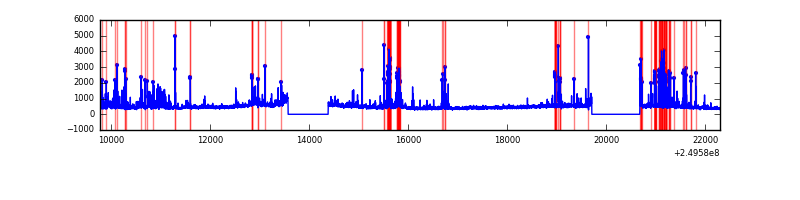 |
Top three noisy pixels from each quadrant. If the there are fewer than three noisy pixels in the level2.evt file, extra rows are filled as -1
| Pixel properties | Quadrant properties | ||||||
|---|---|---|---|---|---|---|---|
| Quadrant | DetID | PixID | Counts | Sigma | Mean | Median | Sigma |
| A | 8 | 15 | 417427 | 1682.54 | 1217 | 1189 | 247.4 |
| A | 9 | 143 | 216916 | 872.02 | 1217 | 1189 | 247.4 |
| A | 1 | 162 | 154812 | 620.98 | 1217 | 1189 | 247.4 |
| B | 4 | 239 | 1165188 | 5105.58 | 1218 | 1189 | 228.0 |
| B | 3 | 64 | 545421 | 2387.13 | 1218 | 1189 | 228.0 |
| B | 15 | 204 | 232816 | 1015.97 | 1218 | 1189 | 228.0 |
| C | 13 | 61 | 8916 | 28.09 | 1190 | 1196 | 274.9 |
| C | 12 | 4 | 5100 | 14.2 | 1190 | 1196 | 274.9 |
| C | 8 | 222 | 4213 | 10.98 | 1190 | 1196 | 274.9 |
| D | 1 | 52 | 394199 | 1400.93 | 1172 | 1139 | 280.6 |
| D | 8 | 195 | 380741 | 1352.97 | 1172 | 1139 | 280.6 |
| D | 10 | 253 | 214411 | 760.14 | 1172 | 1139 | 280.6 |
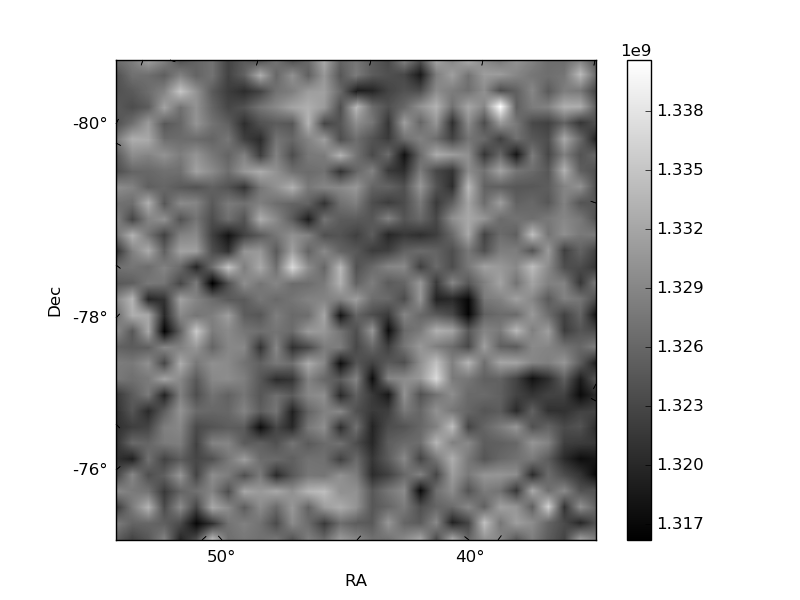
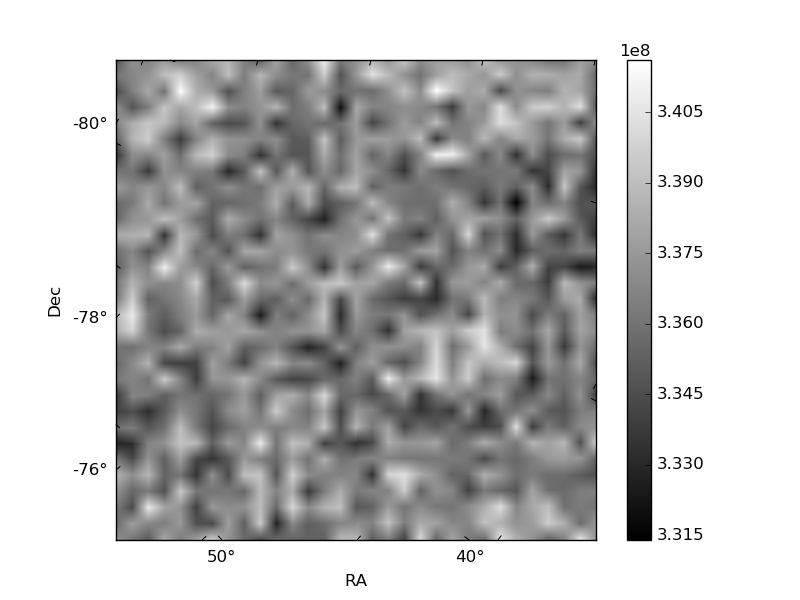
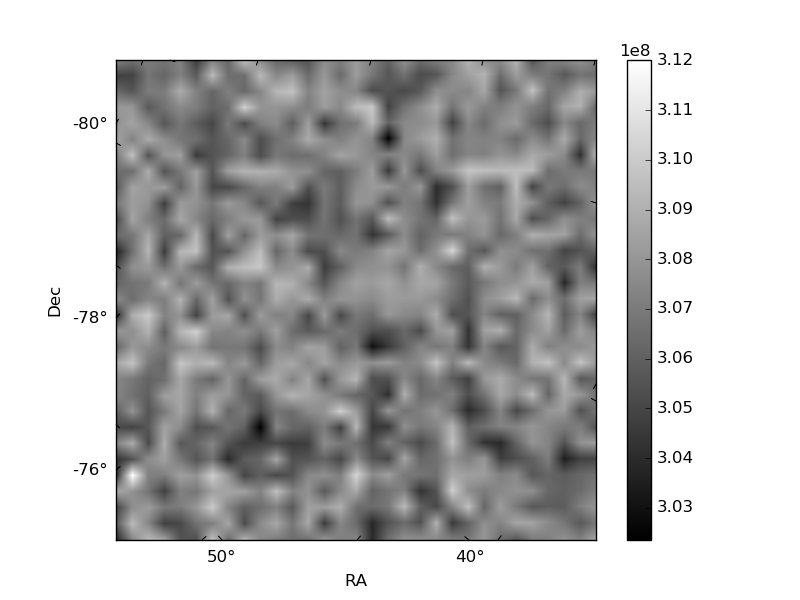
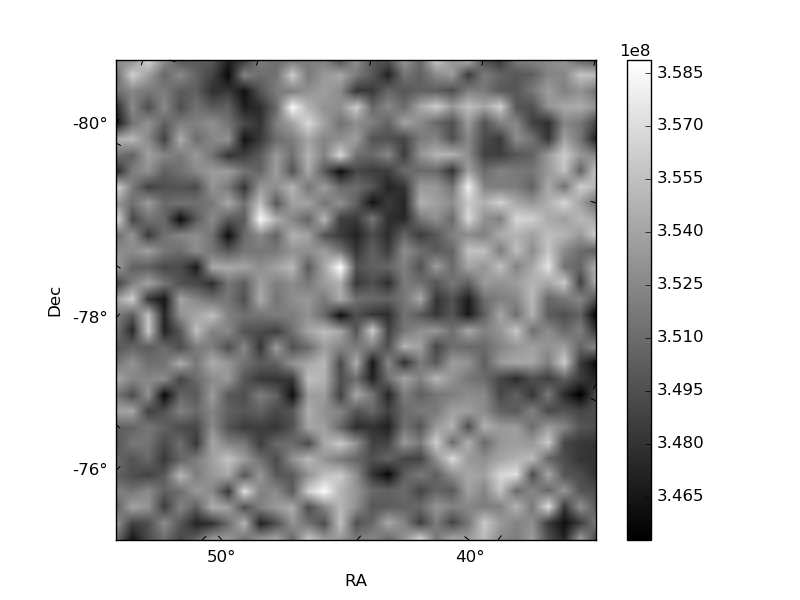
Histogram calculated using DETX and DETY for each event in the final _common_clean file
| Quadrant A | 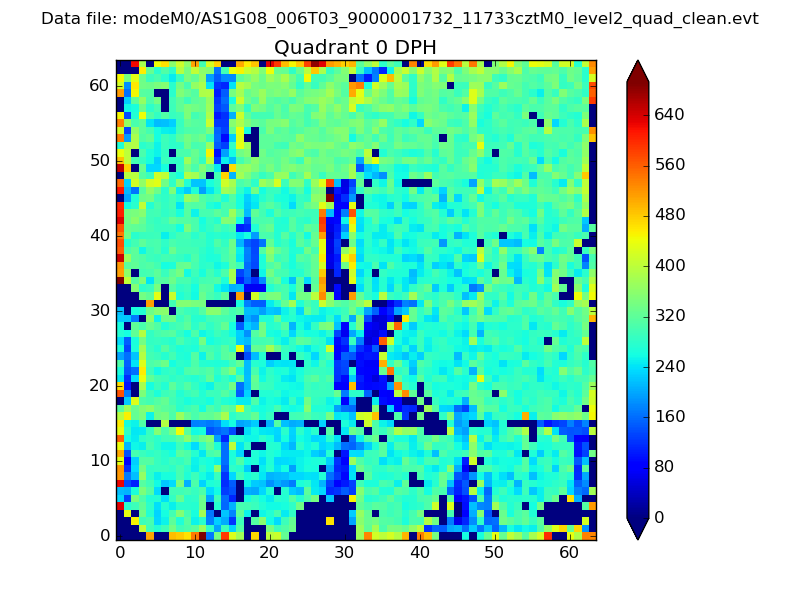 |
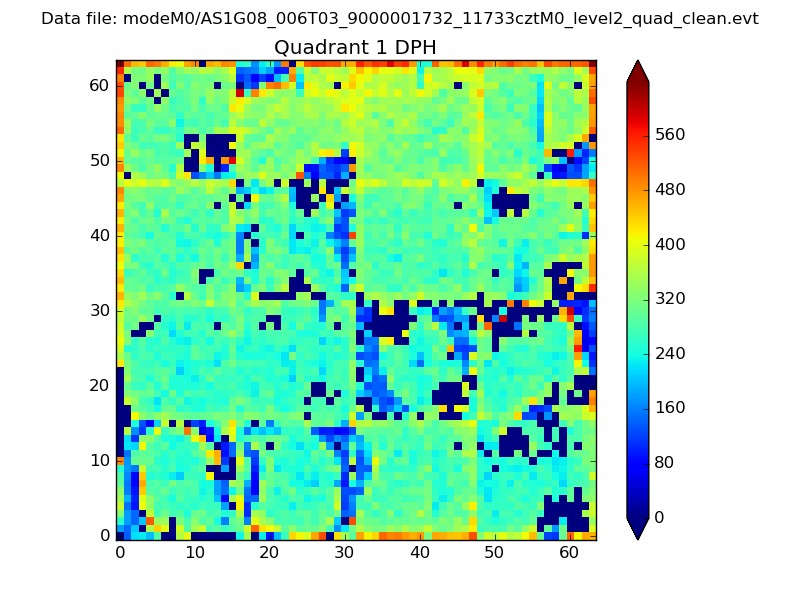 |
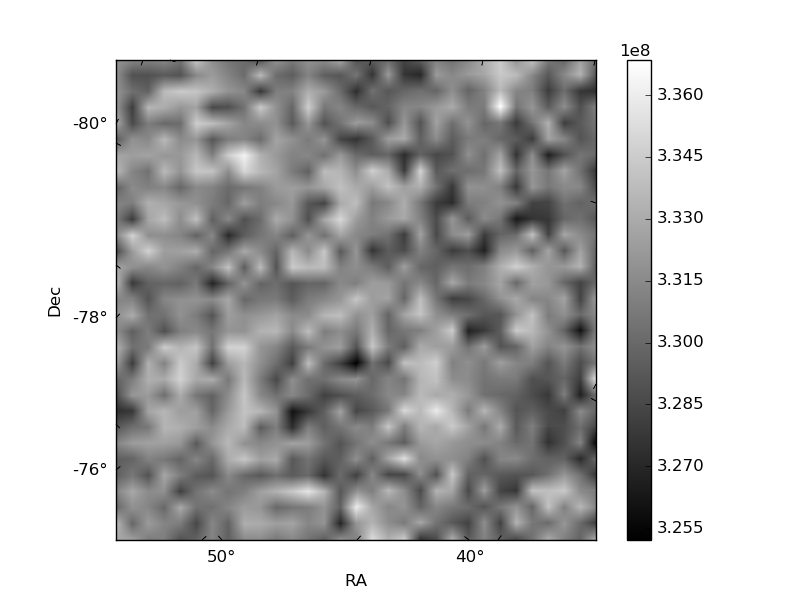
Quadrant B |
|---|---|---|---|
| Quadrant D | 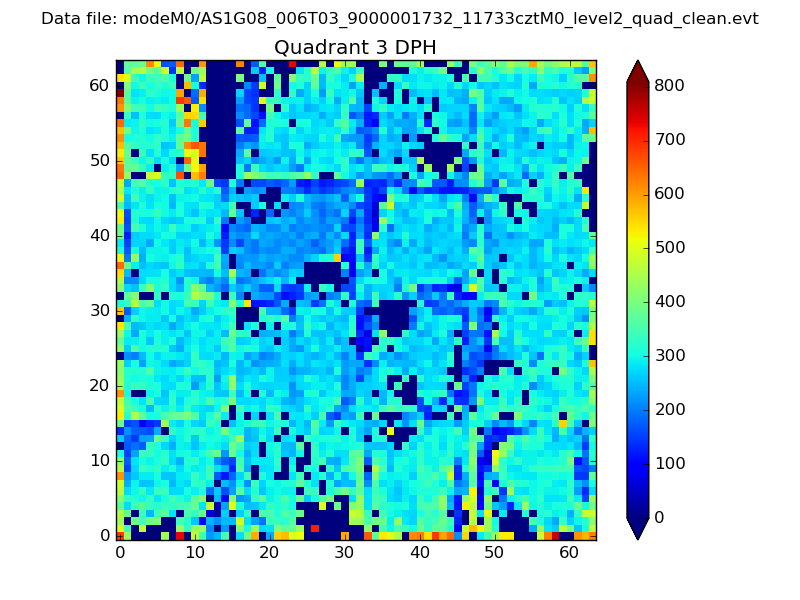 |
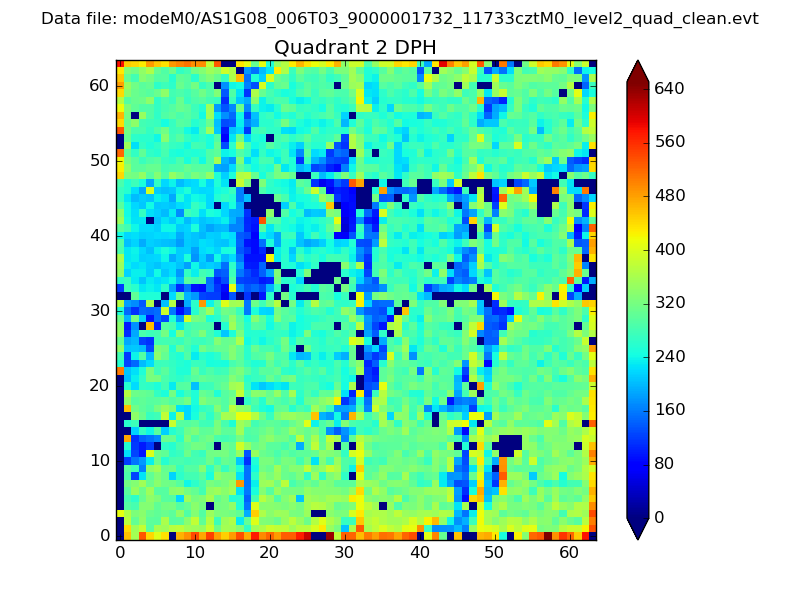 |
Quadrant C |
| Plot type | Count rate plots | Images |
|---|---|---|
| Comparison with Poisson distribution Blue bars denote a histogram of data divided into 1 sec bins. Red curve is a Poisson curve with rate = median count rate of data. |
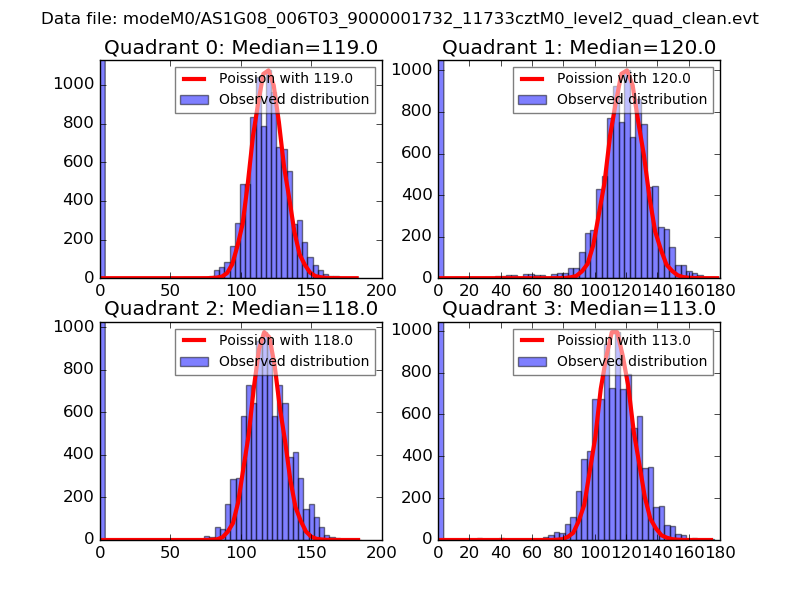 |
 |
| Quadrant-wise count rates Data is divided into 100 sec bins |
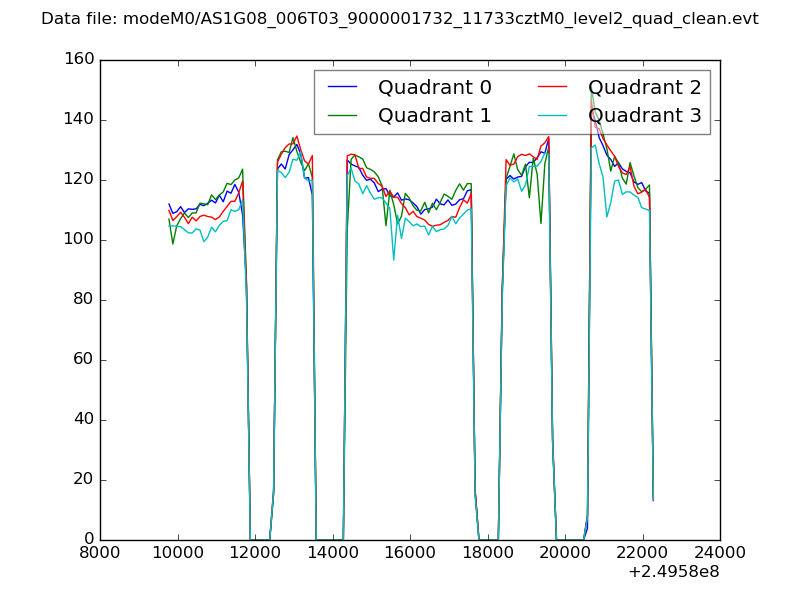 |
|
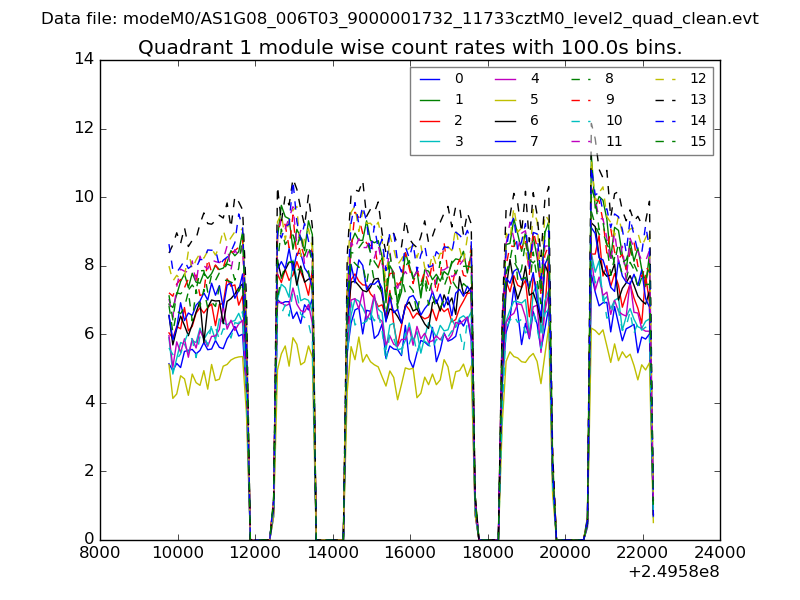
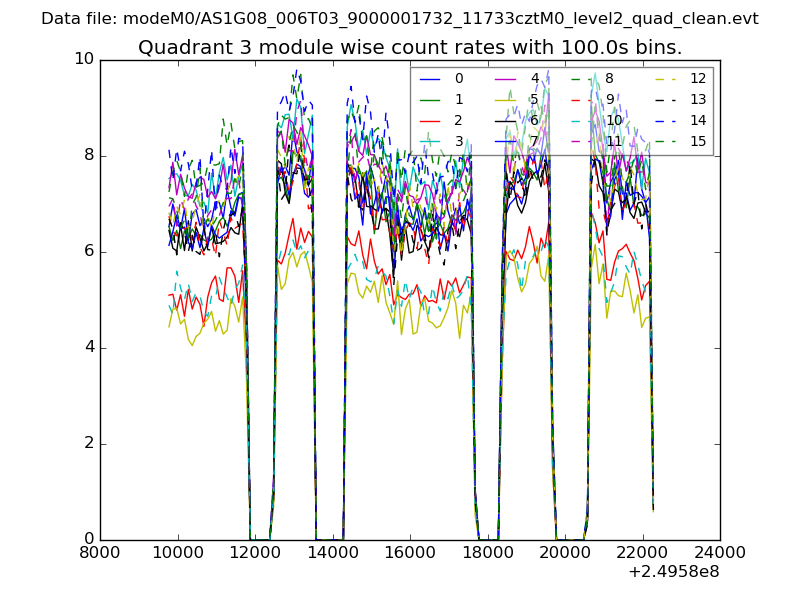
| Module-wise count rates for Quadrant A Data is divided into 100 sec bins |
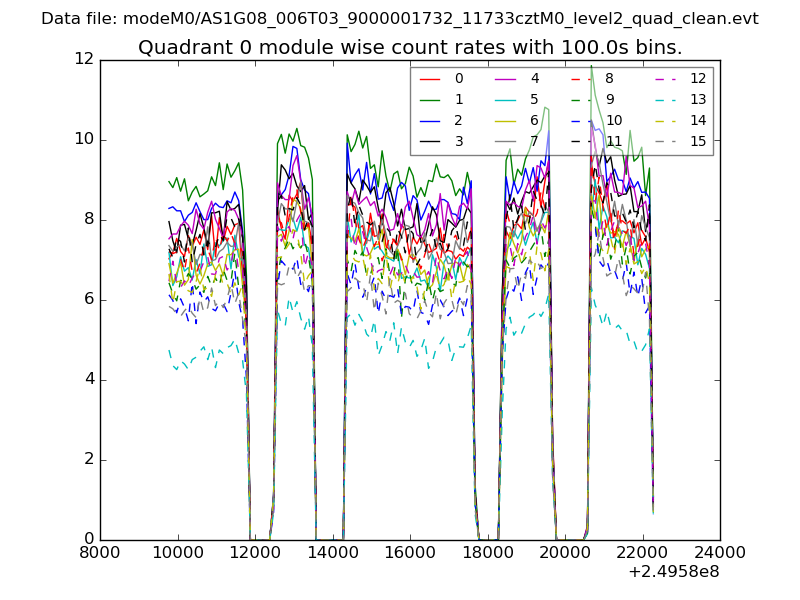 |
 |
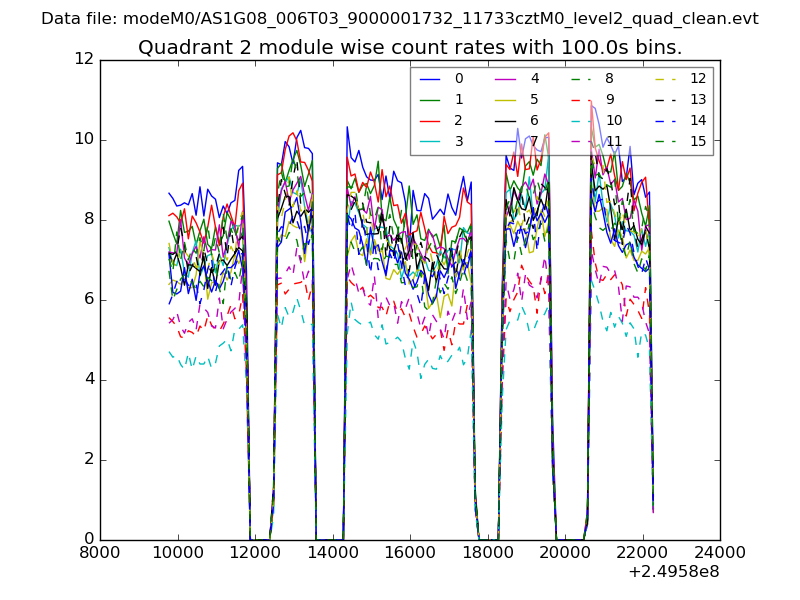
| Module-wise count rates for Quadrant B Data is divided into 100 sec bins |
 |
 |
| Module-wise count rates for Quadrant C Data is divided into 100 sec bins |
 |
 |
| Module-wise count rates for Quadrant D Data is divided into 100 sec bins |
 |
 |
| Parameter | Plot |
|---|---|
| CZT HV Monitor | 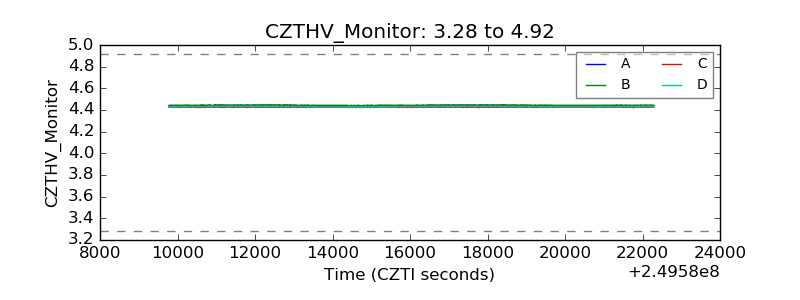 |
| D_VDD | 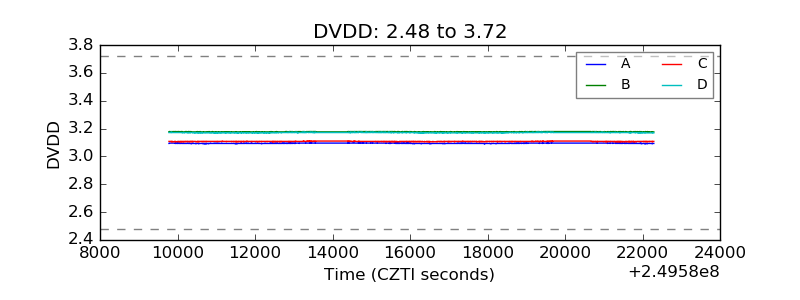 |
| Temperature 1 | 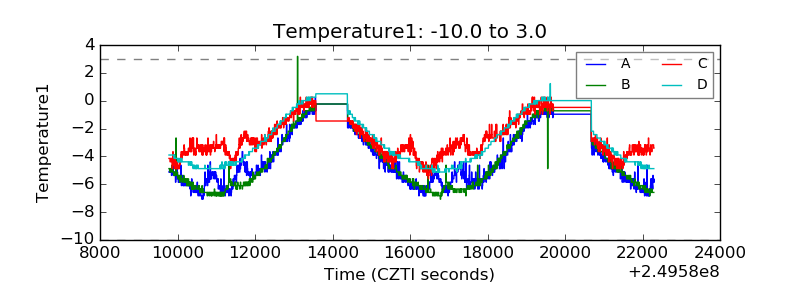 |
| Veto HV Monitor | 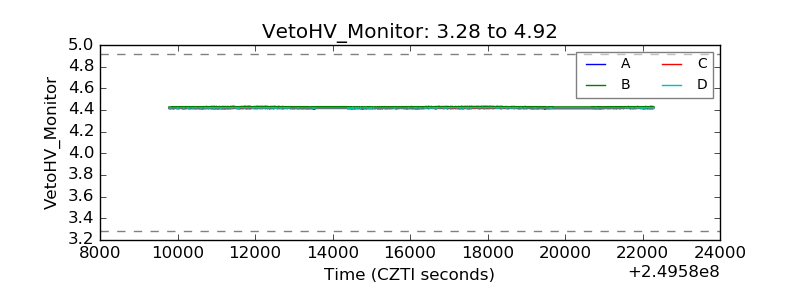 |
| Veto LLD | 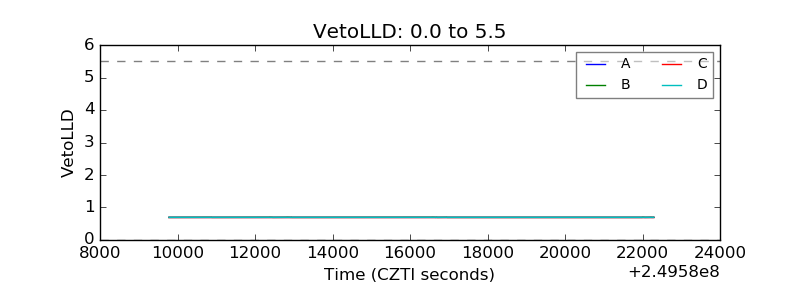 |
| Alpha Counter | 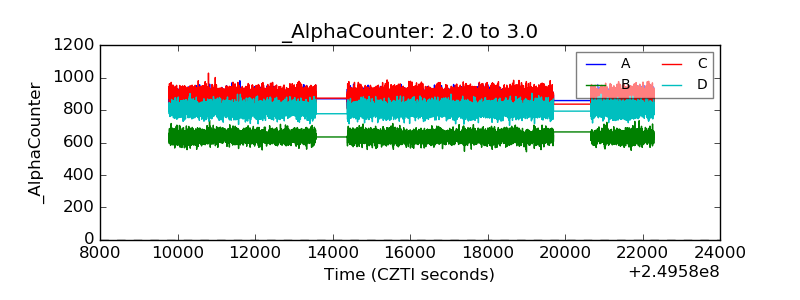 |
| _CPM_Rate |  |
| CZT Counter | 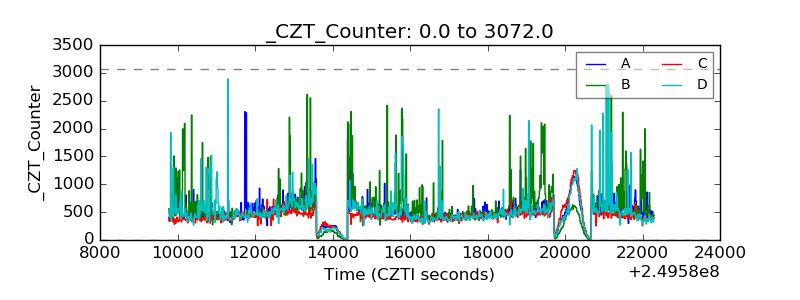 |
| +2.5 Volts monitor |  |
| +5 Volts monitor |  |
| _ROLL_ROT | 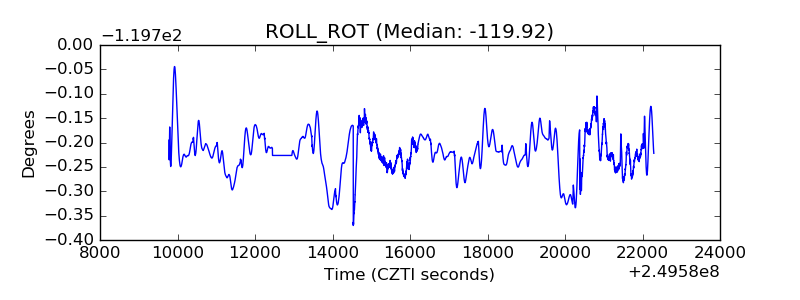 |
| _Roll_DEC | 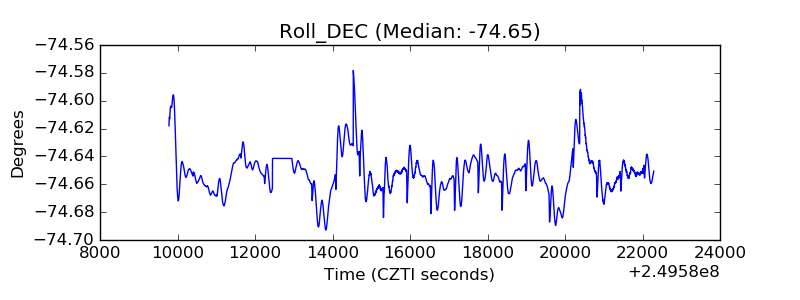 |
| _Roll_RA | 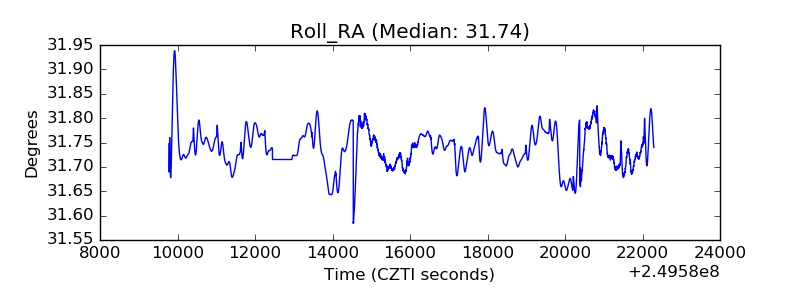 |
| Veto Counter | 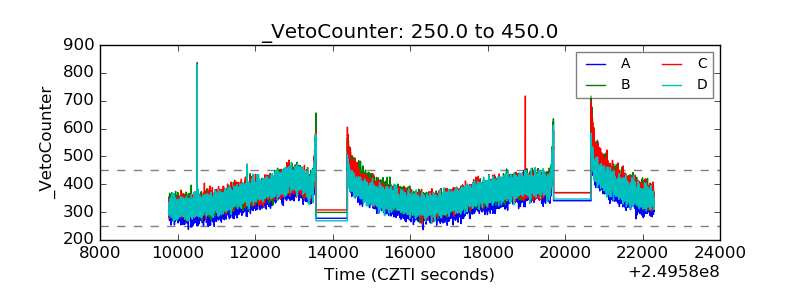 |