| Param | Original file | Final file |
|---|---|---|
| Filename | modeM0/AS1G08_006T03_9000001732_11735cztM0_level2.evt | modeM0/AS1G08_006T03_9000001732_11735cztM0_level2_quad_clean.evt |
| Size (bytes) | 497,468,160 | 111,965,760 |
| Size | 474.4 MB | 106.8 MB |
| Events in quadrant A | 3,733,276 | 739,307 |
| Events in quadrant B | 4,154,722 | 748,165 |
| Events in quadrant C | 2,938,195 | 745,827 |
| Events in quadrant D | 3,790,150 | 696,062 |
| Mode M0 | |||
|---|---|---|---|
| Quadrant | BADHDUFLAG | Total packets | Discarded packets |
| A | 0 | 15451 | 3 |
| B | 0 | 16883 | 2 |
| C | 0 | 13338 | 2 |
| D | 0 | 15879 | 2 |
| Mode M9 | |||
|---|---|---|---|
| Quadrant | BADHDUFLAG | Total packets | Discarded packets |
| A | 0 | 13 | 0 |
| B | 0 | 13 | 0 |
| C | 0 | 13 | 0 |
| D | 0 | 14 | 0 |
| Mode SS | |||
|---|---|---|---|
| Quadrant | BADHDUFLAG | Total packets | Discarded packets |
| A | 0 | 136 | 0 |
| B | 0 | 136 | 0 |
| C | 0 | 136 | 0 |
| D | 0 | 136 | 0 |
| Quadrant | Total seconds | Saturated seconds | Saturation percentage |
|---|---|---|---|
| A | 6615 | 91 | 1.375661% |
| B | 6615 | 237 | 3.582766% |
| C | 6615 | 6 | 0.090703% |
| D | 6615 | 226 | 3.416478% |
Noise dominated data is calculated using 1-second bins in cleaned event files. If a bin has >2000 counts, and if more than 50% of those come from <1% of pixels, then it is considered to be noise-dominated and hence unusable.
| Quadrant | # 1 sec bins | Bins with >0 counts | Bins with >2000 counts | High rate bins dominated by noise | Noise dominated (total time) | Noise dominated (detector-on time) | Marked lightcurve |
|---|---|---|---|---|---|---|---|
| A | 7761 | 6617 | 7 | 7 | 0.09% | 0.11% | 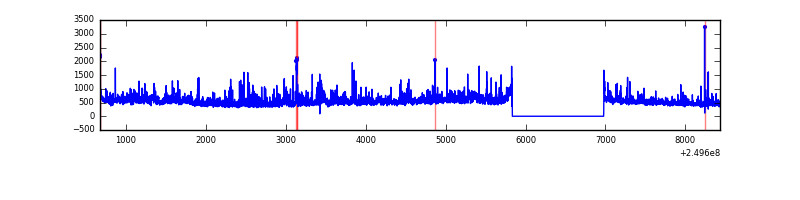 |
| B | 7761 | 6616 | 127 | 127 | 1.64% | 1.92% | 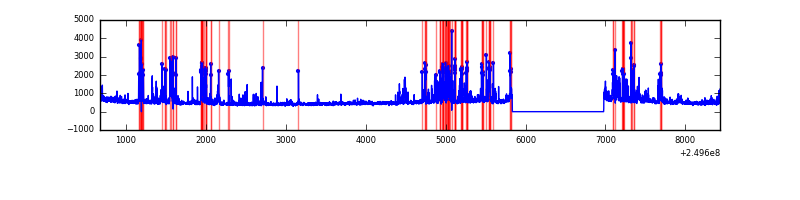 |
| C | 7761 | 6617 | 0 | 0 | 0.00% | 0.00% | 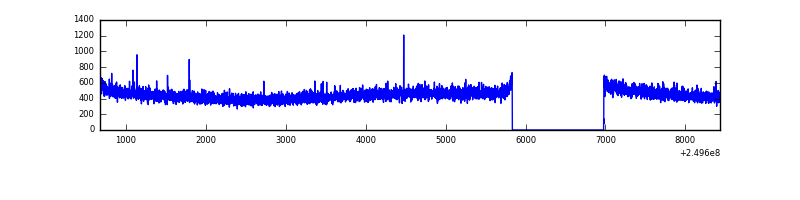 |
| D | 7761 | 6617 | 171 | 171 | 2.20% | 2.58% | 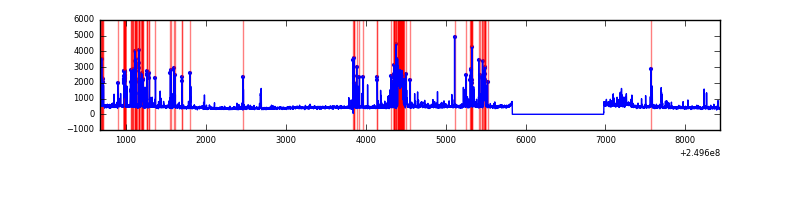 |
Top three noisy pixels from each quadrant. If the there are fewer than three noisy pixels in the level2.evt file, extra rows are filled as -1
| Pixel properties | Quadrant properties | ||||||
|---|---|---|---|---|---|---|---|
| Quadrant | DetID | PixID | Counts | Sigma | Mean | Median | Sigma |
| A | 8 | 15 | 324442 | 2093.04 | 762 | 746 | 154.7 |
| A | 1 | 162 | 155570 | 1001.1 | 762 | 746 | 154.7 |
| A | 1 | 178 | 93716 | 601.15 | 762 | 746 | 154.7 |
| B | 4 | 239 | 713961 | 4926.41 | 769 | 750 | 144.8 |
| B | 3 | 64 | 201165 | 1384.34 | 769 | 750 | 144.8 |
| B | 15 | 204 | 139078 | 955.48 | 769 | 750 | 144.8 |
| C | 13 | 61 | 5596 | 27.87 | 752 | 755 | 173.7 |
| C | 14 | 234 | 2311 | 8.96 | 752 | 755 | 173.7 |
| C | 8 | 222 | 2133 | 7.93 | 752 | 755 | 173.7 |
| D | 1 | 52 | 335333 | 1906.13 | 729 | 708 | 175.6 |
| D | 10 | 253 | 183610 | 1041.87 | 729 | 708 | 175.6 |
| D | 8 | 195 | 117677 | 666.29 | 729 | 708 | 175.6 |
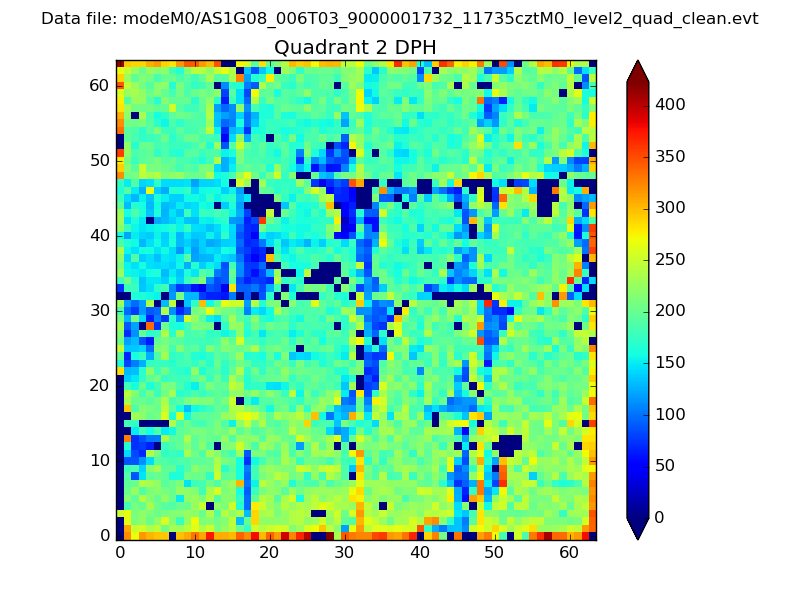
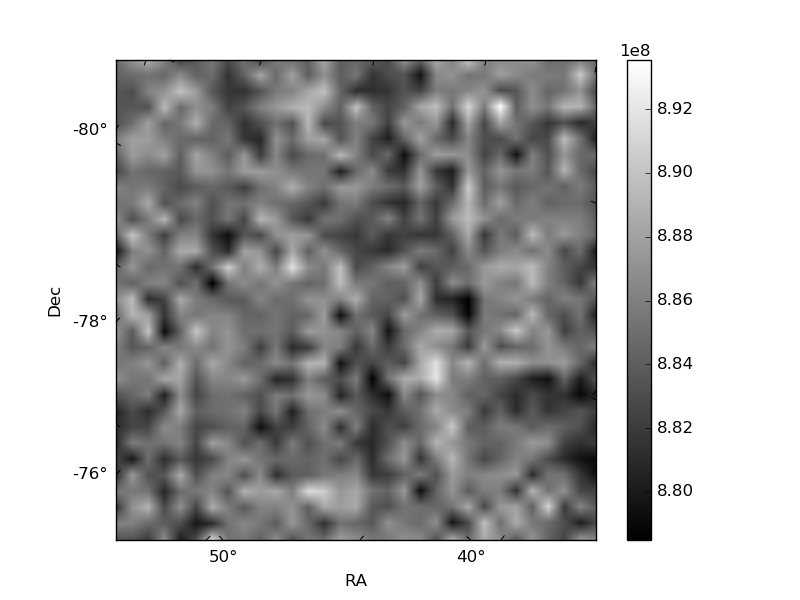
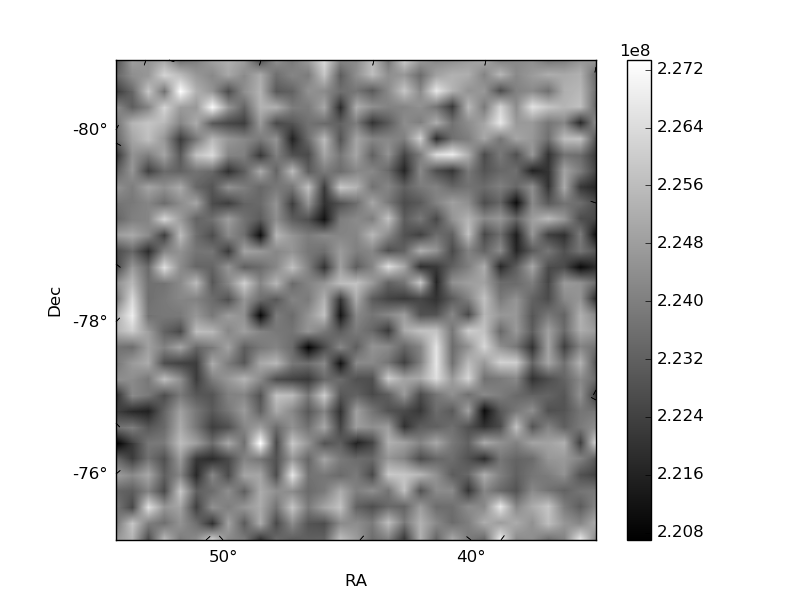
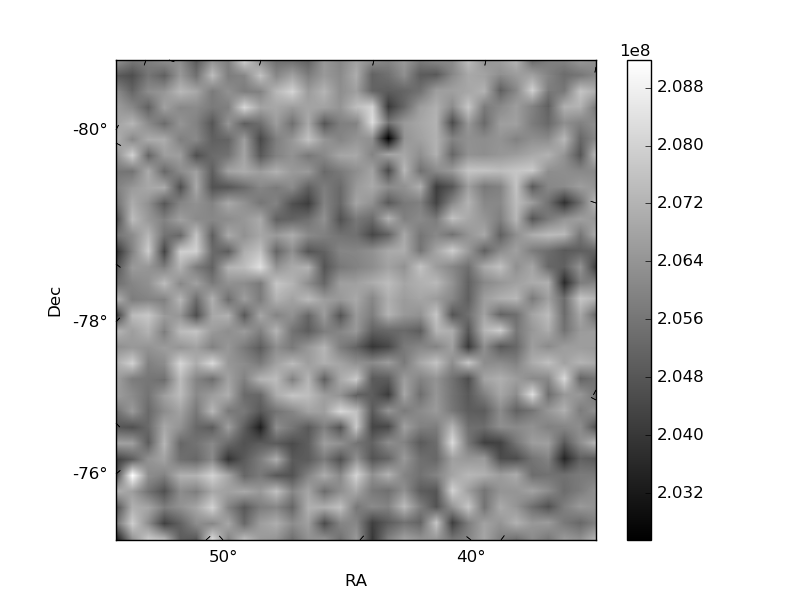
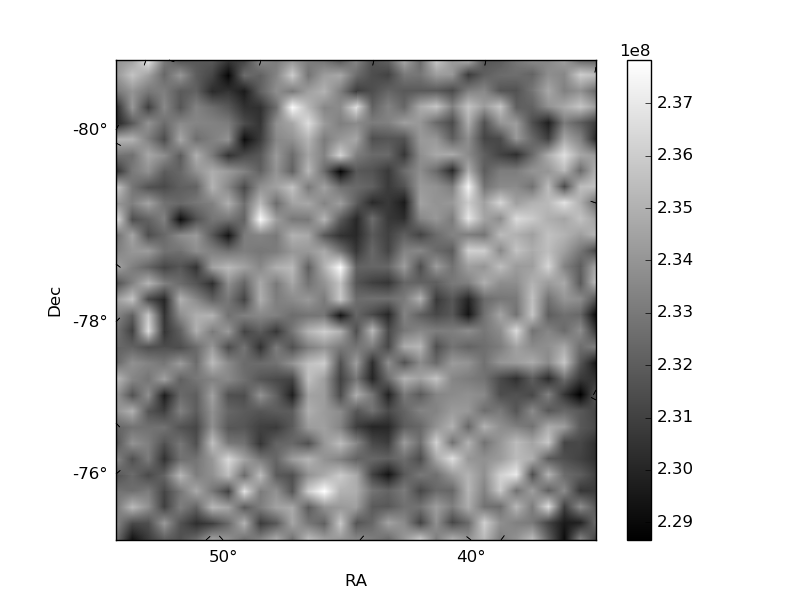
Histogram calculated using DETX and DETY for each event in the final _common_clean file
| Quadrant A | 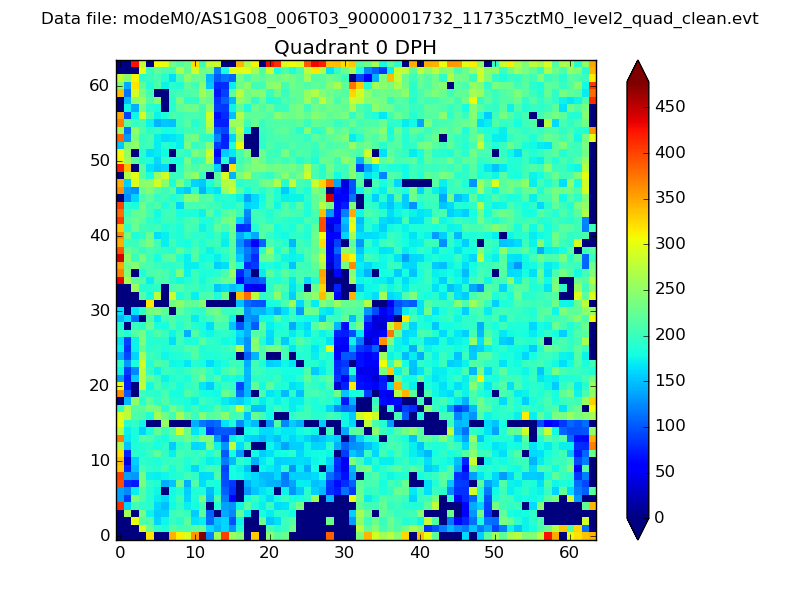 |
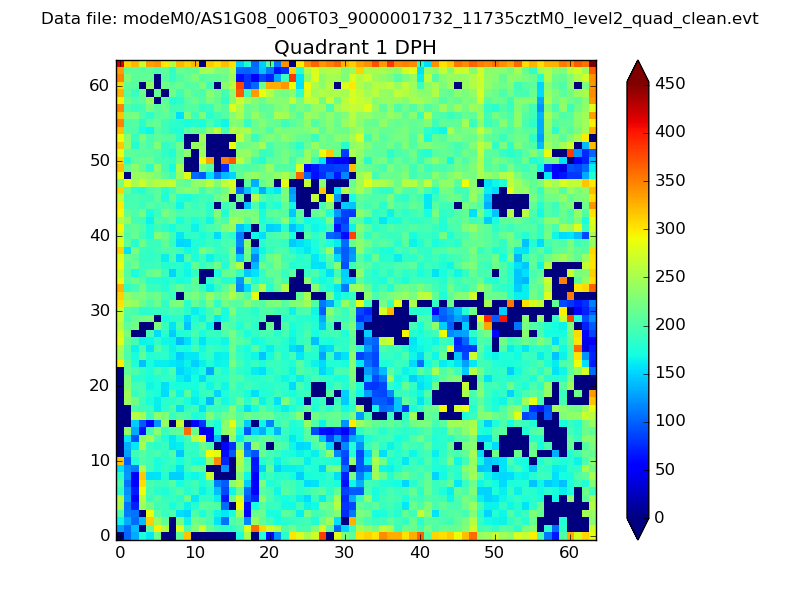 |
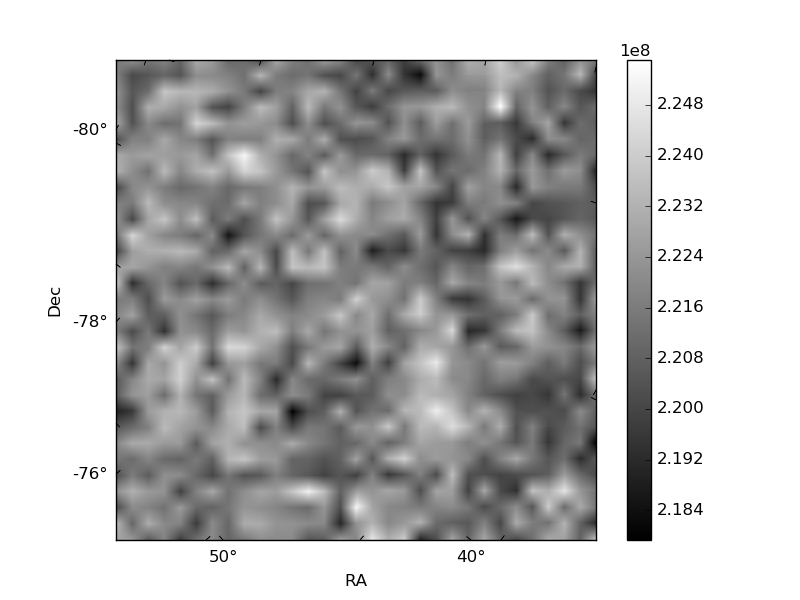
Quadrant B |
|---|---|---|---|
| Quadrant D | 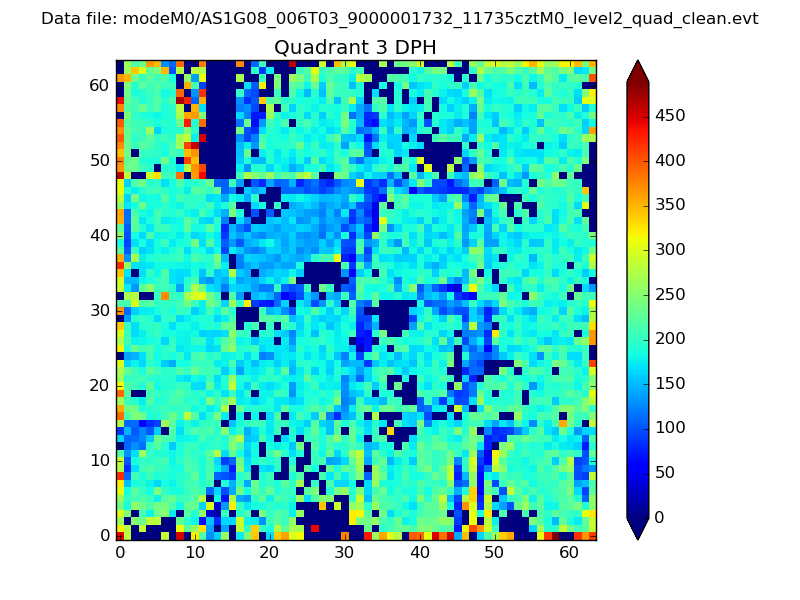 |
 |
Quadrant C |
| Plot type | Count rate plots | Images |
|---|---|---|
| Comparison with Poisson distribution Blue bars denote a histogram of data divided into 1 sec bins. Red curve is a Poisson curve with rate = median count rate of data. |
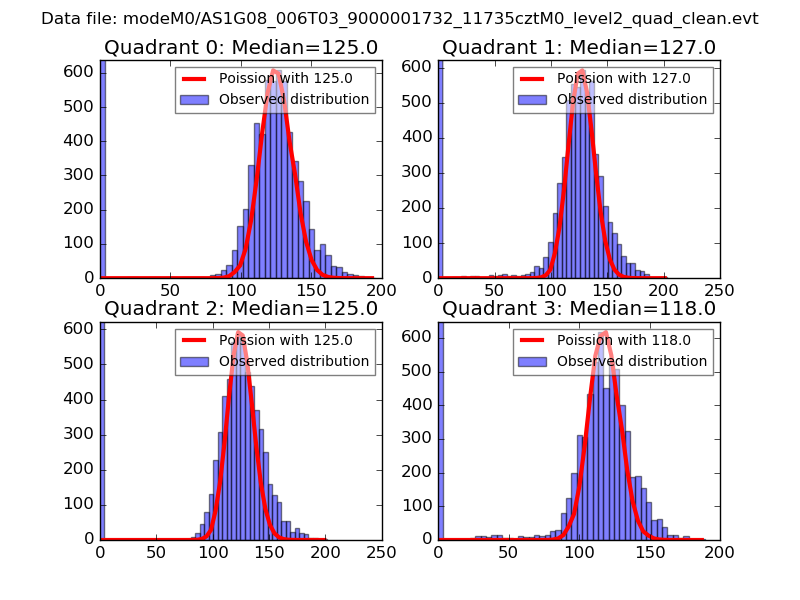 |
 |
| Quadrant-wise count rates Data is divided into 100 sec bins |
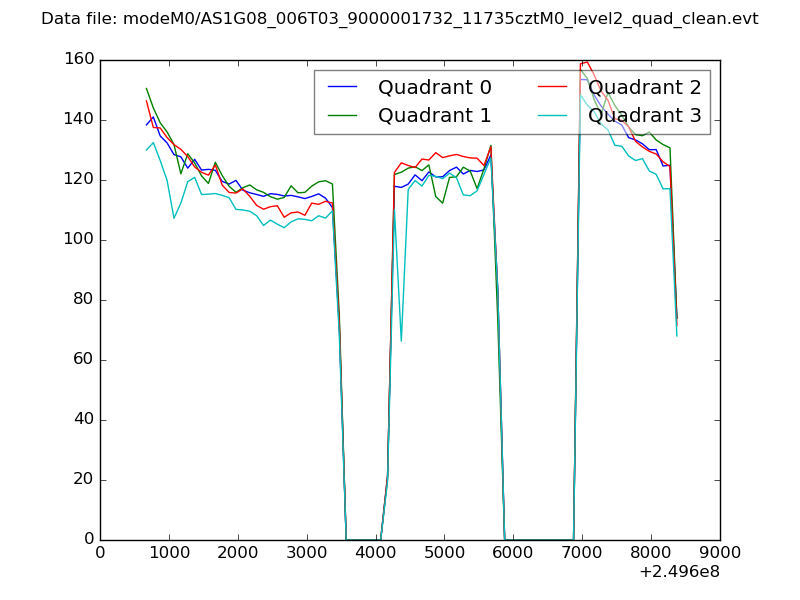 |
|
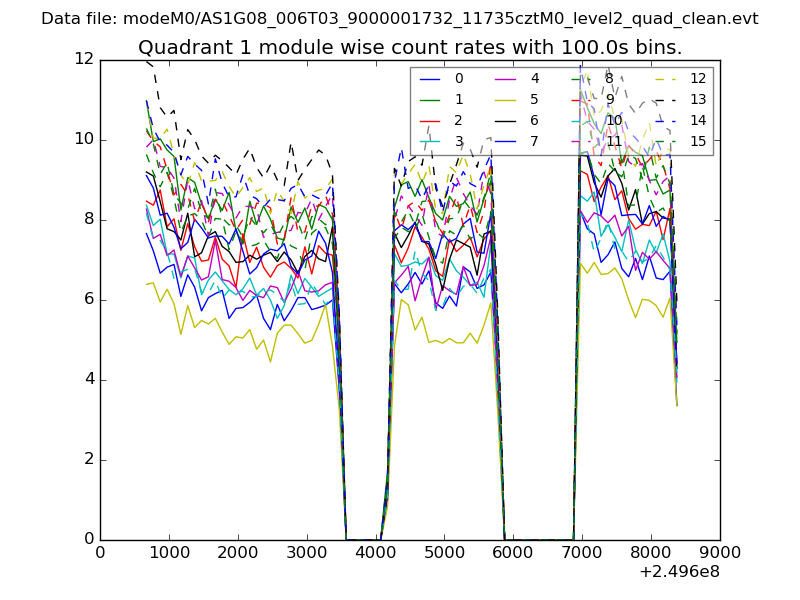
| Module-wise count rates for Quadrant A Data is divided into 100 sec bins |
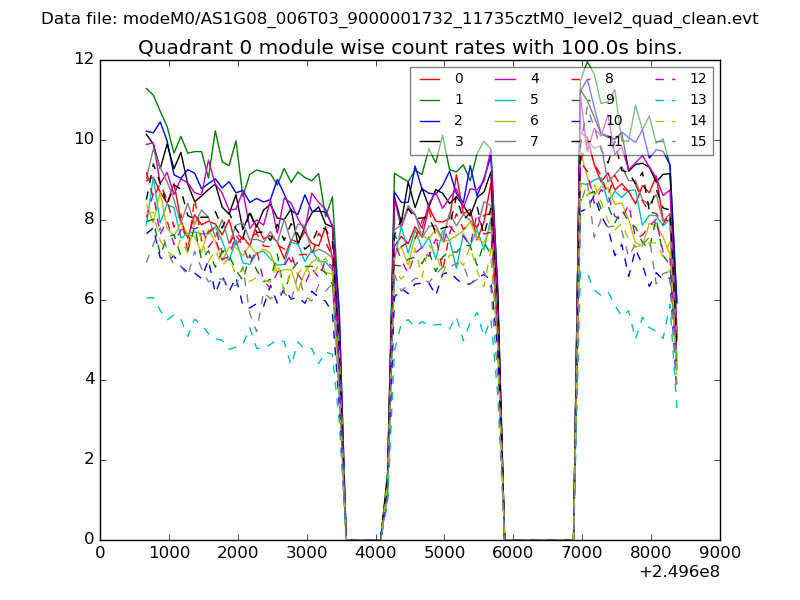 |
 |
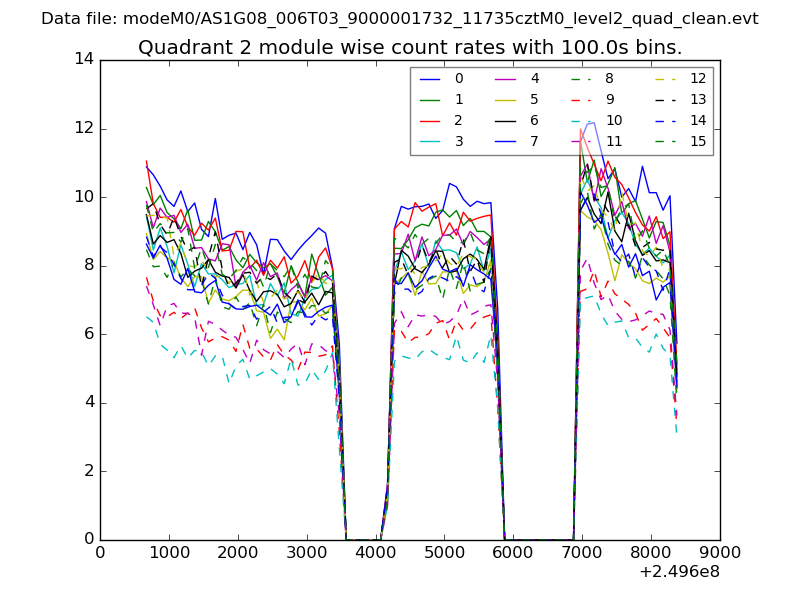
| Module-wise count rates for Quadrant B Data is divided into 100 sec bins |
 |
 |
| Module-wise count rates for Quadrant C Data is divided into 100 sec bins |
 |
 |
| Module-wise count rates for Quadrant D Data is divided into 100 sec bins |
 |
 |
| Parameter | Plot |
|---|---|
| CZT HV Monitor | 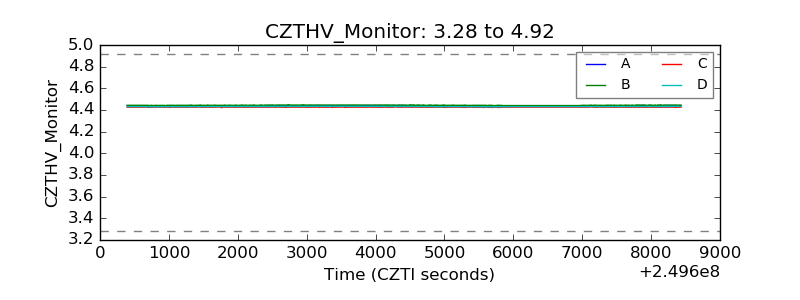 |
| D_VDD | 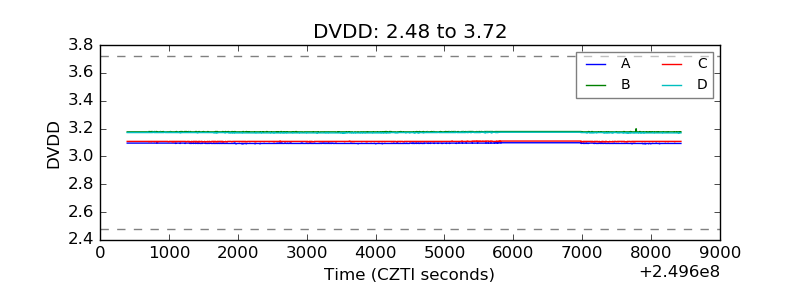 |
| Temperature 1 |  |
| Veto HV Monitor | 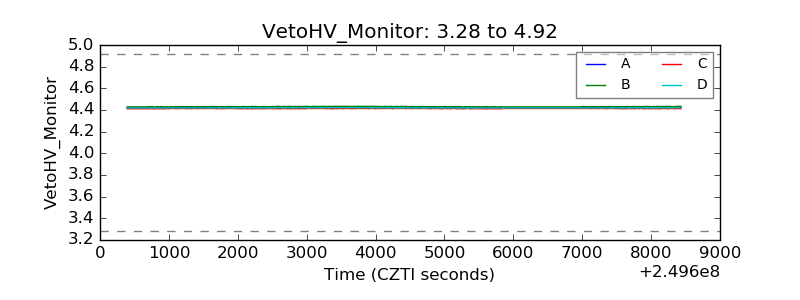 |
| Veto LLD | 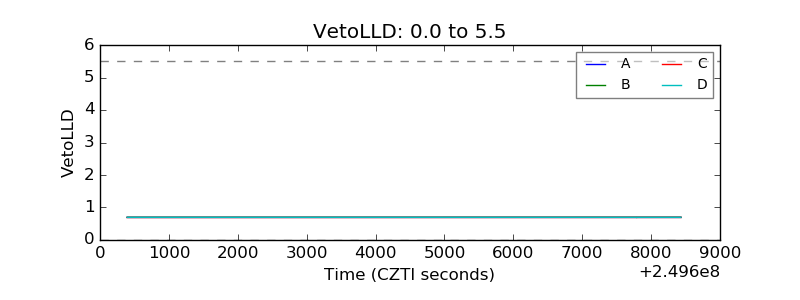 |
| Alpha Counter | 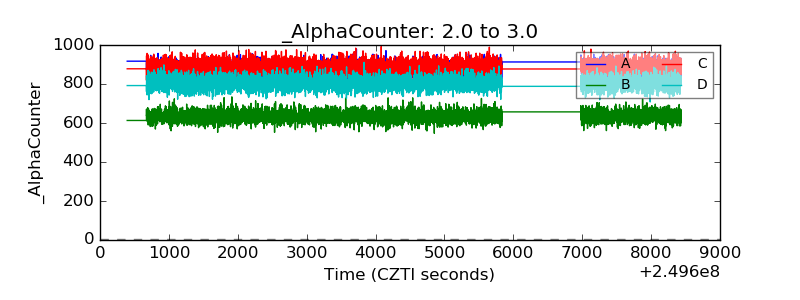 |
| _CPM_Rate | 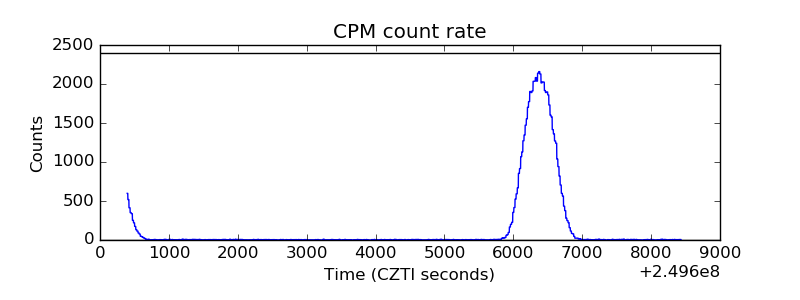 |
| CZT Counter | 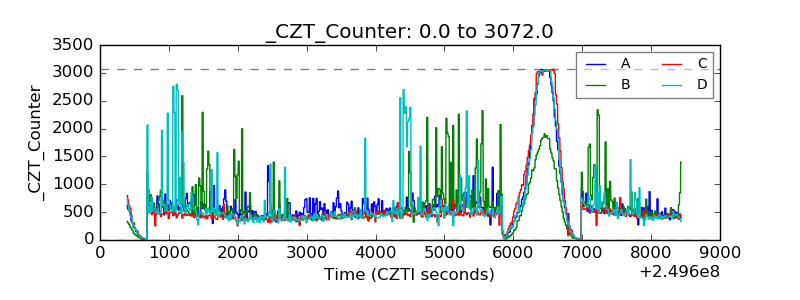 |
| +2.5 Volts monitor |  |
| +5 Volts monitor | 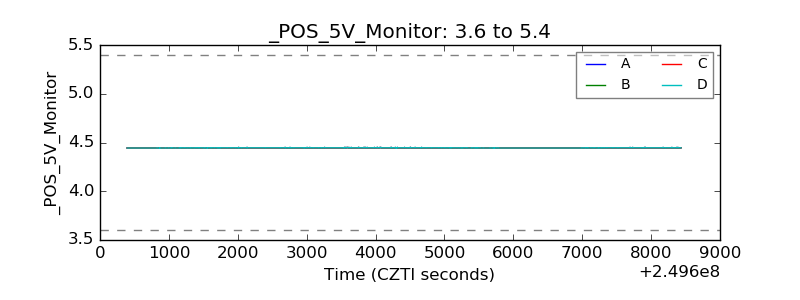 |
| _ROLL_ROT | 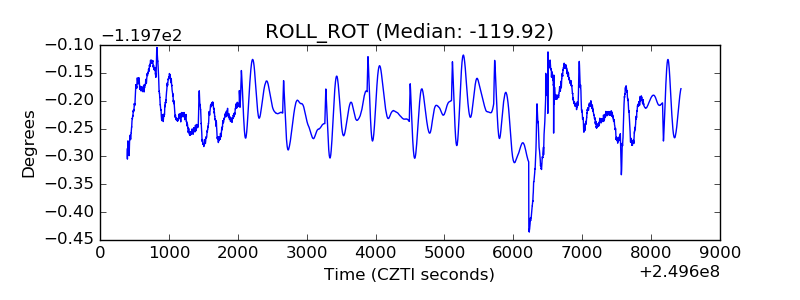 |
| _Roll_DEC | 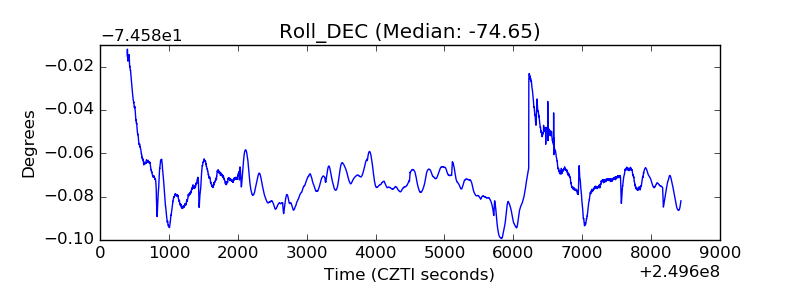 |
| _Roll_RA | 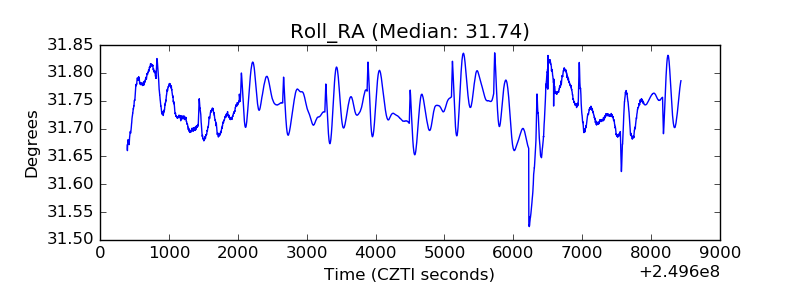 |
| Veto Counter | 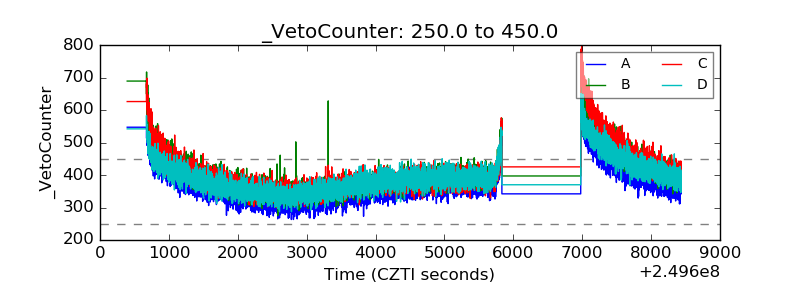 |