| Param | Original file | Final file |
|---|---|---|
| Filename | modeM0/AS1G08_006T03_9000001732_11736cztM0_level2.evt | modeM0/AS1G08_006T03_9000001732_11736cztM0_level2_quad_clean.evt |
| Size (bytes) | 488,422,080 | 117,535,680 |
| Size | 465.8 MB | 112.1 MB |
| Events in quadrant A | 3,547,761 | 780,635 |
| Events in quadrant B | 4,394,027 | 784,084 |
| Events in quadrant C | 3,041,410 | 792,763 |
| Events in quadrant D | 3,366,311 | 747,844 |
| Mode M0 | |||
|---|---|---|---|
| Quadrant | BADHDUFLAG | Total packets | Discarded packets |
| A | 0 | 14795 | 3 |
| B | 0 | 17447 | 2 |
| C | 0 | 13292 | 2 |
| D | 0 | 14461 | 2 |
| Mode M9 | |||
|---|---|---|---|
| Quadrant | BADHDUFLAG | Total packets | Discarded packets |
| A | 0 | 18 | 0 |
| B | 0 | 18 | 0 |
| C | 0 | 18 | 0 |
| D | 0 | 19 | 0 |
| Mode SS | |||
|---|---|---|---|
| Quadrant | BADHDUFLAG | Total packets | Discarded packets |
| A | 0 | 132 | 0 |
| B | 0 | 132 | 0 |
| C | 0 | 132 | 0 |
| D | 0 | 132 | 0 |
| Quadrant | Total seconds | Saturated seconds | Saturation percentage |
|---|---|---|---|
| A | 6509 | 44 | 0.675987% |
| B | 6509 | 393 | 6.037794% |
| C | 6509 | 14 | 0.215087% |
| D | 6509 | 37 | 0.568444% |
Noise dominated data is calculated using 1-second bins in cleaned event files. If a bin has >2000 counts, and if more than 50% of those come from <1% of pixels, then it is considered to be noise-dominated and hence unusable.
| Quadrant | # 1 sec bins | Bins with >0 counts | Bins with >2000 counts | High rate bins dominated by noise | Noise dominated (total time) | Noise dominated (detector-on time) | Marked lightcurve |
|---|---|---|---|---|---|---|---|
| A | 7720 | 6511 | 3 | 3 | 0.04% | 0.05% | 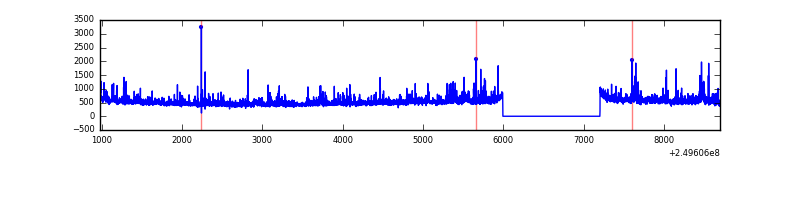 |
| B | 7720 | 6511 | 148 | 148 | 1.92% | 2.27% | 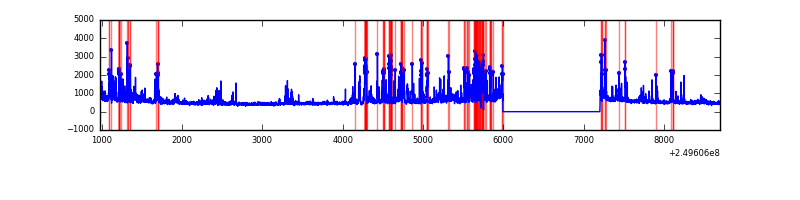 |
| C | 7720 | 6511 | 0 | 0 | 0.00% | 0.00% | 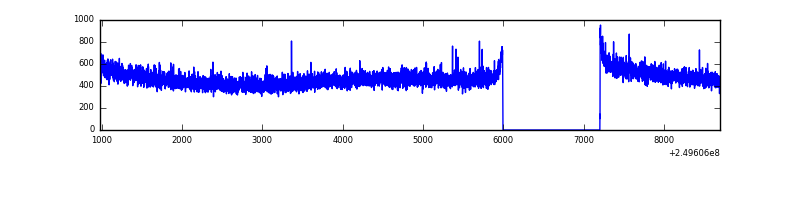 |
| D | 7720 | 6511 | 18 | 18 | 0.23% | 0.28% | 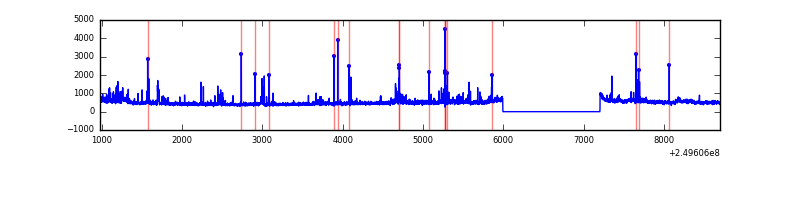 |
Top three noisy pixels from each quadrant. If the there are fewer than three noisy pixels in the level2.evt file, extra rows are filled as -1
| Pixel properties | Quadrant properties | ||||||
|---|---|---|---|---|---|---|---|
| Quadrant | DetID | PixID | Counts | Sigma | Mean | Median | Sigma |
| A | 1 | 162 | 123305 | 777.94 | 780 | 766 | 157.5 |
| A | 9 | 143 | 83332 | 524.17 | 780 | 766 | 157.5 |
| A | 1 | 178 | 73601 | 462.39 | 780 | 766 | 157.5 |
| B | 4 | 239 | 560905 | 3869.66 | 779 | 763 | 144.8 |
| B | 3 | 64 | 274368 | 1890.16 | 779 | 763 | 144.8 |
| B | 0 | 219 | 239476 | 1649.11 | 779 | 763 | 144.8 |
| C | 13 | 61 | 5917 | 28.9 | 778 | 782 | 177.7 |
| C | 8 | 222 | 3756 | 16.74 | 778 | 782 | 177.7 |
| C | 12 | 4 | 2063 | 7.21 | 778 | 782 | 177.7 |
| D | 8 | 195 | 140798 | 767.11 | 763 | 742 | 182.6 |
| D | 1 | 52 | 52442 | 283.17 | 763 | 742 | 182.6 |
| D | 13 | 249 | 51686 | 279.03 | 763 | 742 | 182.6 |
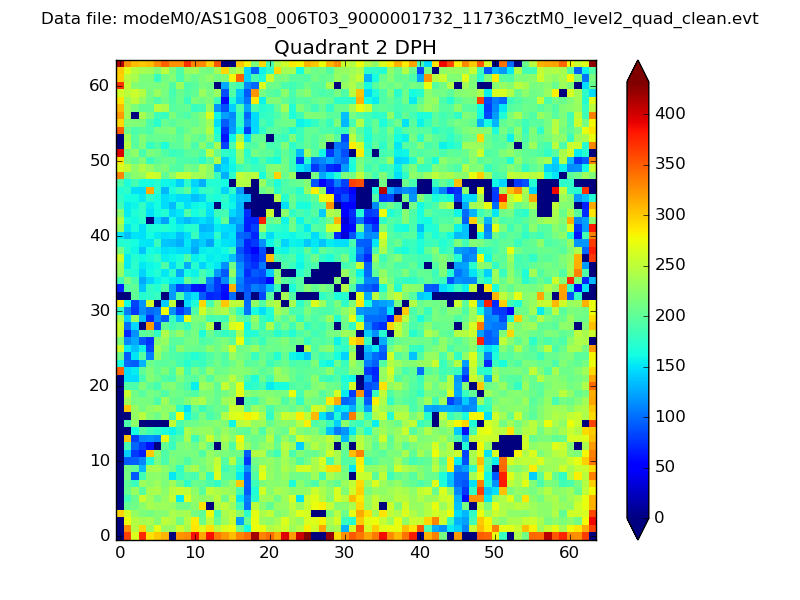
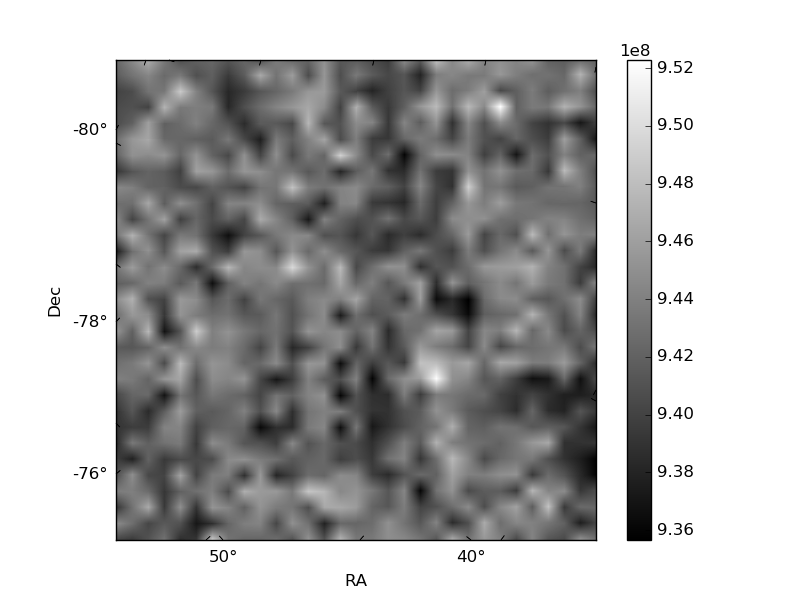
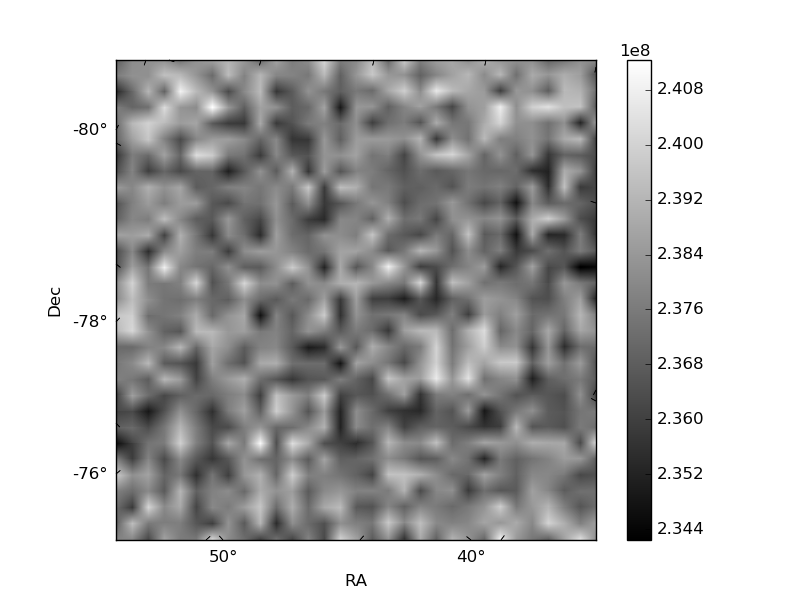
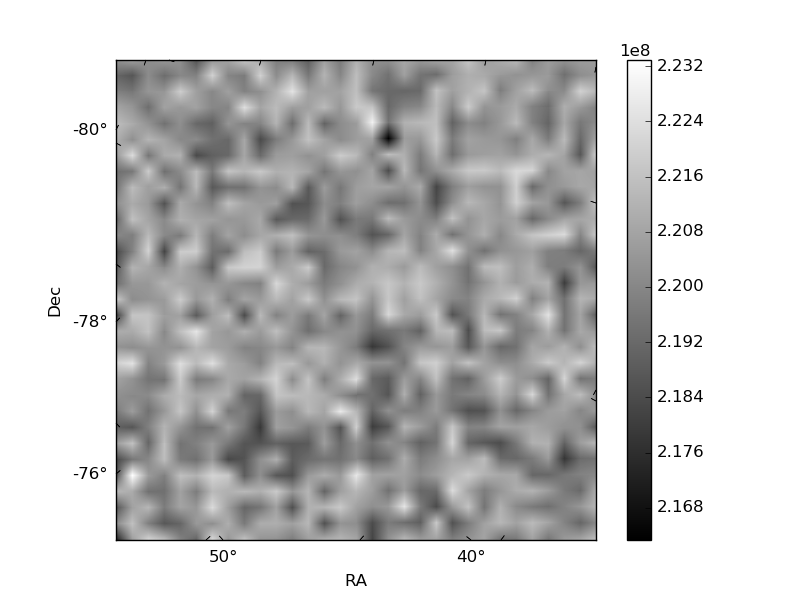
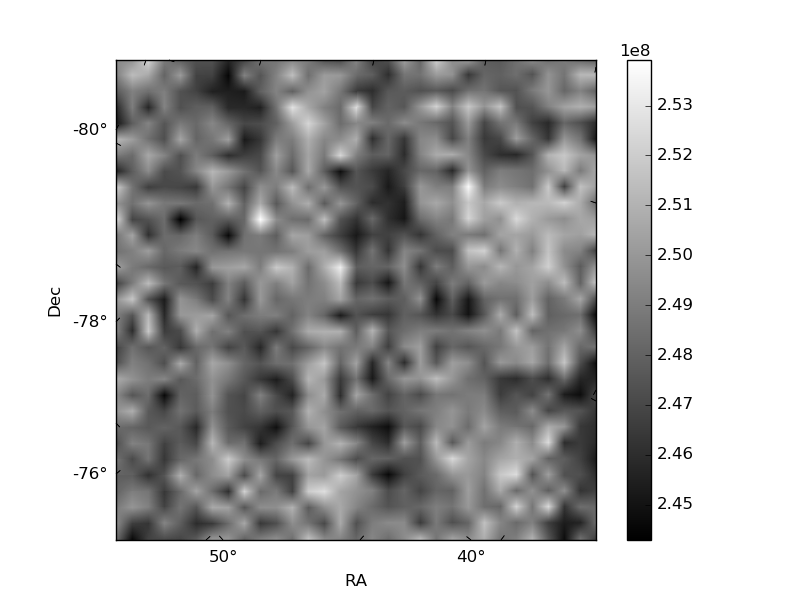
Histogram calculated using DETX and DETY for each event in the final _common_clean file
| Quadrant A | 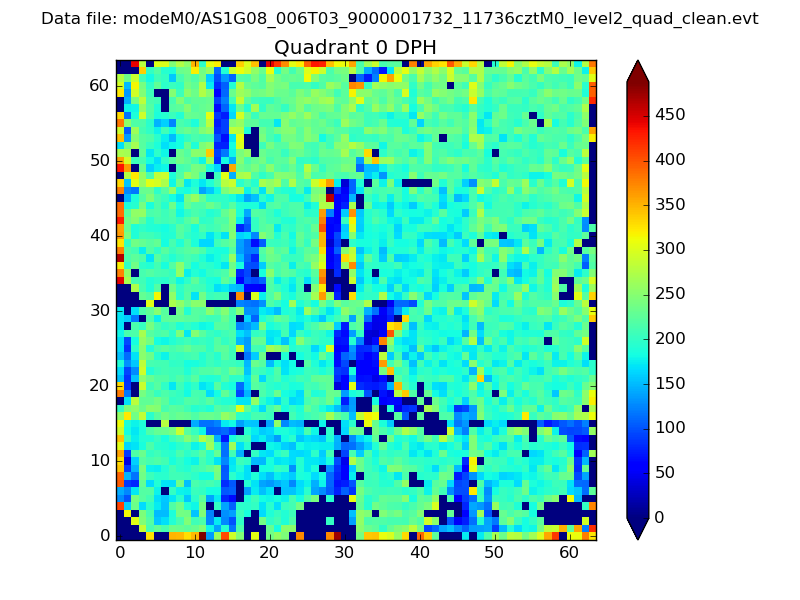 |
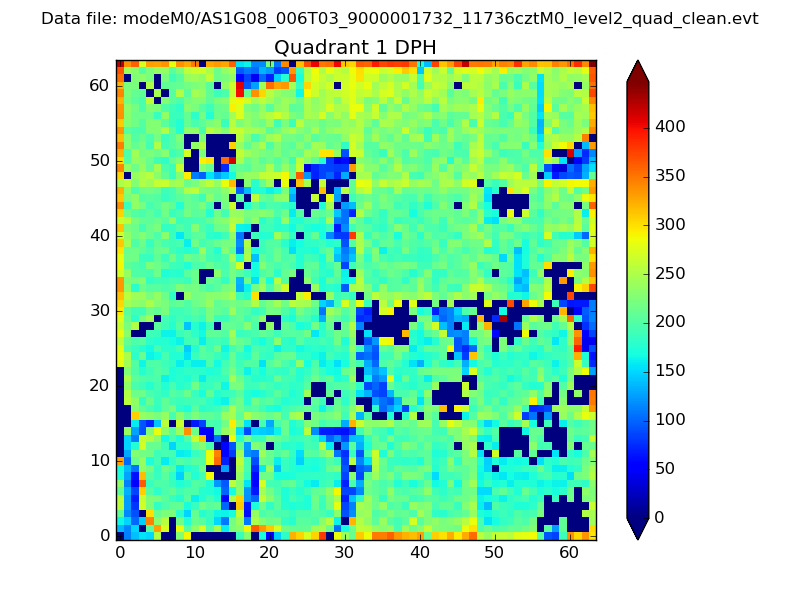 |
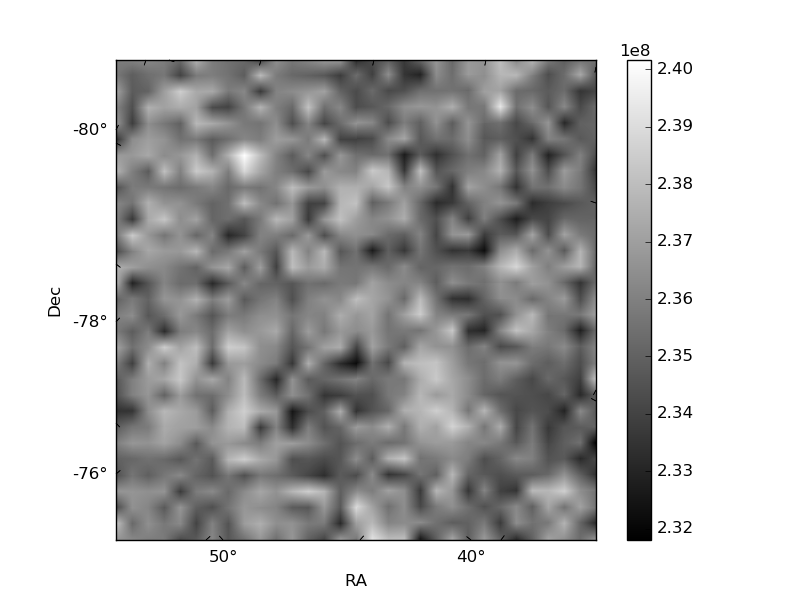
Quadrant B |
|---|---|---|---|
| Quadrant D | 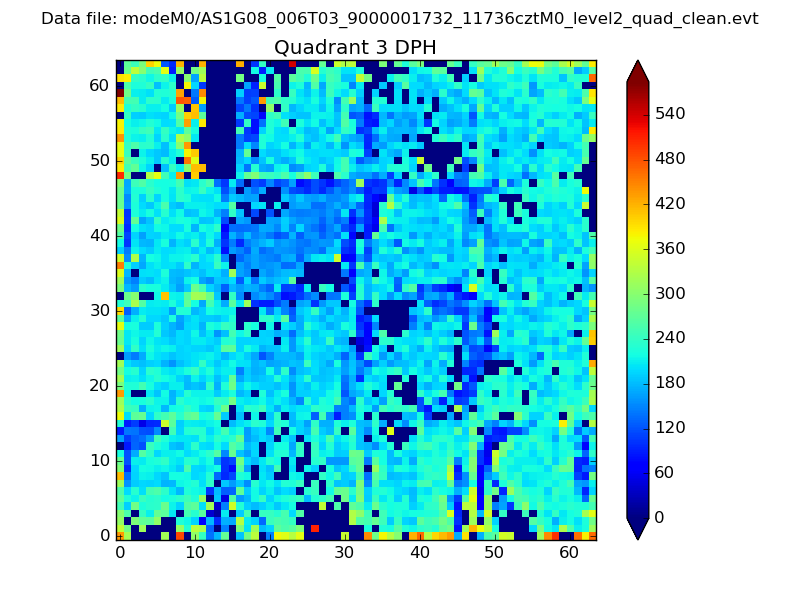 |
 |
Quadrant C |
| Plot type | Count rate plots | Images |
|---|---|---|
| Comparison with Poisson distribution Blue bars denote a histogram of data divided into 1 sec bins. Red curve is a Poisson curve with rate = median count rate of data. |
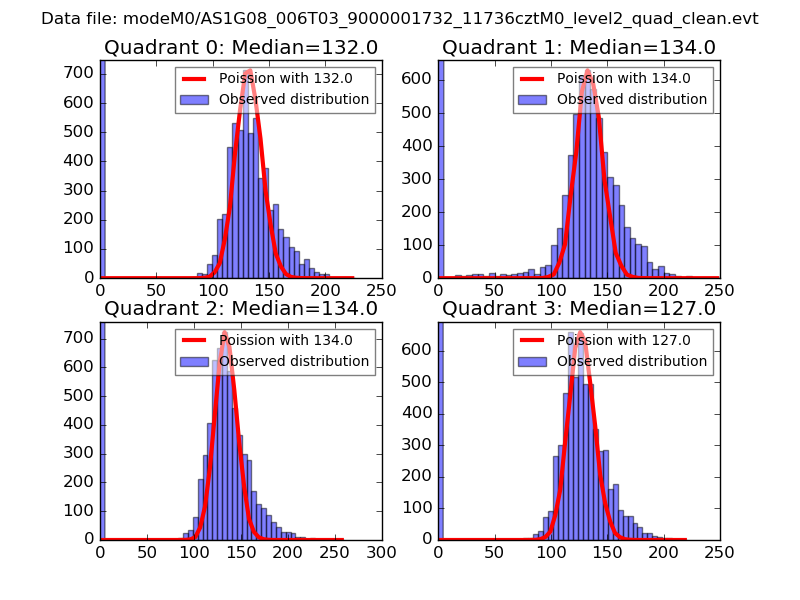 |
 |
| Quadrant-wise count rates Data is divided into 100 sec bins |
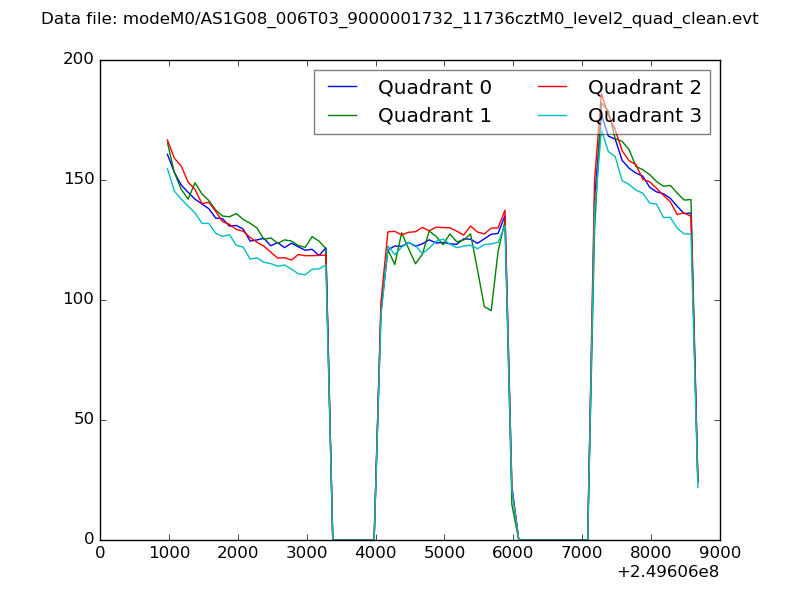 |
|
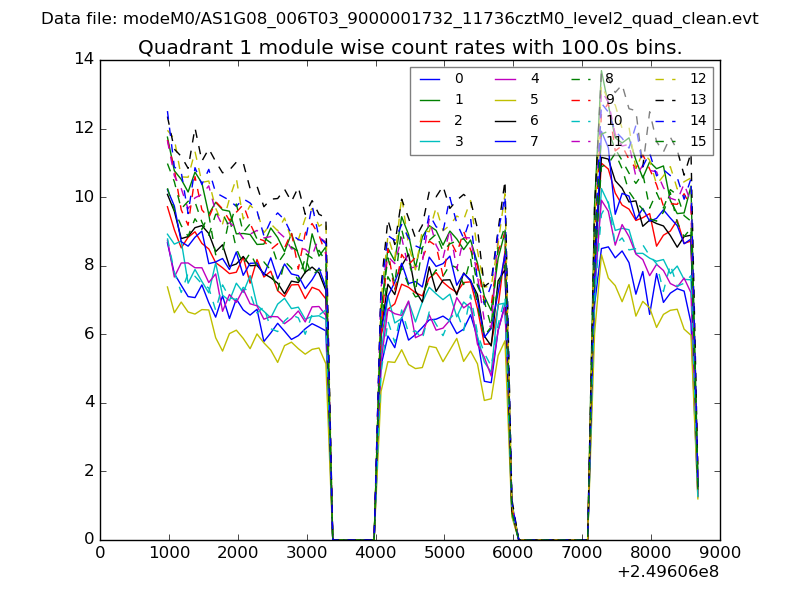
| Module-wise count rates for Quadrant A Data is divided into 100 sec bins |
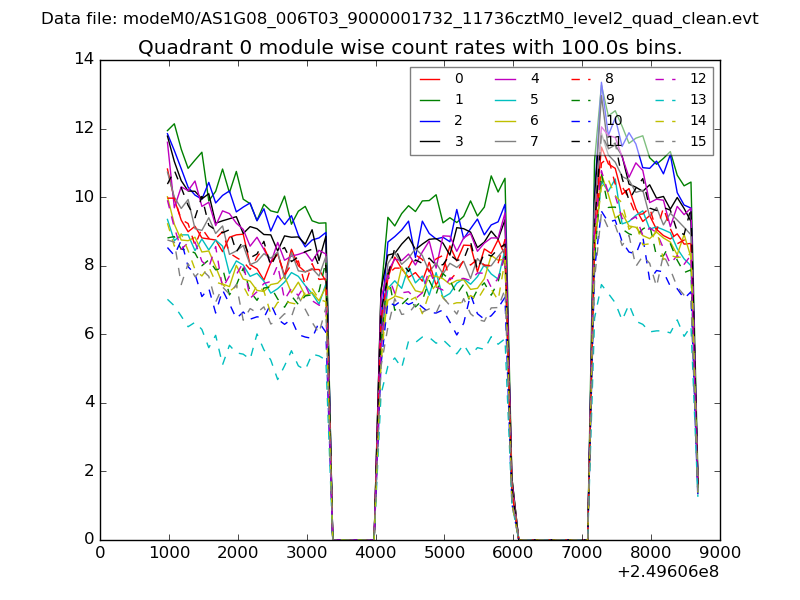 |
 |
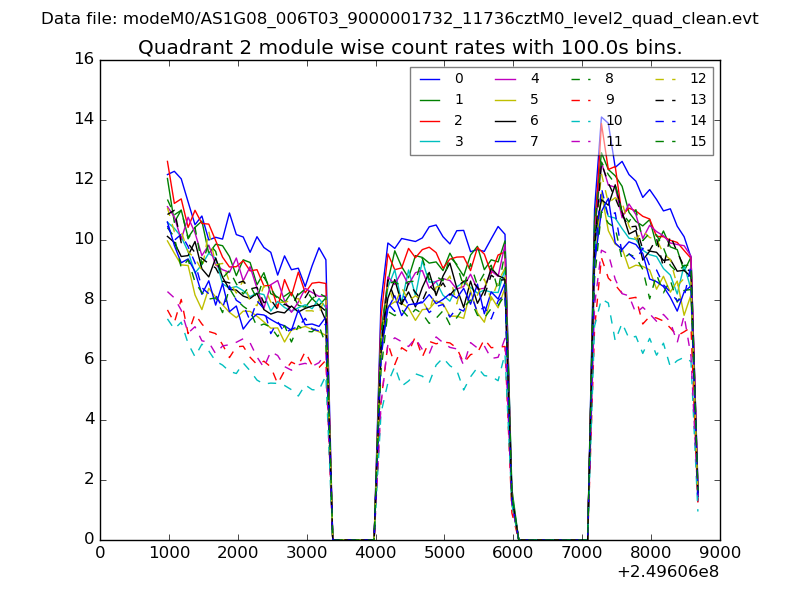
| Module-wise count rates for Quadrant B Data is divided into 100 sec bins |
 |
 |
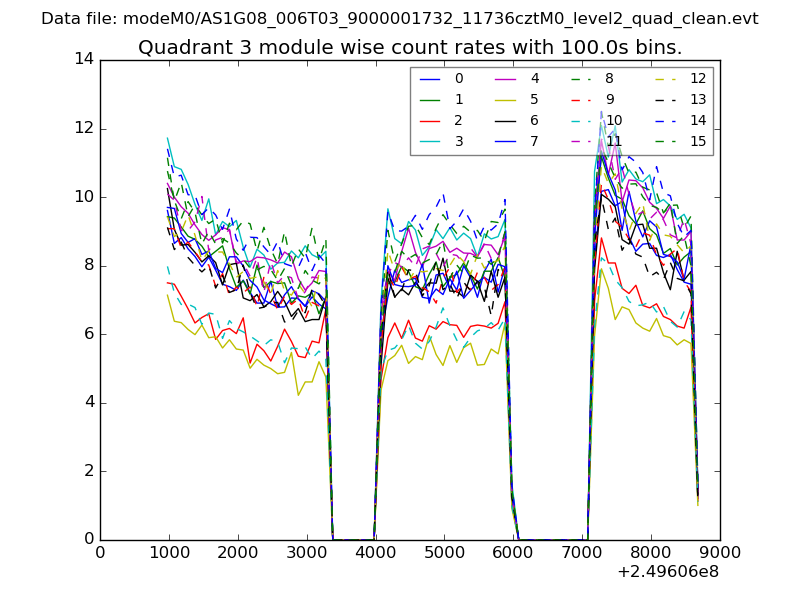
| Module-wise count rates for Quadrant C Data is divided into 100 sec bins |
 |
 |
| Module-wise count rates for Quadrant D Data is divided into 100 sec bins |
 |
 |
| Parameter | Plot |
|---|---|
| CZT HV Monitor | 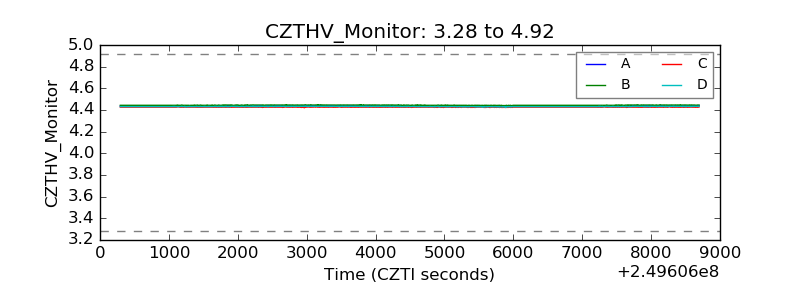 |
| D_VDD | 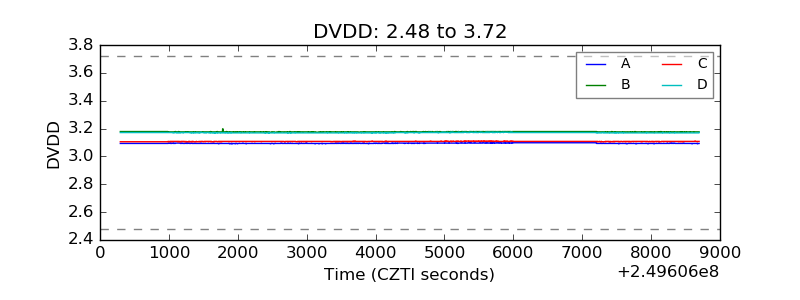 |
| Temperature 1 | 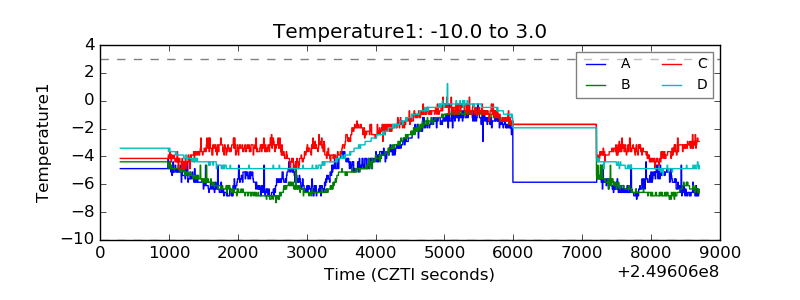 |
| Veto HV Monitor | 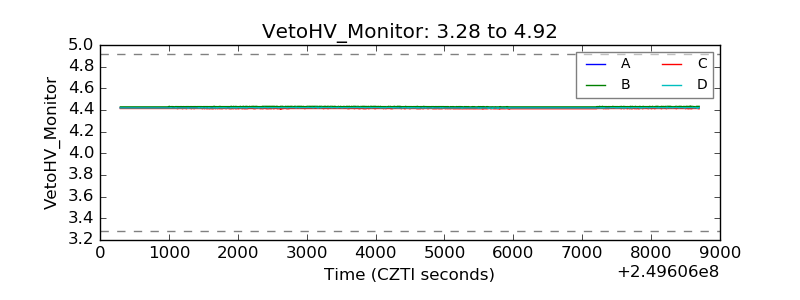 |
| Veto LLD | 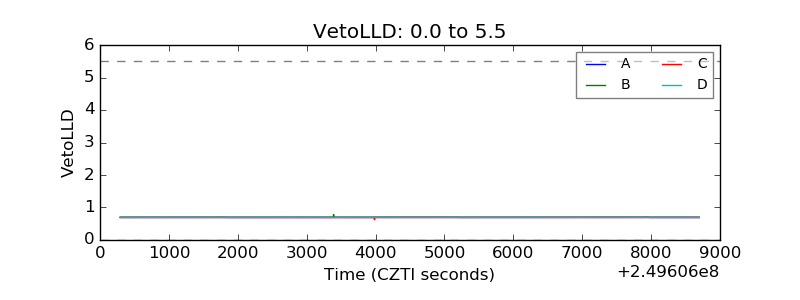 |
| Alpha Counter | 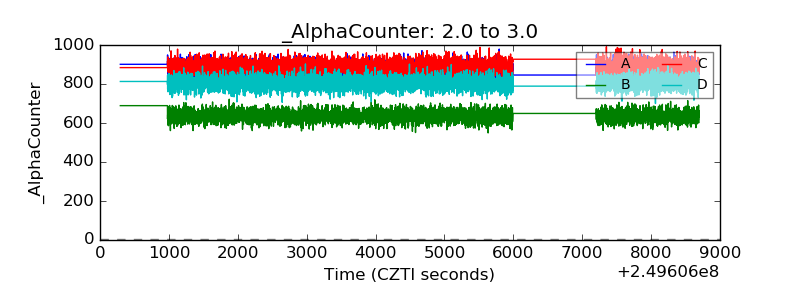 |
| _CPM_Rate | 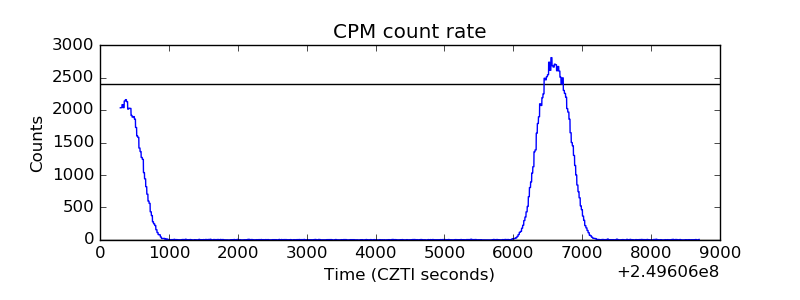 |
| CZT Counter | 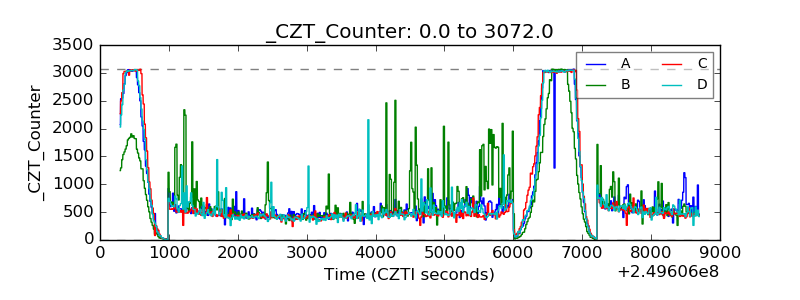 |
| +2.5 Volts monitor |  |
| +5 Volts monitor | 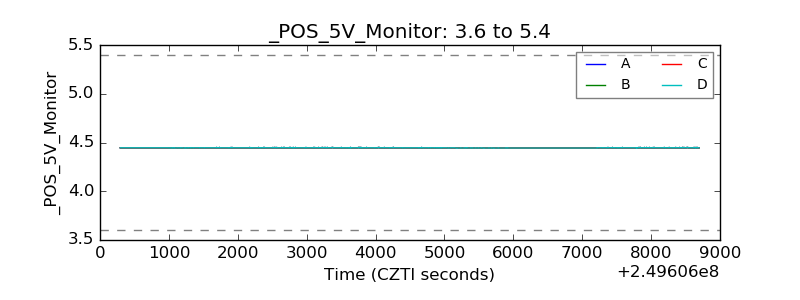 |
| _ROLL_ROT | 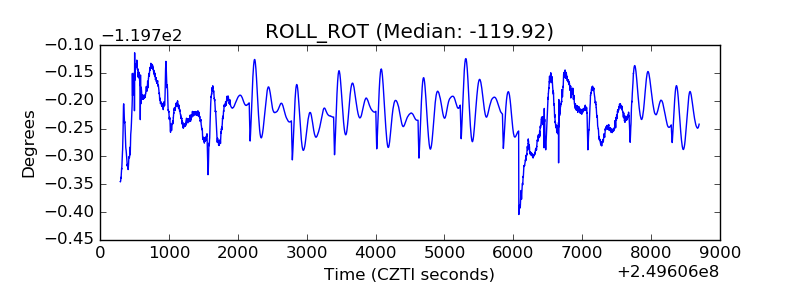 |
| _Roll_DEC | 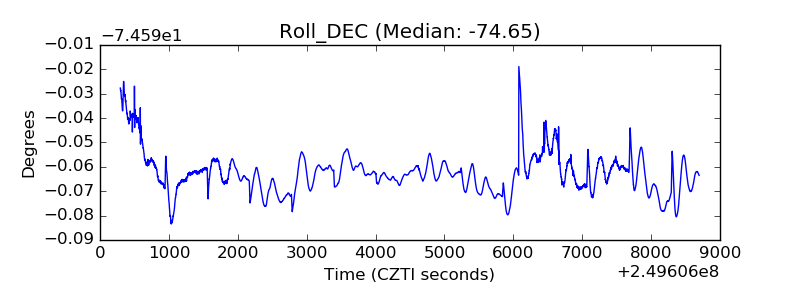 |
| _Roll_RA | 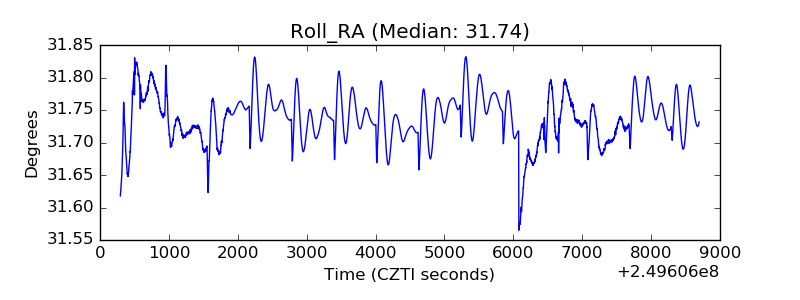 |
| Veto Counter | 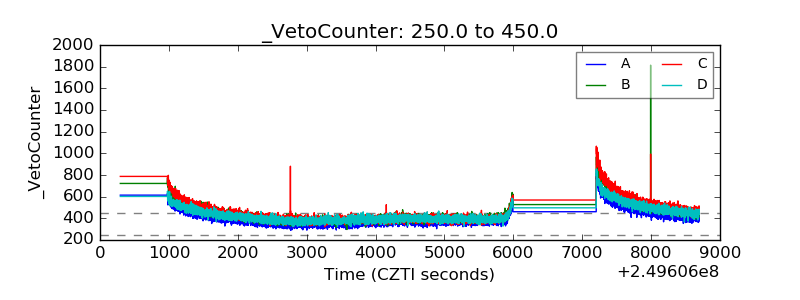 |