| Param | Original file | Final file |
|---|---|---|
| Filename | modeM0/AS1G08_006T03_9000001732_11737cztM0_level2.evt | modeM0/AS1G08_006T03_9000001732_11737cztM0_level2_quad_clean.evt |
| Size (bytes) | 472,746,240 | 116,712,000 |
| Size | 450.8 MB | 111.3 MB |
| Events in quadrant A | 3,445,382 | 776,983 |
| Events in quadrant B | 3,995,513 | 794,801 |
| Events in quadrant C | 2,988,681 | 789,103 |
| Events in quadrant D | 3,468,976 | 743,432 |
| Mode M0 | |||
|---|---|---|---|
| Quadrant | BADHDUFLAG | Total packets | Discarded packets |
| A | 0 | 14050 | 2 |
| B | 0 | 15934 | 1 |
| C | 0 | 12685 | 1 |
| D | 0 | 14246 | 1 |
| Mode M9 | |||
|---|---|---|---|
| Quadrant | BADHDUFLAG | Total packets | Discarded packets |
| A | 0 | 13 | 0 |
| B | 0 | 13 | 0 |
| C | 0 | 13 | 0 |
| D | 0 | 13 | 0 |
| Mode SS | |||
|---|---|---|---|
| Quadrant | BADHDUFLAG | Total packets | Discarded packets |
| A | 0 | 126 | 0 |
| B | 0 | 126 | 0 |
| C | 0 | 126 | 0 |
| D | 0 | 126 | 0 |
| Quadrant | Total seconds | Saturated seconds | Saturation percentage |
|---|---|---|---|
| A | 6166 | 39 | 0.632501% |
| B | 6166 | 170 | 2.757055% |
| C | 6166 | 10 | 0.162180% |
| D | 6166 | 43 | 0.697373% |
Noise dominated data is calculated using 1-second bins in cleaned event files. If a bin has >2000 counts, and if more than 50% of those come from <1% of pixels, then it is considered to be noise-dominated and hence unusable.
| Quadrant | # 1 sec bins | Bins with >0 counts | Bins with >2000 counts | High rate bins dominated by noise | Noise dominated (total time) | Noise dominated (detector-on time) | Marked lightcurve |
|---|---|---|---|---|---|---|---|
| A | 7477 | 6168 | 6 | 6 | 0.08% | 0.10% | 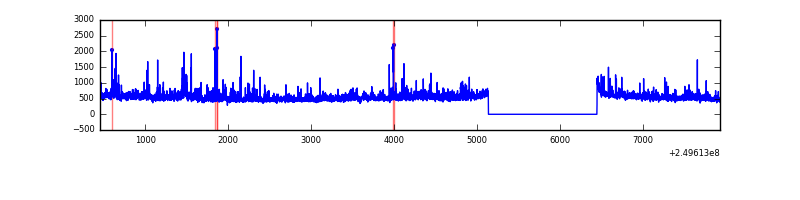 |
| B | 7477 | 6168 | 75 | 75 | 1.00% | 1.22% |  |
| C | 7477 | 6168 | 0 | 0 | 0.00% | 0.00% | 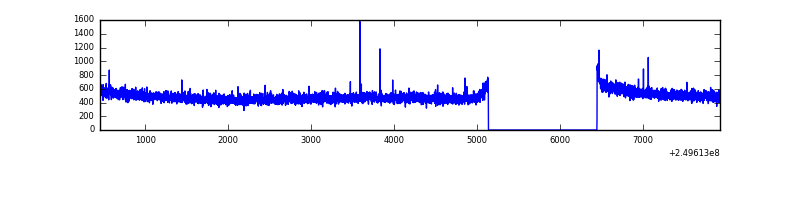 |
| D | 7477 | 6168 | 23 | 23 | 0.31% | 0.37% | 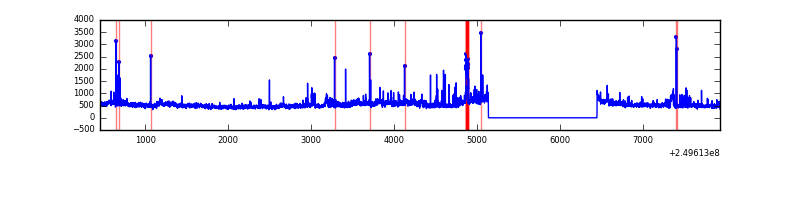 |
Top three noisy pixels from each quadrant. If the there are fewer than three noisy pixels in the level2.evt file, extra rows are filled as -1
| Pixel properties | Quadrant properties | ||||||
|---|---|---|---|---|---|---|---|
| Quadrant | DetID | PixID | Counts | Sigma | Mean | Median | Sigma |
| A | 1 | 162 | 103499 | 665.77 | 765 | 751 | 154.3 |
| A | 8 | 15 | 100677 | 647.48 | 765 | 751 | 154.3 |
| A | 13 | 251 | 97933 | 629.7 | 765 | 751 | 154.3 |
| B | 4 | 239 | 320400 | 2256.03 | 772 | 755 | 141.7 |
| B | 15 | 204 | 274141 | 1929.54 | 772 | 755 | 141.7 |
| B | 3 | 64 | 253663 | 1785.0 | 772 | 755 | 141.7 |
| C | 13 | 61 | 5644 | 28.1 | 765 | 769 | 173.5 |
| C | 14 | 234 | 3721 | 17.01 | 765 | 769 | 173.5 |
| C | 12 | 4 | 2338 | 9.04 | 765 | 769 | 173.5 |
| D | 8 | 195 | 324335 | 1842.29 | 749 | 731 | 175.7 |
| D | 1 | 52 | 87912 | 496.32 | 749 | 731 | 175.7 |
| D | 10 | 199 | 70142 | 395.16 | 749 | 731 | 175.7 |
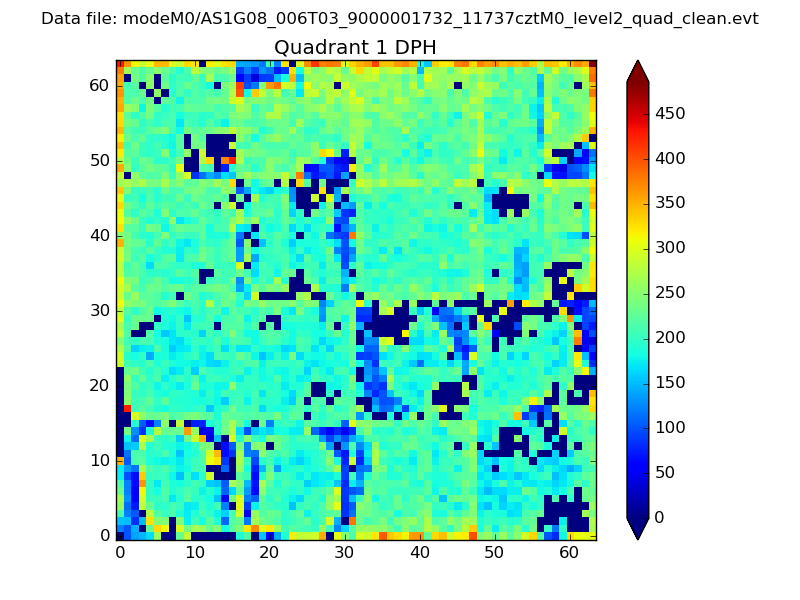
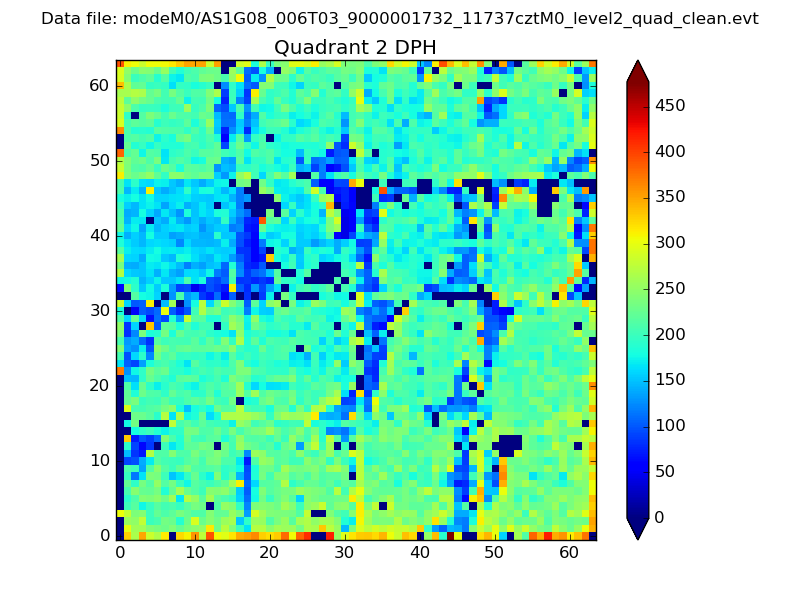
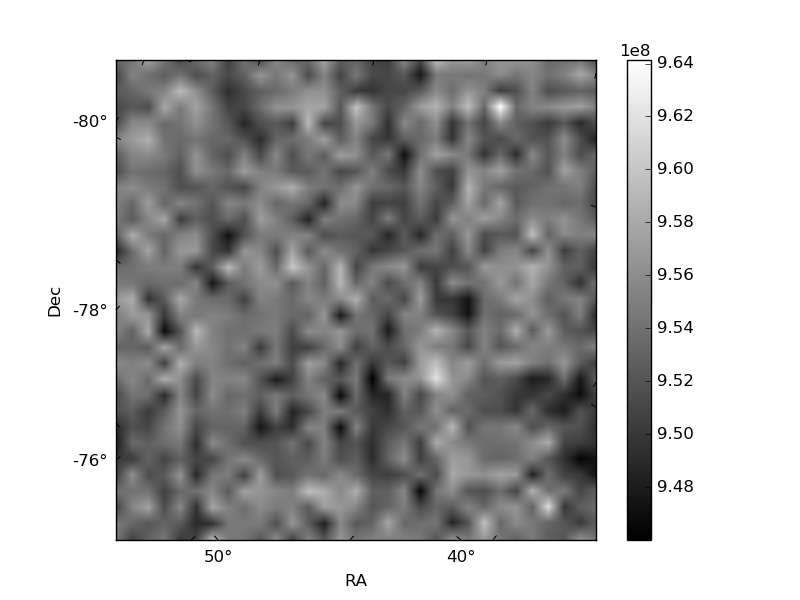
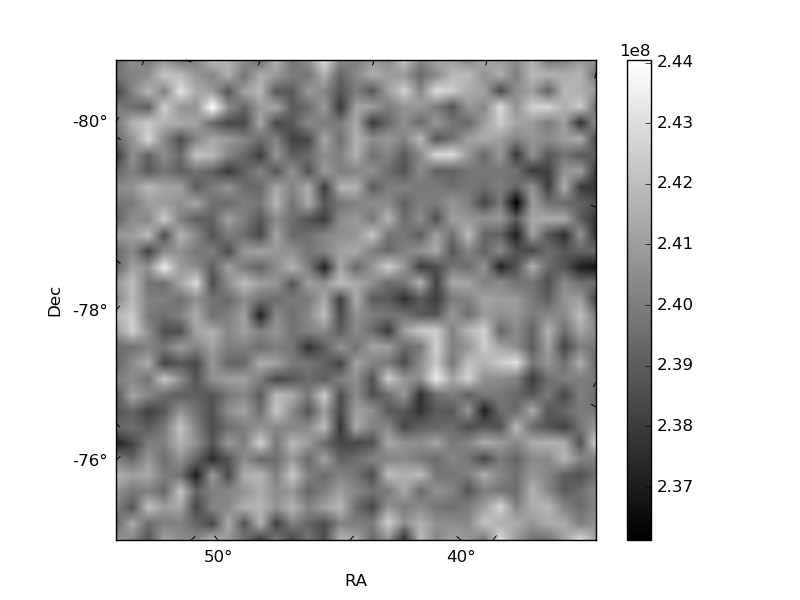
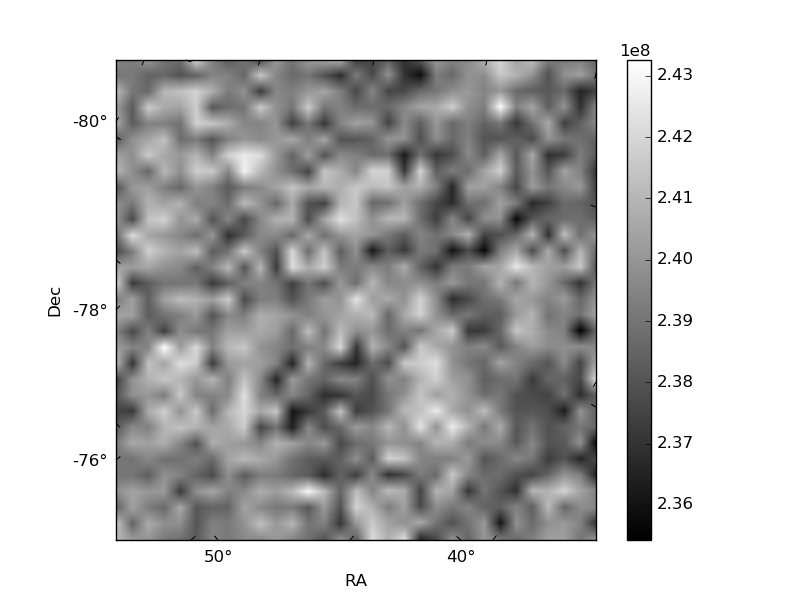
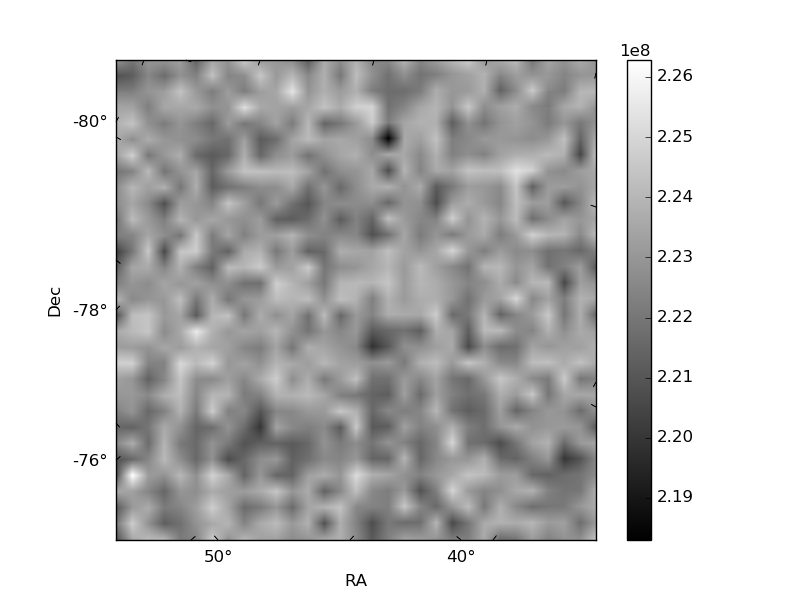
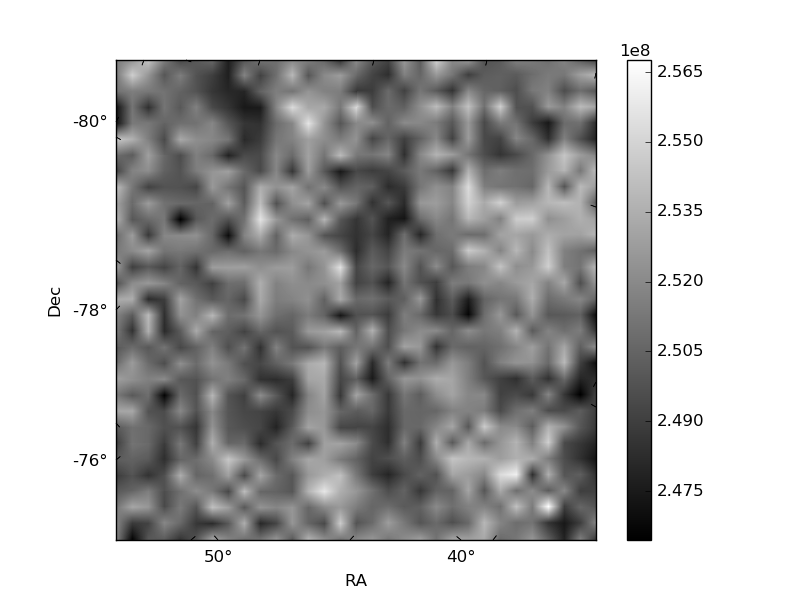
Histogram calculated using DETX and DETY for each event in the final _common_clean file
| Quadrant A | 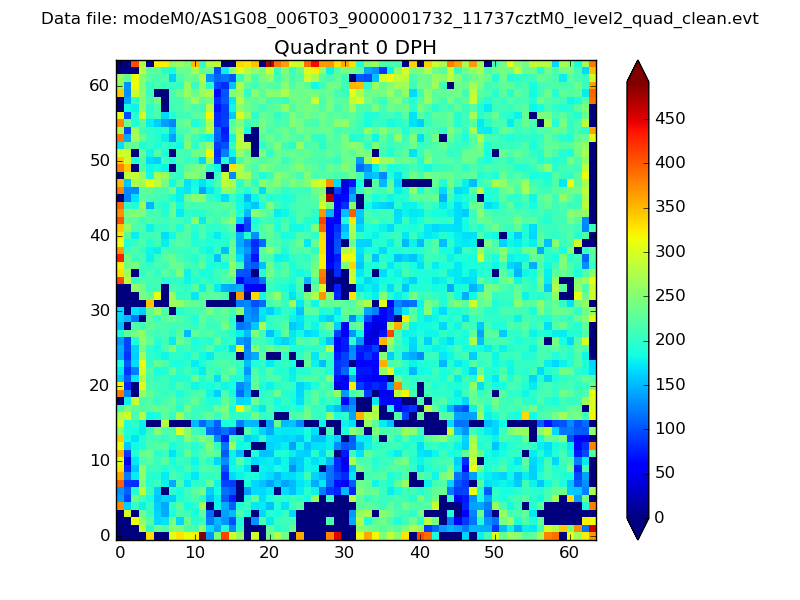 |
 |
Quadrant B |
|---|---|---|---|
| Quadrant D | 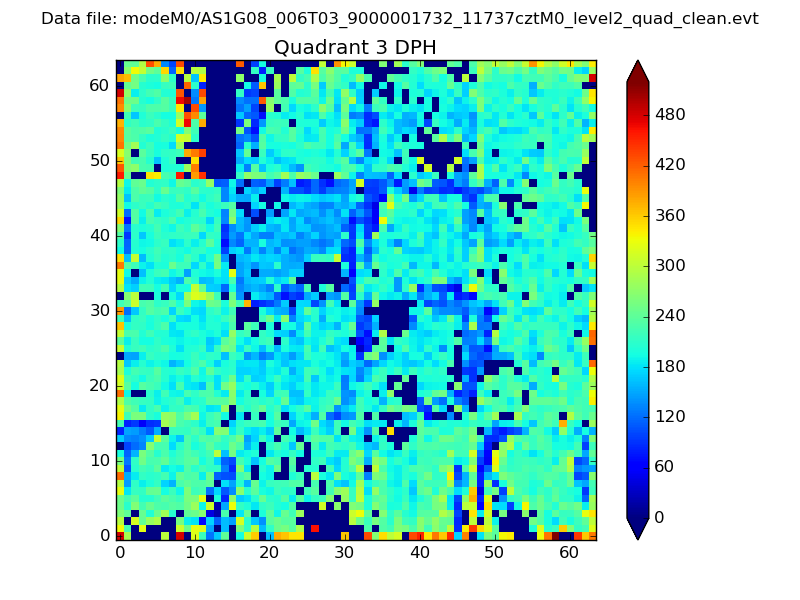 |
 |
Quadrant C |
| Plot type | Count rate plots | Images |
|---|---|---|
| Comparison with Poisson distribution Blue bars denote a histogram of data divided into 1 sec bins. Red curve is a Poisson curve with rate = median count rate of data. |
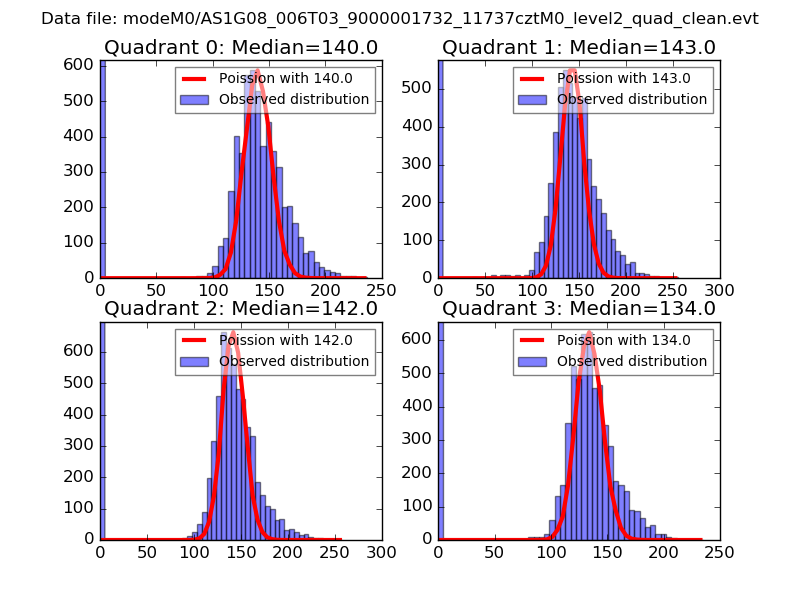 |
 |
| Quadrant-wise count rates Data is divided into 100 sec bins |
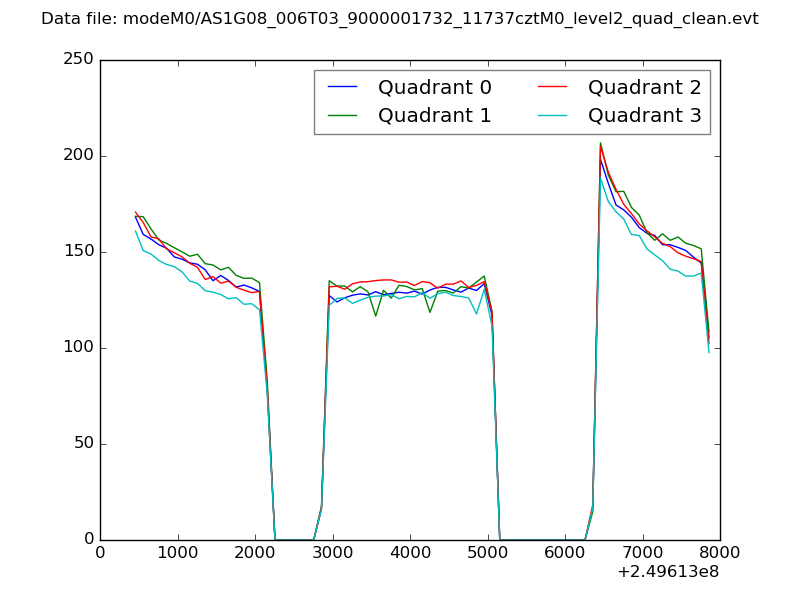 |
|
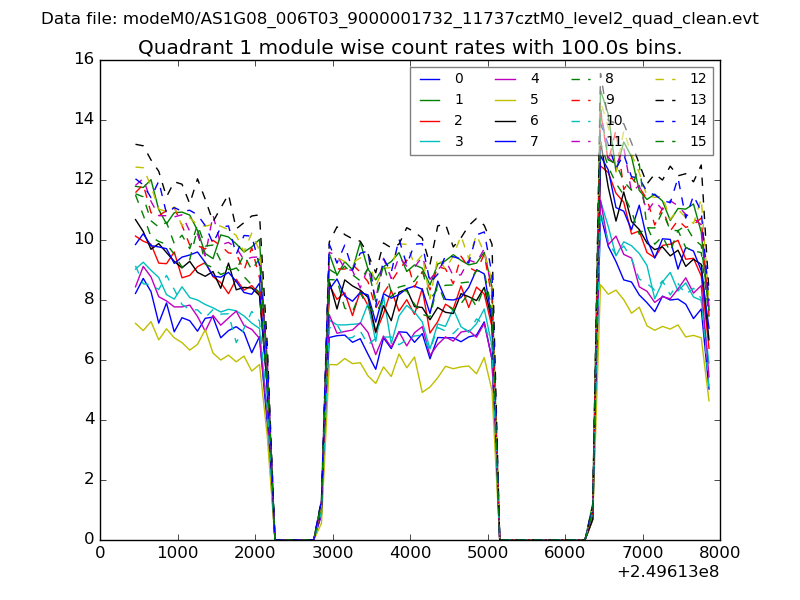
| Module-wise count rates for Quadrant A Data is divided into 100 sec bins |
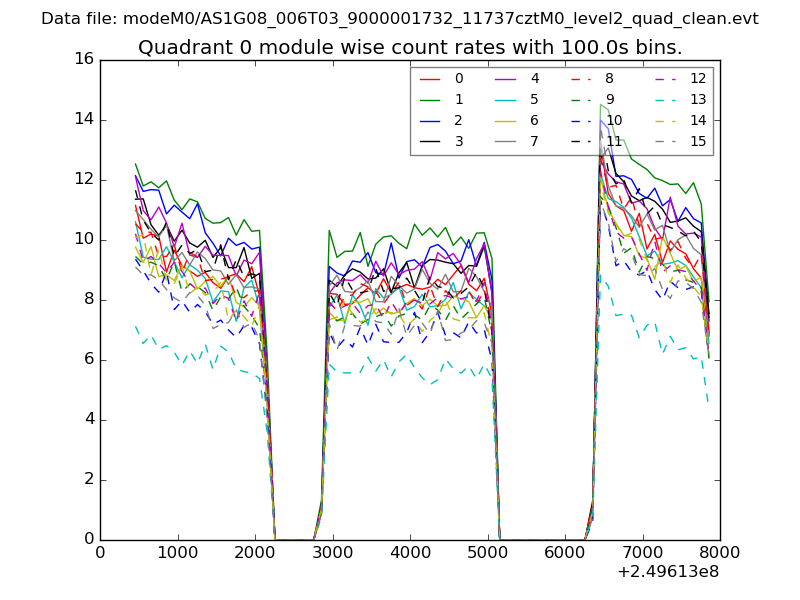 |
 |
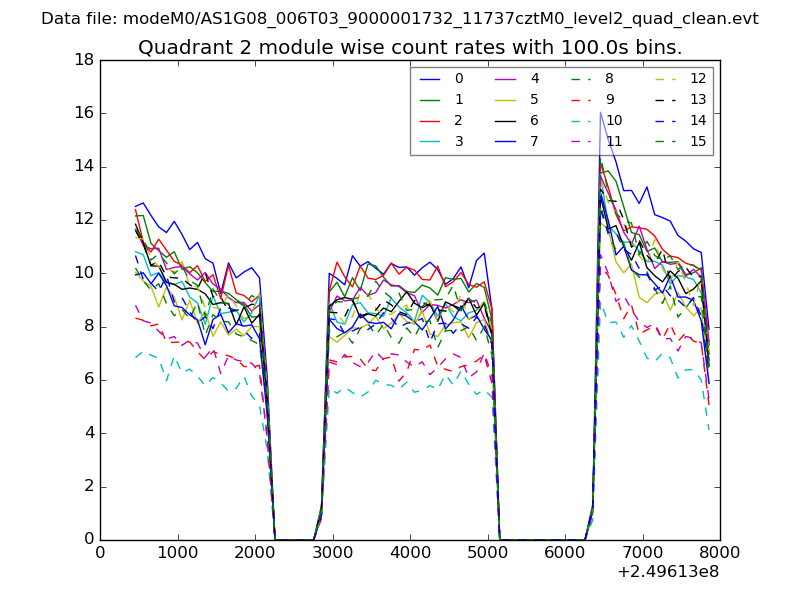
| Module-wise count rates for Quadrant B Data is divided into 100 sec bins |
 |
 |
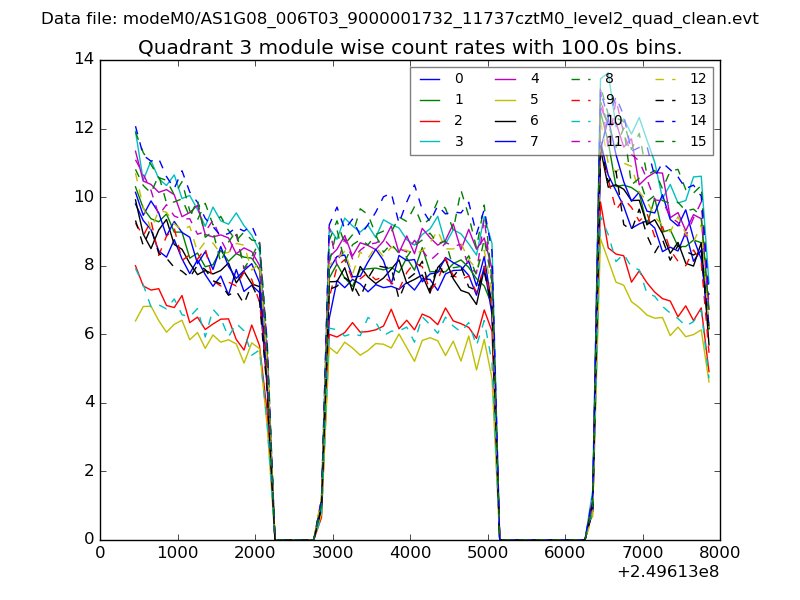
| Module-wise count rates for Quadrant C Data is divided into 100 sec bins |
 |
 |
| Module-wise count rates for Quadrant D Data is divided into 100 sec bins |
 |
 |
| Parameter | Plot |
|---|---|
| CZT HV Monitor | 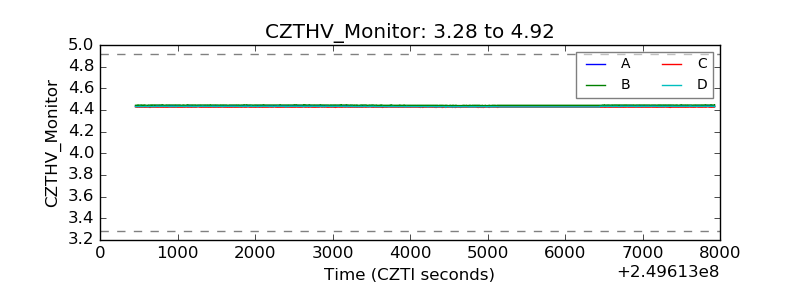 |
| D_VDD | 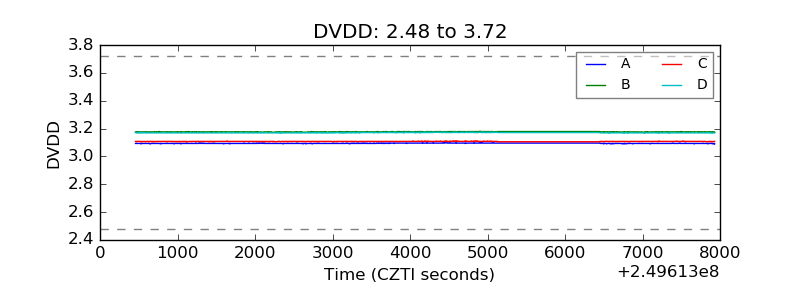 |
| Temperature 1 |  |
| Veto HV Monitor | 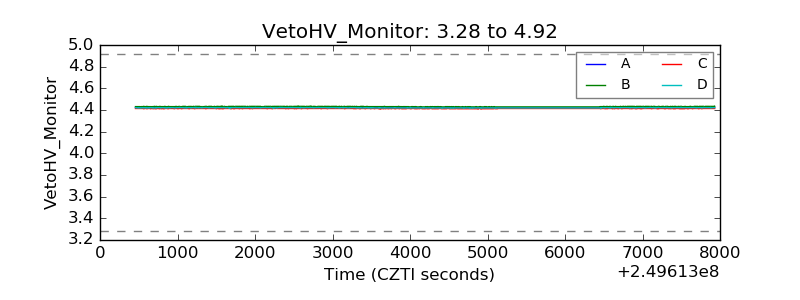 |
| Veto LLD |  |
| Alpha Counter | 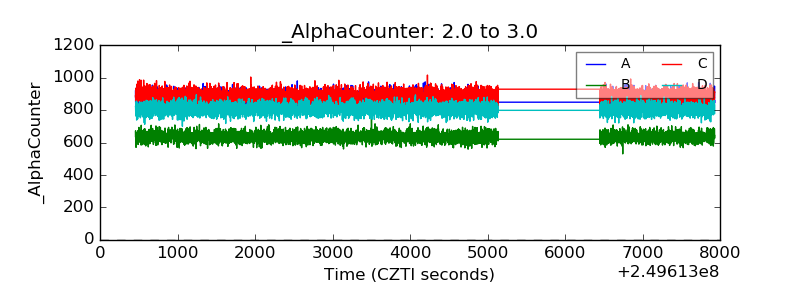 |
| _CPM_Rate | 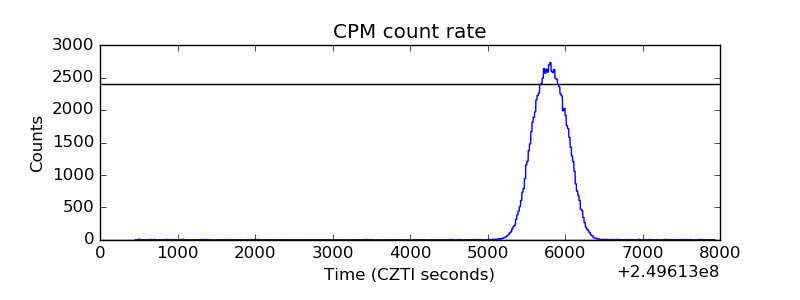 |
| CZT Counter | 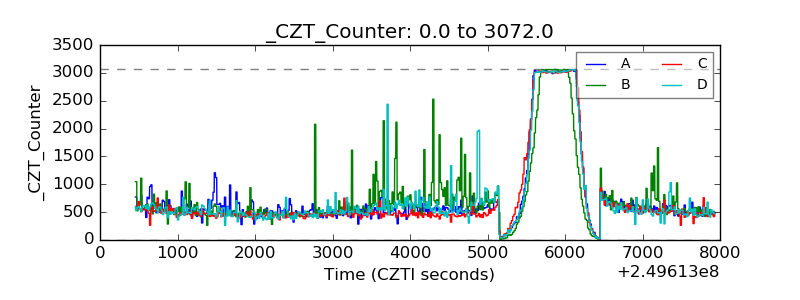 |
| +2.5 Volts monitor |  |
| +5 Volts monitor |  |
| _ROLL_ROT | 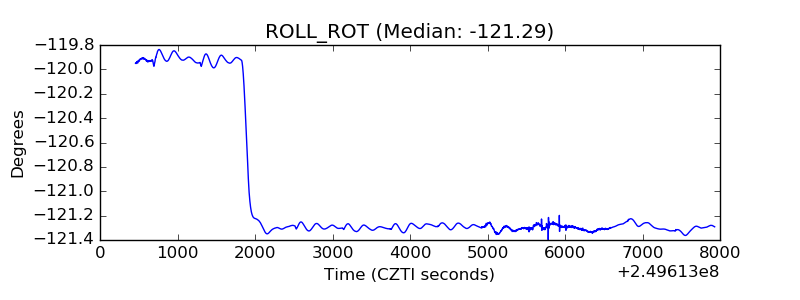 |
| _Roll_DEC | 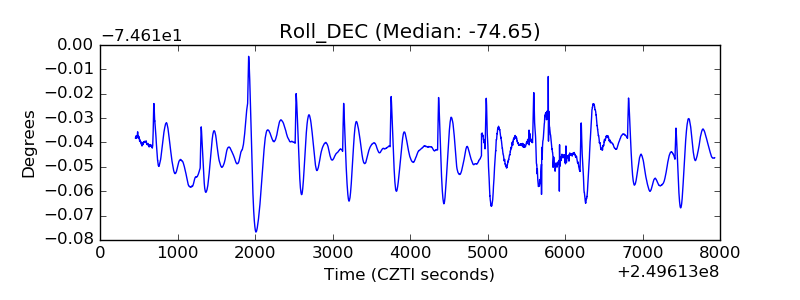 |
| _Roll_RA | 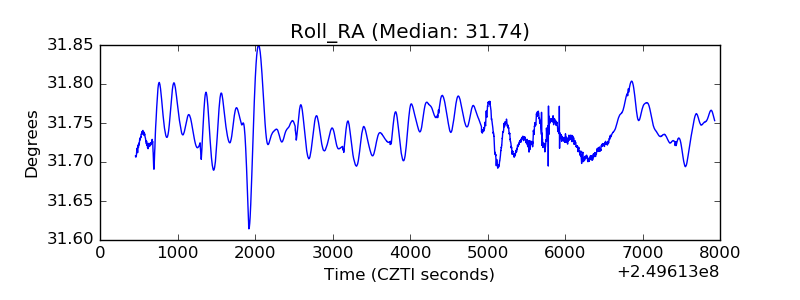 |
| Veto Counter | 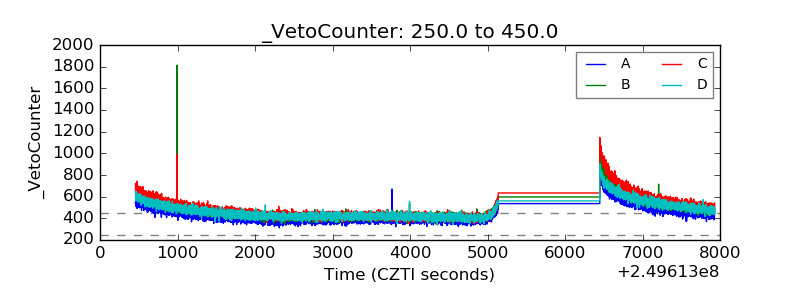 |